


Silver Price Forecast: XAG/USD trades below $41.00 mark, down over 1% for the day
- Silver corrects sharply from a 14-year peak as overbought conditions prompt profit-taking.
- The technical setup favors bulls and backs the case for the emergence of some dip-buying.
- Weakness below the 23.6% Fibo. level could drag the XAG/USD towards the $39.50 support.
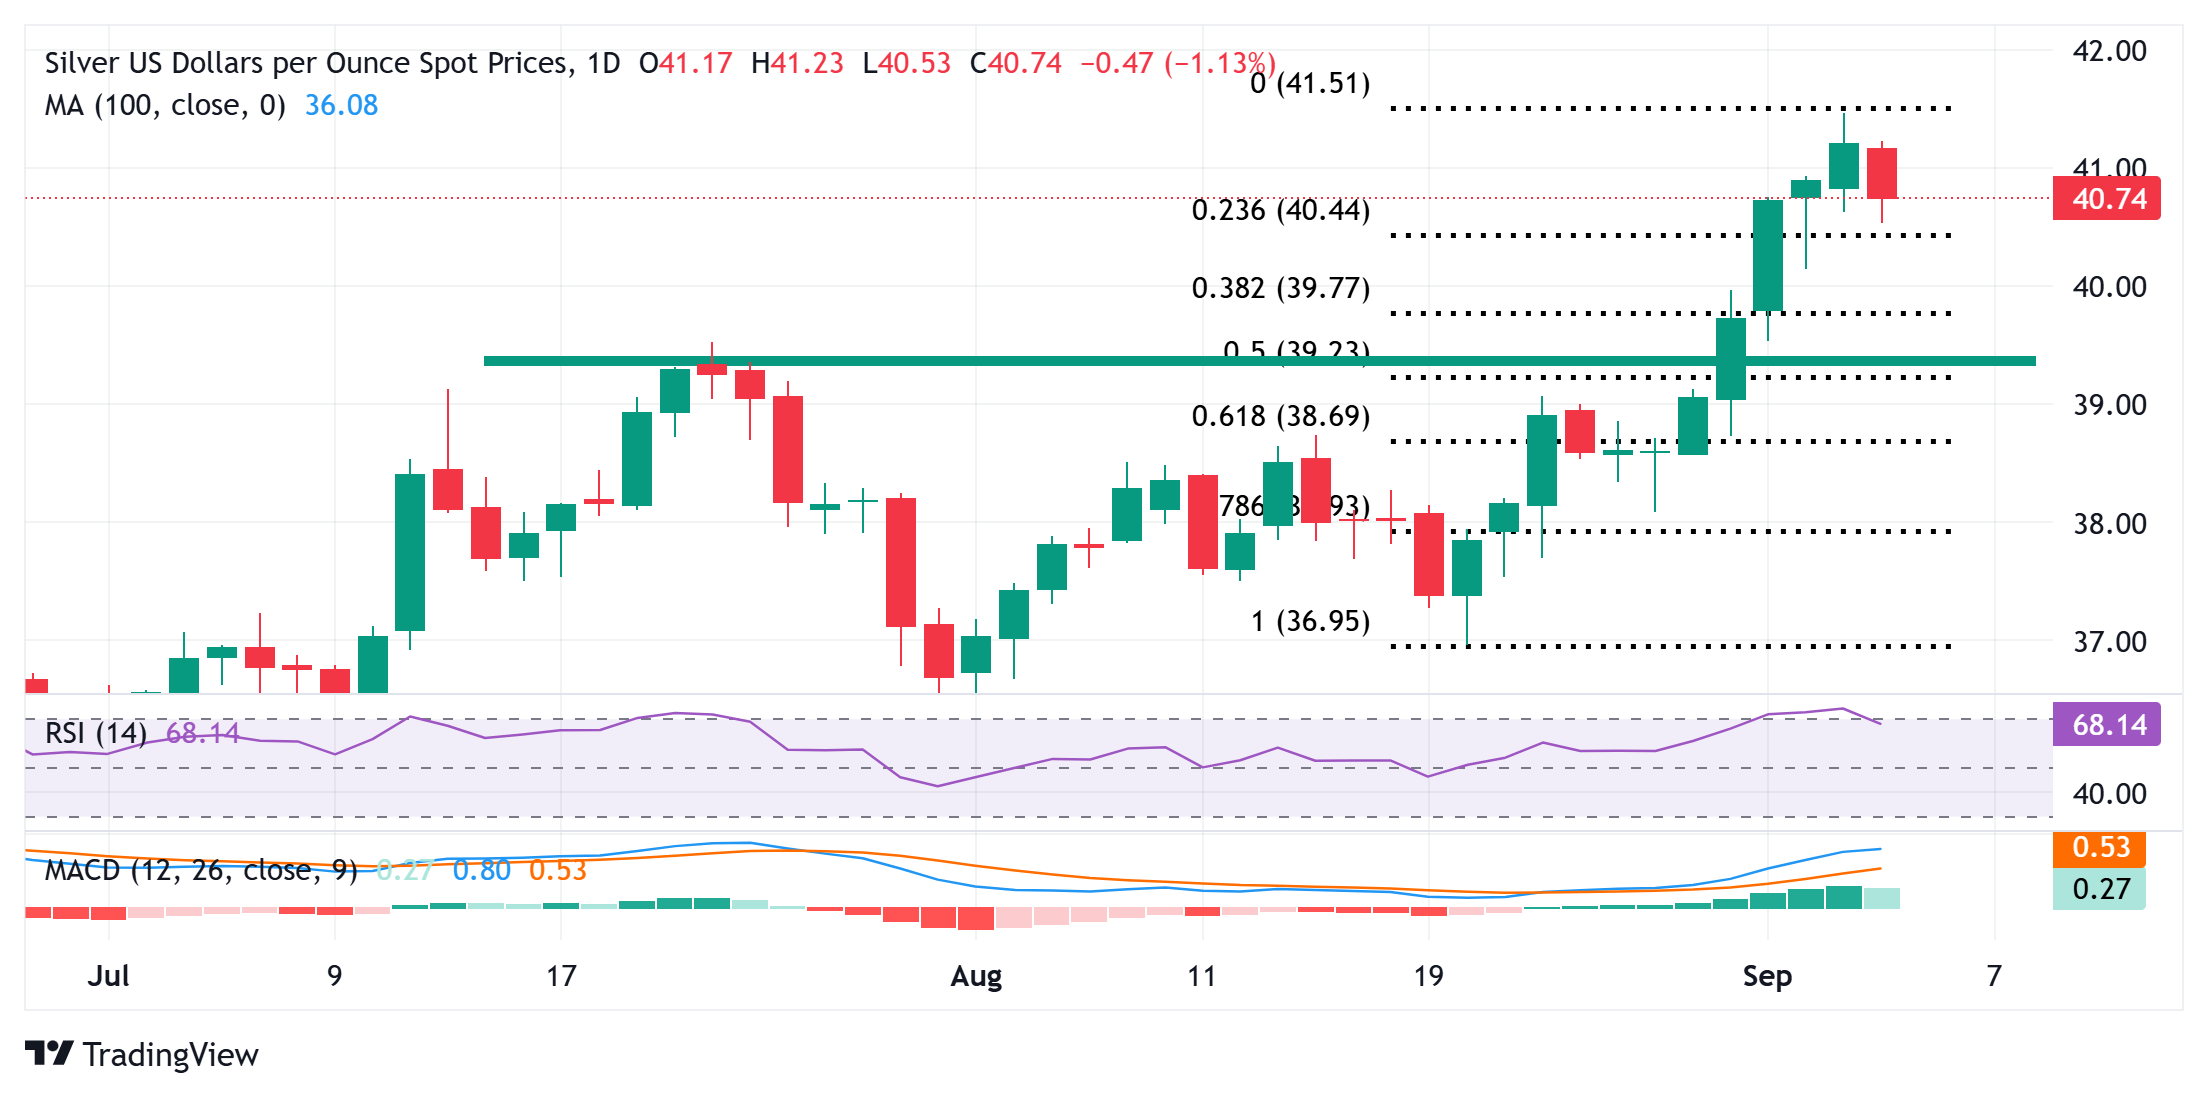
Silver (XAG/USD) extends the previous day's late pullback from the vicinity of mid-$41.00s, or its highest level since September 2011, and attracts heavy selling during the Asian session on Thursday. The white metal now seems to have snapped a five-day winning streak and currently trades around the $40.75 region, down over 1% for the day.
From a technical perspective, the intraday decline could be attributed to some profit-taking following the recent sharp move up witnessed over the past two weeks or so, and slightly overbought conditions on the daily chart. However, this week's breakout through the previous year-to-date high and a subsequent strength beyond $40.00 psychological mark favors the XAG/USD bulls.
Hence, any further slide is more likely to find decent support near the $40.40 area, representing the 23.6% Fibonacci retracement level of the latest upswing from the August 20 low. That said, some follow-through selling might expose the $40.00 mark, which should act as a key pivotal point, and a convincing break below could drag the XAG/USD to the $39.50-$39.40 support zone.
On the flip side, the $41.00 round figure now seems to act as an immediate hurdle, above which the XAG/USD could climb back towards challenging the multi-year peak, around the $41.45 region touched on Wednesday. The momentum could extend further towards reclaiming the $42.00 mark before the XAG/USD eventually climbs to the next relevant hurdle near the $42.65 region.
Silver daily chart
Silver FAQs
Silver is a precious metal highly traded among investors. It has been historically used as a store of value and a medium of exchange. Although less popular than Gold, traders may turn to Silver to diversify their investment portfolio, for its intrinsic value or as a potential hedge during high-inflation periods. Investors can buy physical Silver, in coins or in bars, or trade it through vehicles such as Exchange Traded Funds, which track its price on international markets.
Silver prices can move due to a wide range of factors. Geopolitical instability or fears of a deep recession can make Silver price escalate due to its safe-haven status, although to a lesser extent than Gold's. As a yieldless asset, Silver tends to rise with lower interest rates. Its moves also depend on how the US Dollar (USD) behaves as the asset is priced in dollars (XAG/USD). A strong Dollar tends to keep the price of Silver at bay, whereas a weaker Dollar is likely to propel prices up. Other factors such as investment demand, mining supply – Silver is much more abundant than Gold – and recycling rates can also affect prices.
Silver is widely used in industry, particularly in sectors such as electronics or solar energy, as it has one of the highest electric conductivity of all metals – more than Copper and Gold. A surge in demand can increase prices, while a decline tends to lower them. Dynamics in the US, Chinese and Indian economies can also contribute to price swings: for the US and particularly China, their big industrial sectors use Silver in various processes; in India, consumers’ demand for the precious metal for jewellery also plays a key role in setting prices.
Silver prices tend to follow Gold's moves. When Gold prices rise, Silver typically follows suit, as their status as safe-haven assets is similar. The Gold/Silver ratio, which shows the number of ounces of Silver needed to equal the value of one ounce of Gold, may help to determine the relative valuation between both metals. Some investors may consider a high ratio as an indicator that Silver is undervalued, or Gold is overvalued. On the contrary, a low ratio might suggest that Gold is undervalued relative to Silver.
Artigos Recomendados


