


USD/CHF Price Analysis: A final obstacle for bulls to overcome
- USD/CHF has risen over 8.0% since the start of 2024.
- It has broken above some very important levels.
- The question now is, has USD/CHF changed trend?
USD/CHF was in a long-term downtrend until the pair found a floor at the end of 2023.
Since then USD/CHF has made steady progress higher, gaining over 8.0% in the first three months of 2024.
An interesting question now is whether from a technical point of view, the long-term trend has changed from bearish to bullish?
This is important because, as the old adage goes “the trend is your friend until the bend at the end.”
In short, has USD/CHF met its “bend” and made enough progress to reverse its downtrend?
USD/CHF Weekly Chart
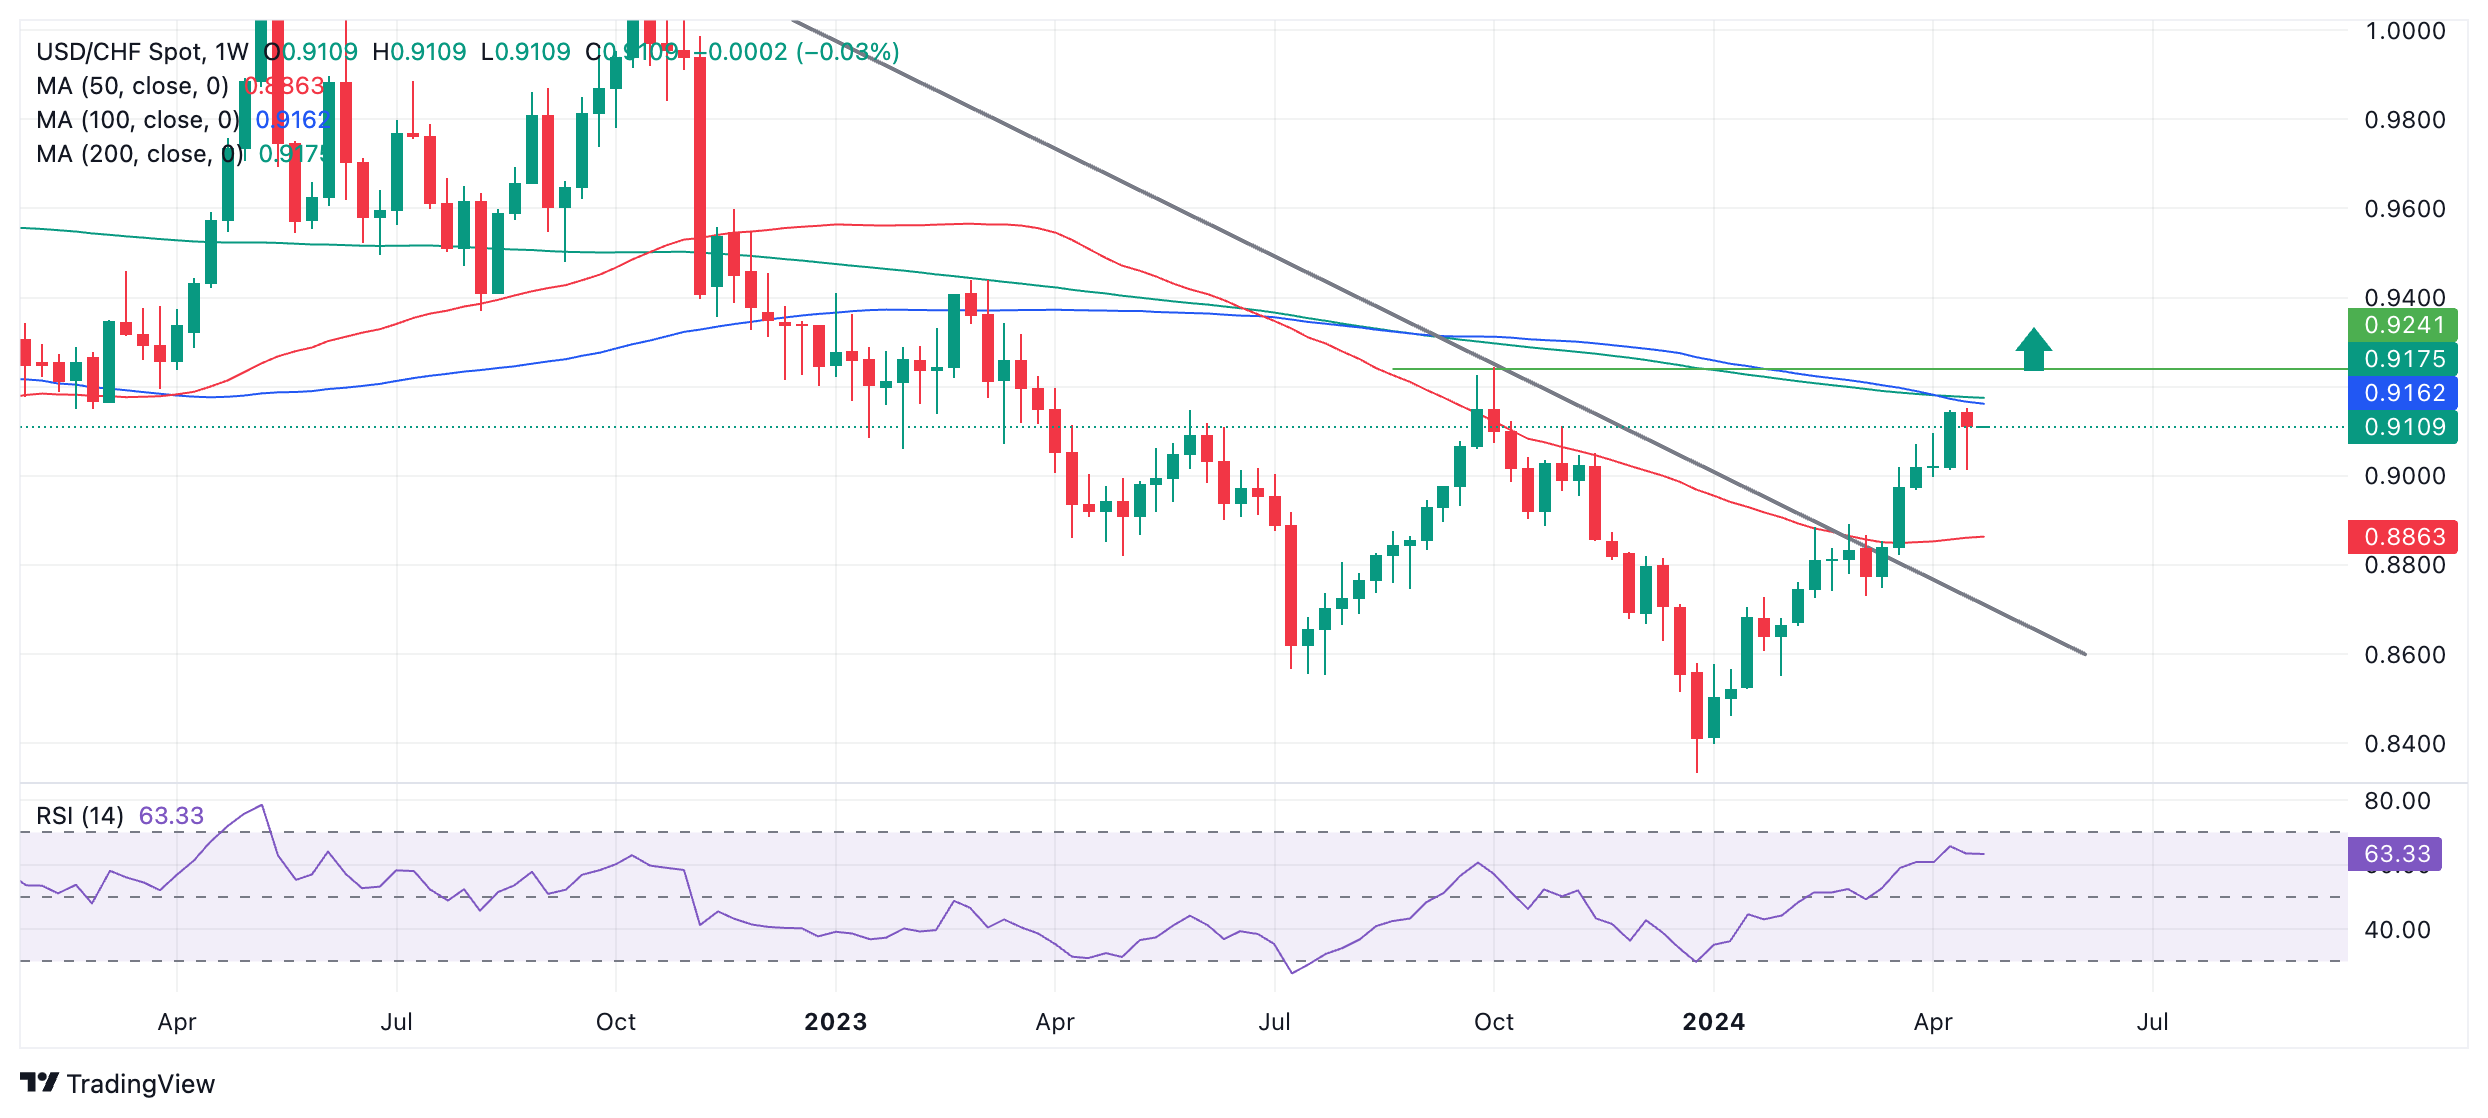
In February USD/CHF rose above the last major lower high of the prior downtrend which formed in December 2023, at 0.8821. Technical analysts consider this as a key level. If price breaks above it, it increases the chances the asset has undergone a trend reversal.
In March USD/CHF broke above the red 50-week Simple Moving Average (SMA) – another sign the long-term downtrend might be ending. At the same time it breached a long-term down trendline, providing yet more evidence of a reversal.
During its rise USD/CHF has formed two sets of peaks and troughs (two “higher highs” and two “higher lows”). This further suggests a heightened probability the pair might be reversing trend. If it had only formed one peak and trough it might still be said to be correcting rather than reversing. This is because it could still be a common ABC three-wave correction. Because it has formed two, however, this cannot now be the case.
Momentum has been reasonably solid during the move higher, though not quite as strong as the bearish momentum on the corresponding way down – this unfortunately is evidence the move may yet still be only a pullback within a broader downtrend. The difference in momentum is mild, however, reducing the risk that is the case.
USD/CHF has now reached a formidable band of resistance from the 100-week and 200-week SMAs coiling just above the current highs in the 0.9100s. These remain a tough obstacle for bears to overcome.
To really seal the deal on a reversal of the long-term downtrend in USD/CHF arguably must decisively break above the two major MAs currently bearing down on price.
A decisive break is one characterized by the formation of a long green bullish candle that pierces through the MAs and closes near its high or three consecutive bullish candles that breach the level.
Another key level is the October 2023 high at 0.9244 and this should arguably also be breached for there to be enough evidence to support the view USD/CHF had entered an uptrend.
Last week USD/CHF also formed a bearish Hanging Man Japanese candlestick pattern which if followed by a bearish candle this week would signal a potential short-term reversal lower. This would keep bearish hopes alive and delay further the moment when it could be said with any degree of confidence that USD/CHF was in a long-term uptrend.
Artigos Recomendados


