

EUR/USD rebounds to 1.1680 as weak US data fuels Fed cut bets
- EUR/USD climbs 0.37% to 1.1679 as Dollar Index dips 0.25% to 98.06 following disappointing US economic releases.
- JOLTS report shows vacancies fall sharply, layoffs rise; tariffs blamed for worsening US labor market conditions.
- EU Services PMI misses forecasts at 50.5, while Producer Prices ease, keeping ECB policy outlook cautiously dovish.
The EUR/USD recovers ground following Tuesday’s losses that drove the pair below key support levels around the 50 and 20-day SMAs. A confirmation of weakness in the US labor market by JOLTS data, increased the chances of a rate cut by the Federal Reserve. The pair trades at 1.1679, up 0.37%.
Dollar softens after JOLTS and factory orders confirm labor market slowdown, boosting Euro despite softer EU PMI
The Job Openings and Labor Turnover Survey (JOLTS) in July, showed that vacancies fell from 7.437 million a month ago to 7.181 million, reveled the Bureau of Labor Statistics (BLS). Hiring increased by 41,000, while layoffs rose by 12,000. Economists attributed the ongoing labor market slowdown to tariffs imposed by President Donald Trump.
At the same time, the US Census Bureau showed that Factory Orders contracted by -1.3% MoM in July, slightly better than expectations for a -1.4% decline. Combined with Tuesday’s ISM Manufacturing PMI—which contracted for the sixth consecutive month—the data reinforced concerns that factory activity continues to weaken.
Consequently, the US Dollar Index (DXY), which tracks the performance of the buck’s value against a basket of six currencies, is down 0.25% at 98.06 as of writing.
Broad Dollar weakness, sponsored a leg up in the EUR/USD as the latest HCOB Services PMI in August for the European Union (EU) missed forecasts of 50.7, came in at 50.5.
Other data in the EU showed that Producer Prices dupped in the EU increased by 0.4% MoM in July down from 0.8% print in June. In the twelve months to July, prices rose 0.2% down from 0.6% a year ago.
Market participants await Friday's Nonfarm Payrolls report. Economists anticipate an increase of 75,000 jobs in August, and it is expected a rise in the Unemployment Rate, from 4.2% to 4.3%.
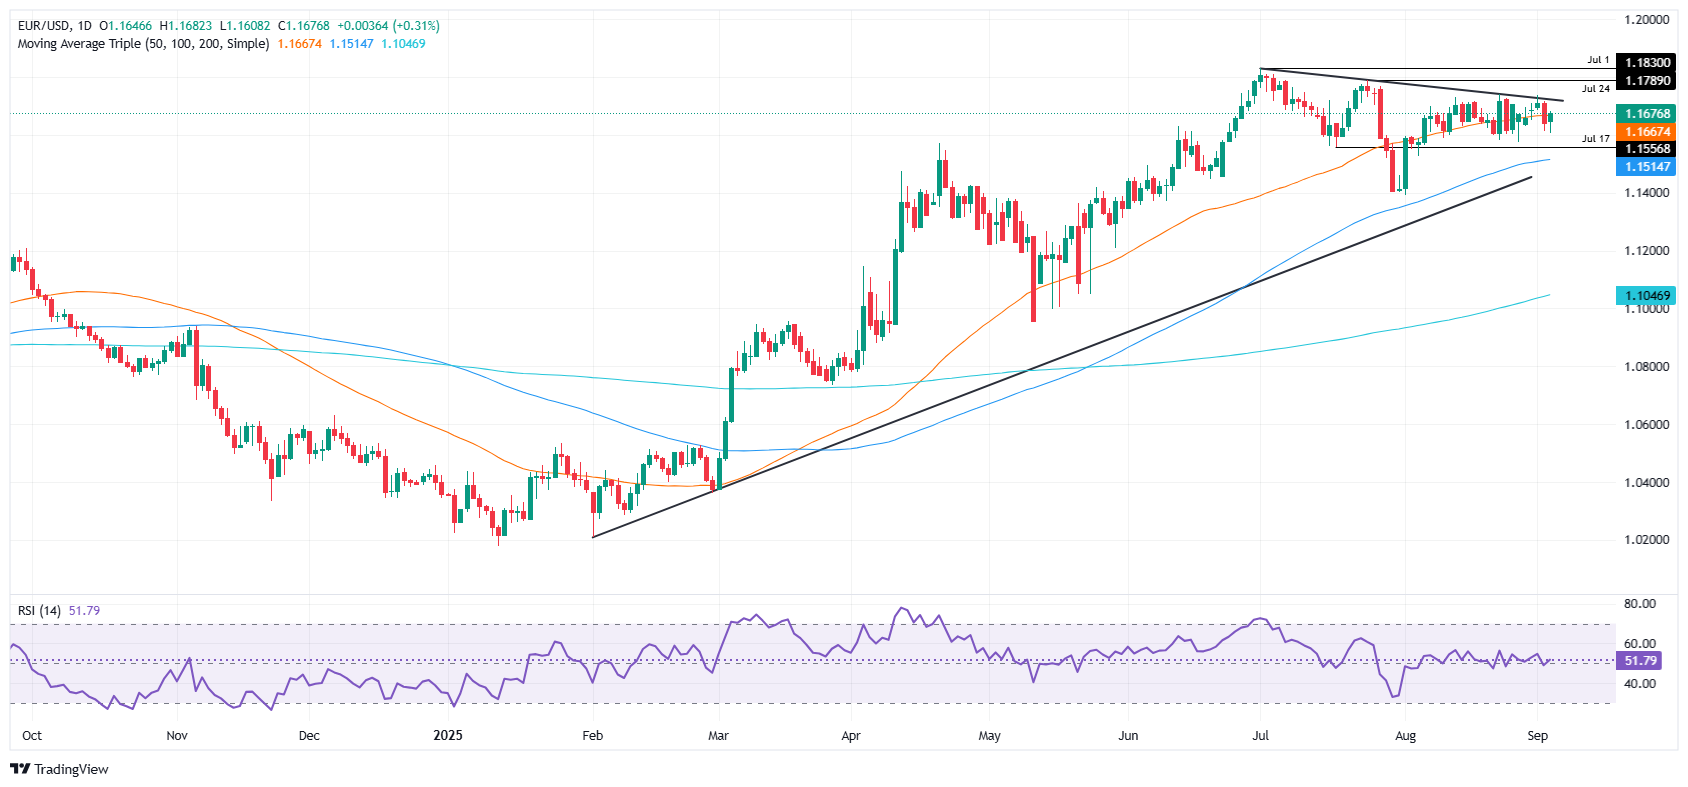
EUR/USD Price Forecast: Technical outlook
The EUR/USD has risen past 1.1650, which has opened the door for a test of 1.1700. Although the Relative Strength Index (RSI) has turned bullish, it remains far from clearing its latest peak, an indication that in the last 14 days, consolidation has been the name of the game.
Nevertheless, if EUR/USD climbs past September 1 high of 1.1736, a test of 1.1800 and the year-to-date (YTD) high of 1.1829 is on the cards. Otherwise, a daily close below 1.1650 could put into play the 1.1600 mark ahead of the 100-day SMA at 1.1520.
Euro Price This week
The table below shows the percentage change of Euro (EUR) against listed major currencies this week. Euro was the strongest against the Japanese Yen.
| USD | EUR | GBP | JPY | CAD | AUD | NZD | CHF | |
|---|---|---|---|---|---|---|---|---|
| USD | 0.17% | 0.33% | 0.68% | 0.38% | -0.04% | 0.15% | 0.46% | |
| EUR | -0.17% | 0.16% | 0.45% | 0.21% | -0.21% | -0.00% | 0.29% | |
| GBP | -0.33% | -0.16% | 0.20% | 0.04% | -0.37% | -0.17% | 0.18% | |
| JPY | -0.68% | -0.45% | -0.20% | -0.23% | -0.71% | -0.48% | -0.19% | |
| CAD | -0.38% | -0.21% | -0.04% | 0.23% | -0.41% | -0.21% | 0.13% | |
| AUD | 0.04% | 0.21% | 0.37% | 0.71% | 0.41% | 0.21% | 0.55% | |
| NZD | -0.15% | 0.00% | 0.17% | 0.48% | 0.21% | -0.21% | 0.34% | |
| CHF | -0.46% | -0.29% | -0.18% | 0.19% | -0.13% | -0.55% | -0.34% |
The heat map shows percentage changes of major currencies against each other. The base currency is picked from the left column, while the quote currency is picked from the top row. For example, if you pick the Euro from the left column and move along the horizontal line to the US Dollar, the percentage change displayed in the box will represent EUR (base)/USD (quote).
Artigos Recomendados


