
Australian Dollar remains subdued as President Trump threatens new tariffs on Chinese goods
- The Australian Dollar struggles as Trump threatens to impose a 200% tariff on Chinese goods.
- RBA Meeting Minutes suggested further rate cuts to be needed in the coming year.
- President Trump removed Fed Governor Cook from her position on the Fed's board of directors.
The Australian Dollar (AUD) depreciates against the US Dollar (USD) on Tuesday, extending its losses for the second successive session. The AUD/USD pair remains subdued as US President Donald Trump warned that he may impose a 200% tariff on Chinese goods if China refuses to supply magnets to the United States (US), per Reuters. It is worth noting that any change in the Chinese economy could influence AUD as China and Australia are close trading partners.
The AUD also faces challenges as the Reserve Bank of Australia (RBA) Minutes of its August monetary policy meeting suggested that board members agreed that some further reduction in the cash rate is likely to be needed in the coming year.
RBA Meeting Minutes also indicated that policymakers consider the pace of rate cuts would be determined by incoming data and the balance of global risks. The board saw arguments for both a gradual pace of easing and for a faster pace, while the labor market remained a little tight, inflation was still above the midpoint, and domestic demand was recovering.
The US Dollar struggles amid concerns over Federal Reserve (Fed) independence after the US President Donald Trump removed Fed Governor Lisa Cook. Trump posted a letter on social media early Tuesday, saying that he was removing Fed Governor Cook from her position on the Fed's board of directors. Cook’s exit will allow Trump to tap a replacement, helping him to exert more control over Fed policy, per Reuters.
Australian Dollar weakens despite softer US Dollar as risk aversion weighs
- The US Dollar Index (DXY), which measures the value of the US Dollar against six major currencies, is losing ground and trading around 98.30 at the time of writing. Traders will likely await the upcoming release of the Q2 US Gross Domestic Product Annualized and July Personal Consumption Expenditures Price Index data, the Fed's preferred inflation gauge.
- President Trump threatened "subsequent additional tariffs" and export restrictions on advanced technology and semiconductors in retaliation for digital services taxes that hit American technology companies, per Bloomberg.
- Fed Chair Jerome Powell said at the Jackson Hole symposium on Friday that risks to the job market were rising, but also noted inflation remained a threat and that a decision wasn't set in stone. Powell also stated that the Fed still believes it may not need to tighten policy solely based on uncertain estimates that employment may be beyond its maximum sustainable level.
- The US Initial Jobless Claims rose to 235K for the previous week, an eight-week high and above the consensus estimate of 225K, suggesting some softening in labor market conditions.
- Strong PMI data paired with rising jobless claims highlights the Federal Reserve’s challenge of weighing persistent inflation pressures against evidence of a softening labor market. According to the CME FedWatch tool, Fed funds futures traders are now pricing in a 74% chance of a rate reduction in September, down from 82% on Wednesday.
- Chicago Fed President Austan Goolsbee said on Thursday that September’s Fed meeting remains open for action. Goolsbee further stated that the Federal Reserve has been receiving mixed signals on the economy. Boston Fed President Susan Collins signaled openness to a rate cut as soon as September, citing tariff headwinds and potential labor market softness, even as near-term inflation risks persist.
- The preliminary S&P Global US Composite PMI picked up pace in August, with the index at 55.4 versus 55.1 prior. Meanwhile, the US Manufacturing PMI rose to 53.3 from 49.8 prior, surpassing the market consensus of 49.5. Services PMI eased to 55.4 from 55.7 previous reading, but was stronger than the 54.2 expected.
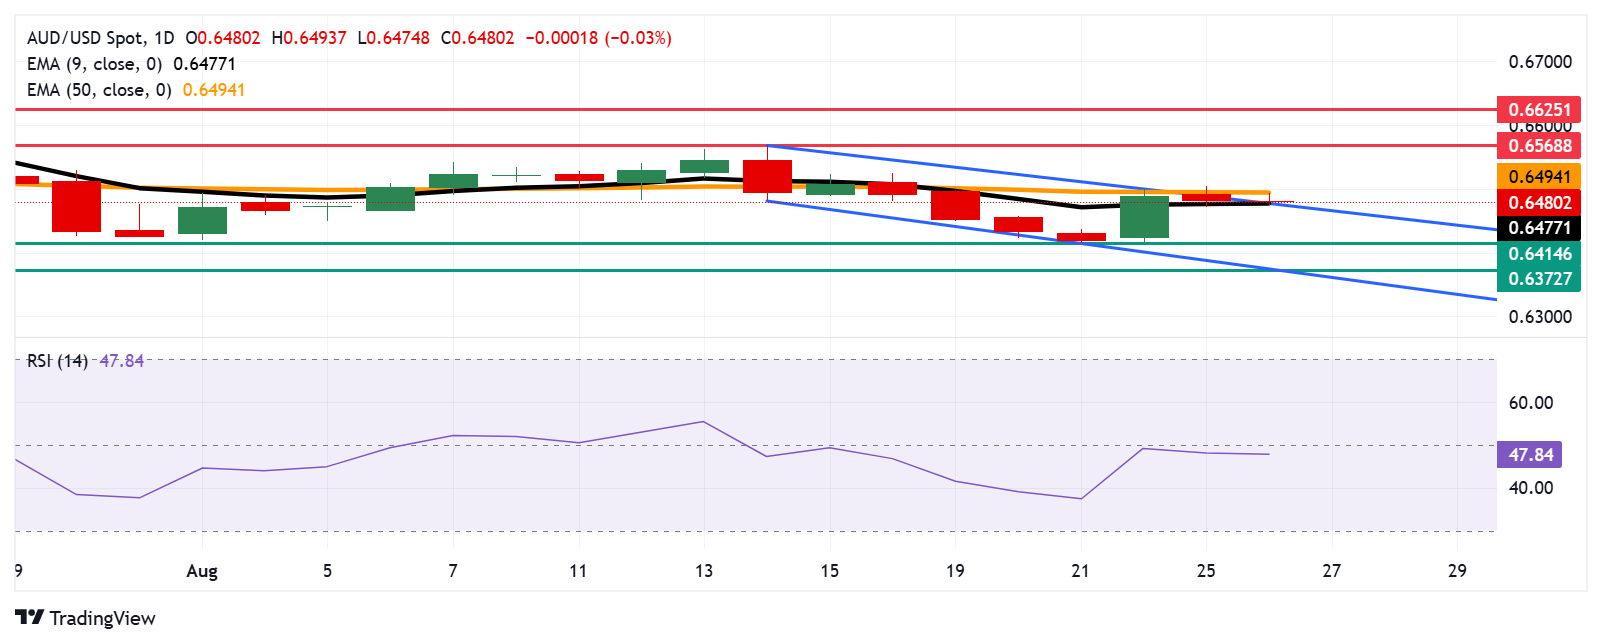
Australian Dollar tests confluence resistance zone around 0.6500
The AUD/USD pair is trading around 0.6480 on Tuesday. The technical analysis of the daily chart indicates that the pair is attempting to break above the descending channel pattern, suggesting a potential shift to bullish from bearish bias. Additionally, the pair is trading above the nine-day EMA, indicating short-term price momentum is stronger.
The AUD/USD pair is testing the immediate resistance zone around the upper boundary of the descending channel at 0.6590, aligned with the 50-day Exponential Moving Average (EMA) at 0.6494. A successful breach above this crucial resistance zone may confirm the bullish shift and support the pair to approach the monthly high at 0.6568, reached on August 14, followed by the nine-month high of 0.6625, which was recorded on July 24.
On the downside, the AUD/USD pair may find immediate support at the nine-day EMA of 0.6477. A break below this level would weaken the short-term price momentum and put downward pressure on the pair to target the two-month low of 0.6414, recorded on August 21. Further declines would find support near the three-month low of 0.6372, reached on June 23, aligned with the descending channel’s lower boundary.
AUD/USD: Daily Chart
Australian Dollar Price Today
The table below shows the percentage change of Australian Dollar (AUD) against listed major currencies today. Australian Dollar was the weakest against the Swiss Franc.
| USD | EUR | GBP | JPY | CAD | AUD | NZD | CHF | |
|---|---|---|---|---|---|---|---|---|
| USD | -0.15% | -0.11% | -0.28% | -0.07% | -0.02% | 0.07% | -0.05% | |
| EUR | 0.15% | 0.10% | 0.00% | 0.08% | 0.18% | 0.46% | 0.12% | |
| GBP | 0.11% | -0.10% | -0.12% | -0.00% | 0.12% | 0.34% | 0.01% | |
| JPY | 0.28% | 0.00% | 0.12% | 0.13% | 0.13% | 0.50% | 0.00% | |
| CAD | 0.07% | -0.08% | 0.00% | -0.13% | 0.07% | 0.35% | -0.12% | |
| AUD | 0.02% | -0.18% | -0.12% | -0.13% | -0.07% | 0.09% | -0.20% | |
| NZD | -0.07% | -0.46% | -0.34% | -0.50% | -0.35% | -0.09% | -0.34% | |
| CHF | 0.05% | -0.12% | -0.01% | -0.01% | 0.12% | 0.20% | 0.34% |
The heat map shows percentage changes of major currencies against each other. The base currency is picked from the left column, while the quote currency is picked from the top row. For example, if you pick the Australian Dollar from the left column and move along the horizontal line to the US Dollar, the percentage change displayed in the box will represent AUD (base)/USD (quote).
Australian Dollar FAQs
One of the most significant factors for the Australian Dollar (AUD) is the level of interest rates set by the Reserve Bank of Australia (RBA). Because Australia is a resource-rich country another key driver is the price of its biggest export, Iron Ore. The health of the Chinese economy, its largest trading partner, is a factor, as well as inflation in Australia, its growth rate and Trade Balance. Market sentiment – whether investors are taking on more risky assets (risk-on) or seeking safe-havens (risk-off) – is also a factor, with risk-on positive for AUD.
The Reserve Bank of Australia (RBA) influences the Australian Dollar (AUD) by setting the level of interest rates that Australian banks can lend to each other. This influences the level of interest rates in the economy as a whole. The main goal of the RBA is to maintain a stable inflation rate of 2-3% by adjusting interest rates up or down. Relatively high interest rates compared to other major central banks support the AUD, and the opposite for relatively low. The RBA can also use quantitative easing and tightening to influence credit conditions, with the former AUD-negative and the latter AUD-positive.
China is Australia’s largest trading partner so the health of the Chinese economy is a major influence on the value of the Australian Dollar (AUD). When the Chinese economy is doing well it purchases more raw materials, goods and services from Australia, lifting demand for the AUD, and pushing up its value. The opposite is the case when the Chinese economy is not growing as fast as expected. Positive or negative surprises in Chinese growth data, therefore, often have a direct impact on the Australian Dollar and its pairs.
Iron Ore is Australia’s largest export, accounting for $118 billion a year according to data from 2021, with China as its primary destination. The price of Iron Ore, therefore, can be a driver of the Australian Dollar. Generally, if the price of Iron Ore rises, AUD also goes up, as aggregate demand for the currency increases. The opposite is the case if the price of Iron Ore falls. Higher Iron Ore prices also tend to result in a greater likelihood of a positive Trade Balance for Australia, which is also positive of the AUD.
The Trade Balance, which is the difference between what a country earns from its exports versus what it pays for its imports, is another factor that can influence the value of the Australian Dollar. If Australia produces highly sought after exports, then its currency will gain in value purely from the surplus demand created from foreign buyers seeking to purchase its exports versus what it spends to purchase imports. Therefore, a positive net Trade Balance strengthens the AUD, with the opposite effect if the Trade Balance is negative.
Artigos Recomendados


