


Producer prices are up 6.3%. Consumer prices only 3.7%. This chart shows who eats the gap
The Producer Price Index rose 6.3% in the year to September and the Consumer Price Index 3.7%, the widest gap since 2022. Inside the S&P 500, energy and technology companies collect the difference, the rest pay it, and shoppers get their turn in 2027.
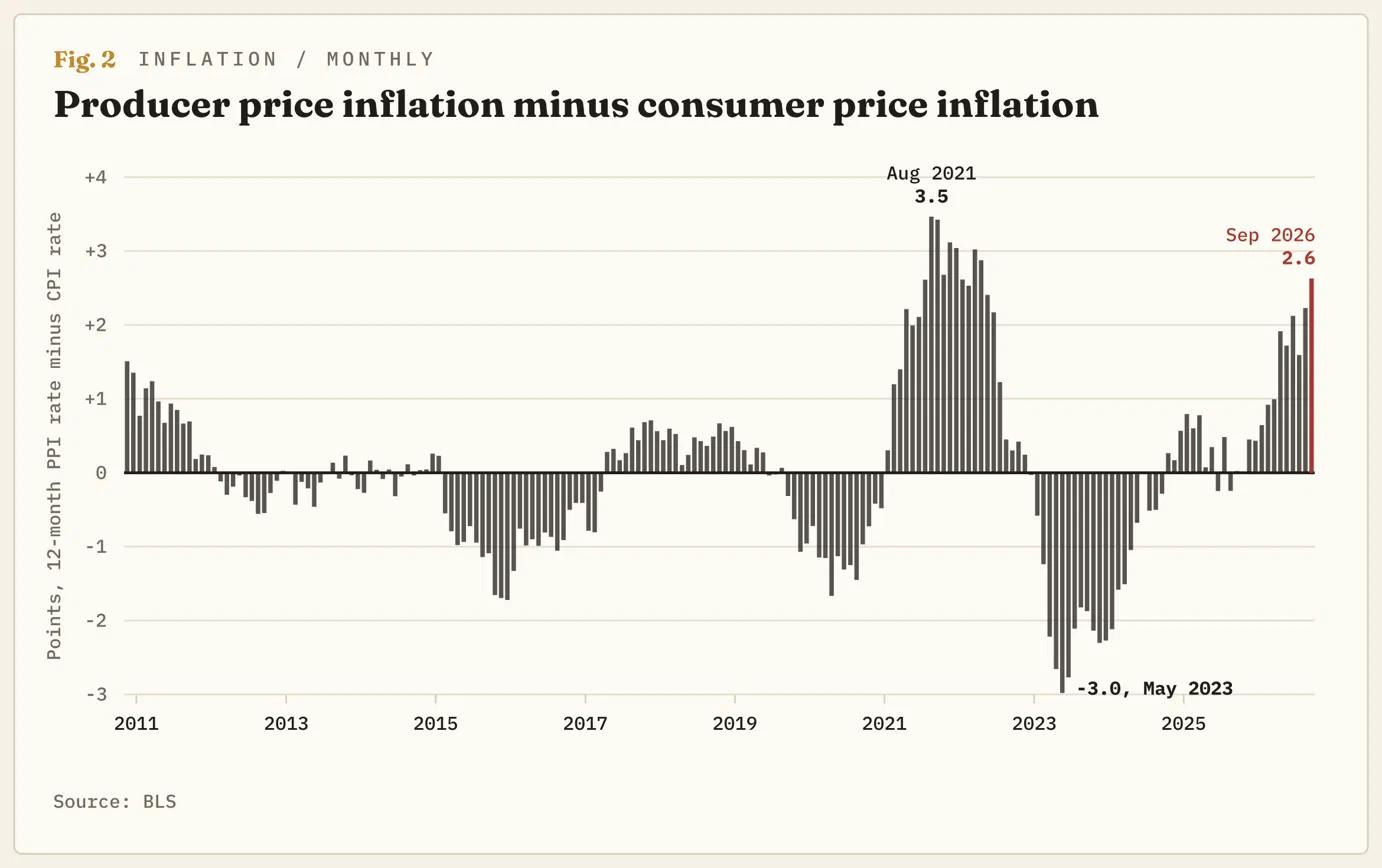
The Bureau of Labor Statistics (BLS) publishes two inflation numbers a month, and in September they came apart. The Producer Price Index (PPI) measures what US businesses get for what they sell, and it rose 6.3% over the year, the most since December 2022. The Consumer Price Index (CPI) measures what households pay, and it rose 3.7%. The 2.6-point gap is the eighth widest in the 16 years the PPI has been published in its current form. The seven wider months all came between August 2021 and April 2022.
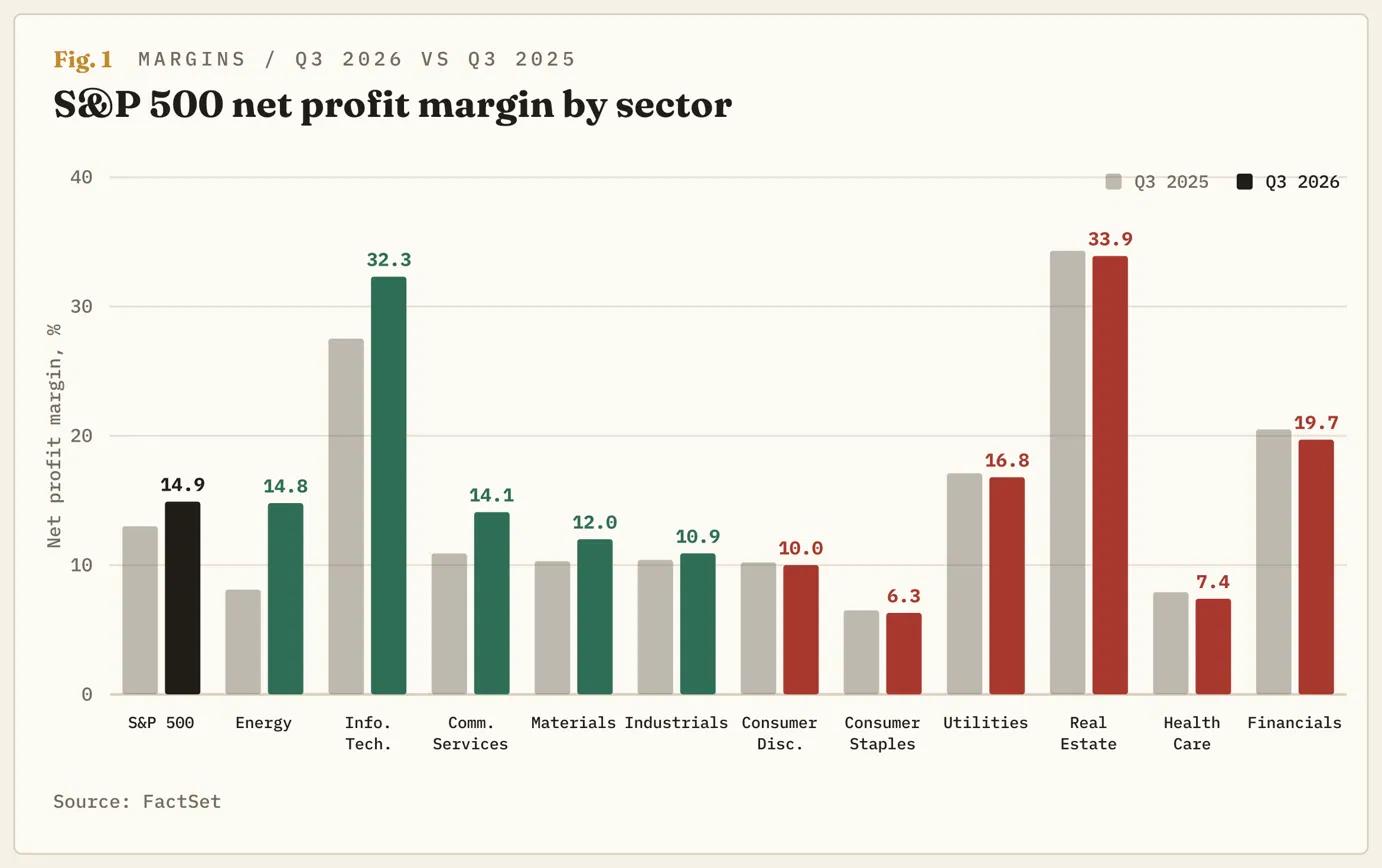
The S&P 500 set a record on October 6 and is trading about 2% below it. FactSet's tally, part reported and part estimated, has its companies keeping 14.9 cents of every dollar of sales as profit this quarter, the second-highest margin since it began counting in 2009. Both are true at once because the index includes companies getting the 6.3% as well as those paying it. The ones reporting this week have started saying which side they're on.
The average is two sectors wide
Part of the gap is arithmetic. The two indexes weigh different things: housing makes up a third of the CPI, which the PPI doesn't measure, and producer prices for energy rose 10.8% in September alone. The rest is money moving from the companies that buy fuel, resin, and freight to the companies that sell them, and the S&P 500 contains both ends of the transaction.
FactSet reports the energy sector's margin at 14.8% vs. 8.1% a year ago, with oil averaging $85.68 per barrel in the quarter, up from $64.97, and earnings up 127.6%. Information Technology's margin has gone from 27.5% to 32.3%. Six of the eleven sectors report lower margins than a year ago, including Consumer Staples, Health Care, and Consumer Discretionary. Across the index, 48% of companies are earning less per dollar of sales than a year ago, yet the index margin is up almost two points. The record it set in the June quarter, 17%, included Alphabet's (GOOG, GOOGL) and Amazon's (AMZN) paper gains on their stakes in Anthropic. The two highest margins since 2009 arrived in consecutive quarters, one from an AI company's valuation and one from a tanker war.
Last time, shoppers paid and the margin fell anyway
The gap was wider than it is now for seven months in 2021 and 2022, and peaked at 3.5 points in August 2021. The index's margin hit a record 13.1% in the June 2021 quarter, as the gap climbed to that peak. Six quarters later it was 11.2%, the lowest since 2020. In the December 2022 quarter, eight of the eleven sectors reported lower margins than a year before. Energy rose from 9.3% to 12.9%, and the same sector is doing the same now from a higher floor.
The gap narrowed from below. The CPI hit 9% in June 2022 as companies passed costs on, yet margins fell anyway. Producer prices ran at 10% or more for eight months, and the shelf price caught up only after they stopped. The S&P 500 fell about 25% from its January 2022 high to its October 2022 low. The difference now is the Federal Reserve (Fed), which raised rates from zero to above 4% during that fall and enters this episode near 4%, having raised them on September 16.
Soap, cigarettes and pickup trucks
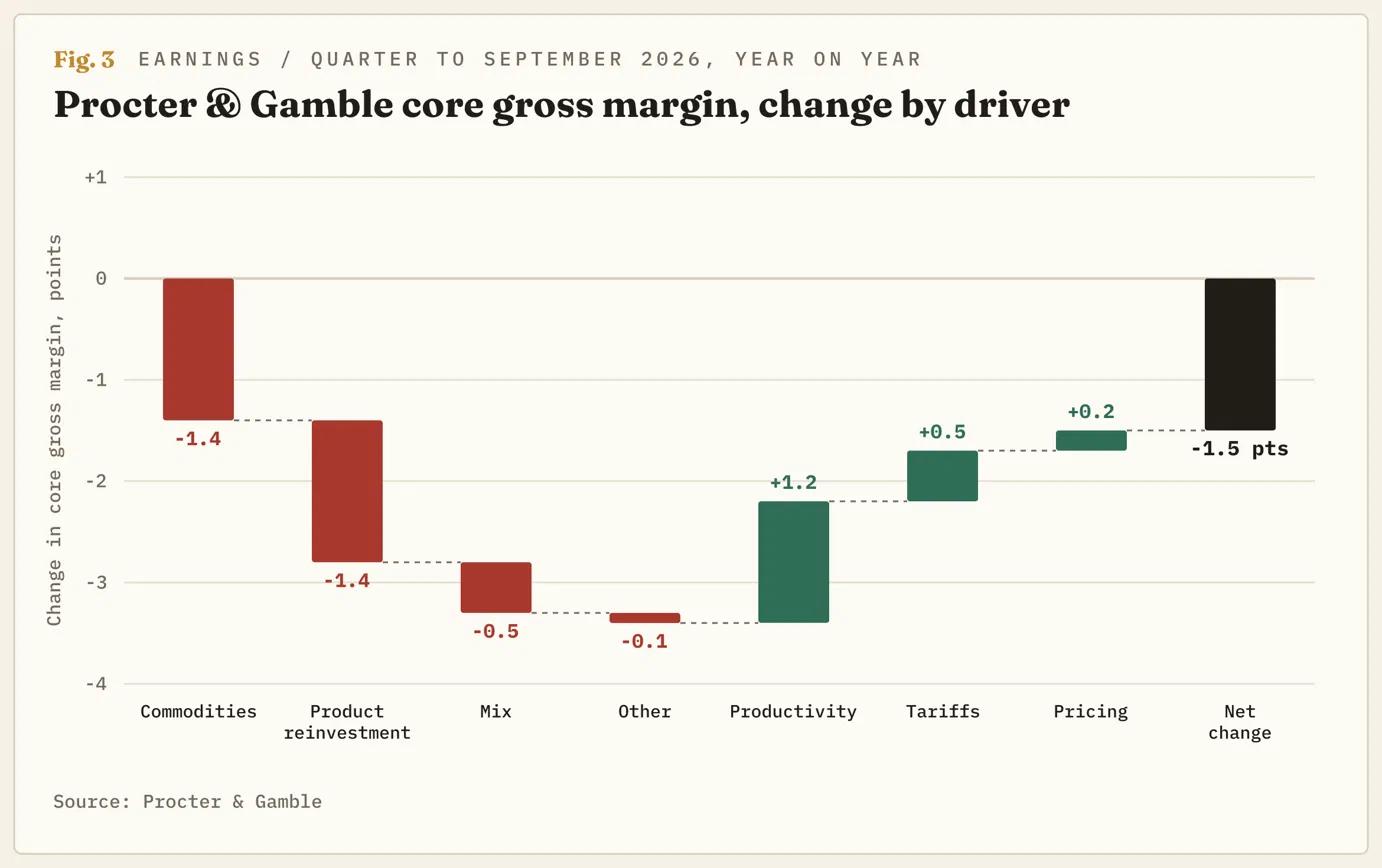
Procter & Gamble (PG), the largest household-goods maker in the index, reported on Thursday that sales in the quarter to September rose 4%. Of that, 2.4 points came from selling more and 0.4 from charging more. Its gross margin, what's left of a sale after making the product, fell 1.5 points: commodity costs took 1.4 points and pricing added back 0.2. The company now expects raw materials, energy, and freight to cost it $1.4 billion after tax this fiscal year, up from $1 billion in July, assuming Brent stays at $100. Chief Financial Officer Andre Schulten said getting it back "will take record productivity levels", that "the second component is pricing with innovation", and that "the third component here is time".
The index's Consumer Staples sector, whose margin is 6.3% down from 6.5% a year ago, is doing the same thing: selling more at the same price while costs rise. Philip Morris International (PM) raised cigarette prices 8.9%, shipped as many cigarettes as a year ago, and grew gross profit 6.7%, which is what pricing looks like when the product is nicotine. General Motors (GM) put its commodity, freight, and memory-chip costs at about $2 billion this year and lifted its North American margin by 2.5 points on the prices its trucks get. The gap is paid by whoever can't do what those two did. In the September PPI, the margin index for gasoline retailing fell 30.3% while gasoline prices rose 20.3%. It is the one line in the release where the gap is eaten in the literal sense.
Time is the third component
Procter & Gamble's commodity bill was 5% of earnings in the quarter just reported and 8% for the year. The three quarters still to come carry more of it than the first did. The pricing meant to recover it is "generally timed with modular resets", the dates on which retailers rebuild a shelf, so the rise reaches the CPI in 2027. Schulten said "there is no way to recover this level of commodity pressure without pricing" and that "the industry generally is pricing up". He made the same call, saying, "I cannot announce pricing, and I will not announce pricing in any way, shape, or form."
Analysts forecast S&P 500 earnings to grow 16% in 2027 on 9.5% revenue growth, suggesting margins are widening again. The makers of its soap, cigarettes, and trucks say the year starts with higher costs than last year. At 19 times the next twelve months' forecast earnings, the index is slightly cheaper than its five-year average, so the risk is in the forecast rather than in the price paid for it. The Fed meets on October 28, and most of its committee is on record expecting another rise by year-end. The prices that land in 2027 will hit the CPI the Fed is raising rates against, and the only date companies will give is the next shelf reset.
The map
The S&P 500 has given back about half of the leg from the September low to the October 6 record. It is trading just under its 50-day average for the second time since September. The daily Stochastic Relative Strength Index (Stoch RSI), a momentum gauge, turned down from near 70 before the week's results, so the pullback was under way before Procter & Gamble reported. The pattern since the March low is a run of higher lows above a rising 50-day average, under a 7,800 ceiling that gave way only for the record. 7,700 is the line, because the 50-day average is there.
The lean is lower below 7,700 on a closing basis. The first test is 7,500, the September low and the last higher low in the run, and a close below it is the first lower low since March. The 200-day average near 7,300 is where the 2022 path, six quarters of narrowing margins, becomes the chart's base case rather than its precedent. The case is wrong on a daily close back above 7,800. That is investors paying for energy and technology margins while ignoring the other nine sectors. Or it is Oil falling, which narrows the gap from the top and cuts the consumer companies' costs before it cuts the energy sector's profits. The October CPI is published on November 10 and the PPI on November 13, and a gap narrowing from the top is the version the index can afford.
추천 기사


