


US GDP expected to grow at 2.1% in Q2, unshaken by Iran conflict
- The US economy is seen expanding at an annualised rate of 2.1% in Q2.
- The prints could expose the impact of the US-Iran crisis on the economy.
- The US Dollar keeps its multi-day recovery well in place.
The United States (US) Bureau of Economic Analysis (BEA) is set to publish its preliminary estimate of second-quarter Gross Domestic Product (GDP) on Thursday, with analysts expecting the data to show annualised growth at a solid 2.1%, a modest cooling from the 2.1% expansion recorded in the previous quarter.
Markets brace for US growth and PCE data amid geopolitical woes
Investors are anxious ahead of Thursday's release of the US preliminary GDP figures for the April-June period, which is generally considered the most market-moving estimate of the three issued each quarter. Beyond headline growth, the domestic calendar also includes the publication of the inflation tracked by the Personal Consumption Expenditures (PCE), the Federal Reserve’s (Fed) preferred inflation gauge.
The upcoming GDP release keeps its importance intact as market participants will look for signs of any effects of the ongoing crisis in the Middle East. Regarding inflation, market participants also expect the impact of Trump’s tariffs and the increased volatility around energy prices to remain front and centre.
The release follows the Fed’s July 28-29 meeting, where the Committee delivered a widely anticipated “on hold” decision on the Fed Funds Target Range (FFTR).
Also included in the report is the GDP Price Index, commonly called the GDP deflator, which measures inflation across all domestically produced goods and services, including exports but excluding imports. These data will become more prominent amid the ongoing US-Iran conflict and its impact on Crude Oil prices.
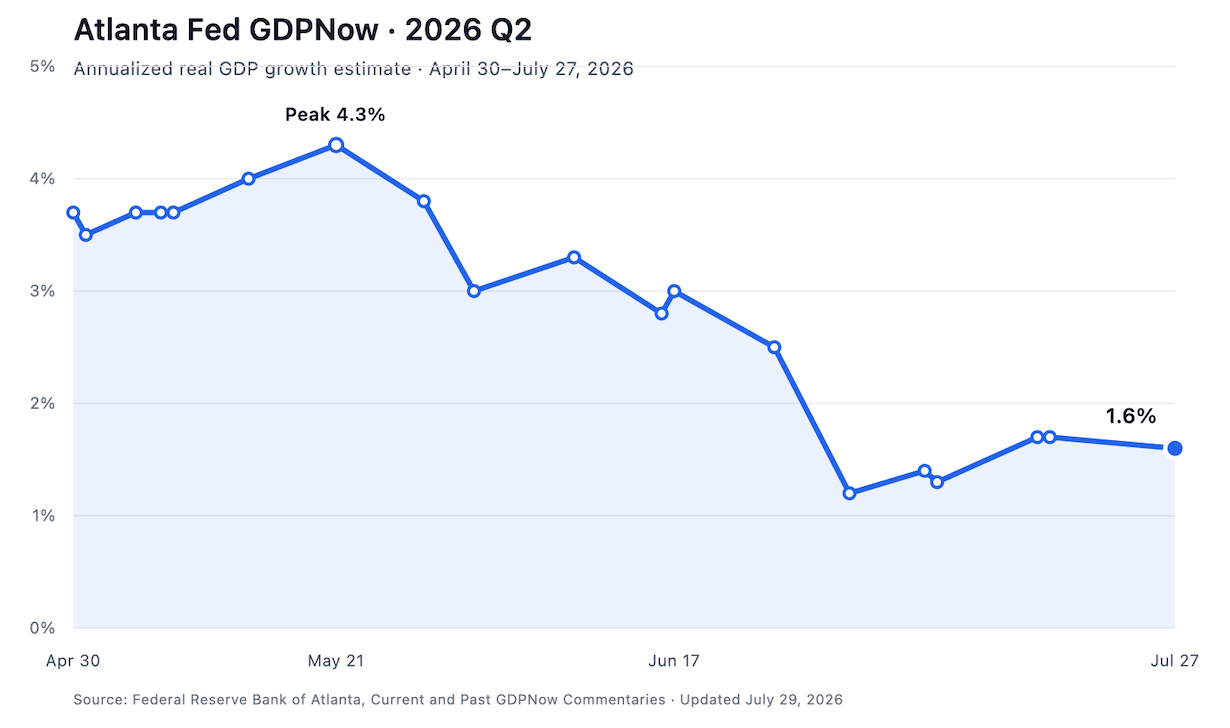
The Atlanta Fed’s GDPNow model, closely watched for its real-time tracking of economic activity, forecast a 1.6% expansion in Q2 GDP as of its July 27 update (down from 1.7% set on July 17).
When will the GDP print be released, and how can it affect the US Dollar Index?
The US GDP report, due at 13:30 GMT on Thursday, could prove pivotal for the US Dollar (USD) in case of a big surprise in either direction as markets remain almost exclusively focused on developments from the Middle East. Alongside the headline growth figure, markets will scrutinise updates to the GDP Price Index and the PCE, crucial data points that could shift expectations for the Fed rate path and the Greenback’s direction.
A stronger-than-expected GDP, or even an in-line reading, should keep the US “exceptionalism” narrative well in place, offering a tailwind for the current recovery of the buck. Inflation data, on the other hand, is expected to match the trend already seen with the release of CPI figures earlier this month.
The broader technical outlook for the US Dollar Index (DXY) remains slightly constructive amid the ongoing consolidative price action. The index is trading in the upper end of its multi-month range well north of the 101.00 barrier. It is worth noting that the positive outlook is expected to remain unchanged while above its 200-day SMA near 99.10. Further gains from here should meet the next hurdle at the YTD ceiling at 101.80 (June 24).
Downside levels emerge at the July floor at 100.35 (July 14), seconded by the provisional 55-day and 100-day SMAs at 100.24 and 99.68, respectively. South from here comes the more relevant 200-day SMA at 99.12, which precedes the weekly trough at 98.75 (May 29).
Momentum indicators lean bullish, with the Relative Strength Index (RSI) near the 63 level and the Average Directional Index (ADX) just above 25, suggesting growing strength behind the recent upward move.
US Dollar FAQs
The US Dollar (USD) is the official currency of the United States of America, and the ‘de facto’ currency of a significant number of other countries where it is found in circulation alongside local notes. It is the most heavily traded currency in the world, accounting for over 88% of all global foreign exchange turnover, or an average of $6.6 trillion in transactions per day, according to data from 2022. Following the second world war, the USD took over from the British Pound as the world’s reserve currency. For most of its history, the US Dollar was backed by Gold, until the Bretton Woods Agreement in 1971 when the Gold Standard went away.
The most important single factor impacting on the value of the US Dollar is monetary policy, which is shaped by the Federal Reserve (Fed). The Fed has two mandates: to achieve price stability (control inflation) and foster full employment. Its primary tool to achieve these two goals is by adjusting interest rates. When prices are rising too quickly and inflation is above the Fed’s 2% target, the Fed will raise rates, which helps the USD value. When inflation falls below 2% or the Unemployment Rate is too high, the Fed may lower interest rates, which weighs on the Greenback.
In extreme situations, the Federal Reserve can also print more Dollars and enact quantitative easing (QE). QE is the process by which the Fed substantially increases the flow of credit in a stuck financial system. It is a non-standard policy measure used when credit has dried up because banks will not lend to each other (out of the fear of counterparty default). It is a last resort when simply lowering interest rates is unlikely to achieve the necessary result. It was the Fed’s weapon of choice to combat the credit crunch that occurred during the Great Financial Crisis in 2008. It involves the Fed printing more Dollars and using them to buy US government bonds predominantly from financial institutions. QE usually leads to a weaker US Dollar.
Quantitative tightening (QT) is the reverse process whereby the Federal Reserve stops buying bonds from financial institutions and does not reinvest the principal from the bonds it holds maturing in new purchases. It is usually positive for the US Dollar.
GDP FAQs
A country’s Gross Domestic Product (GDP) measures the rate of growth of its economy over a given period of time, usually a quarter. The most reliable figures are those that compare GDP to the previous quarter e.g Q2 of 2023 vs Q1 of 2023, or to the same period in the previous year, e.g Q2 of 2023 vs Q2 of 2022. Annualized quarterly GDP figures extrapolate the growth rate of the quarter as if it were constant for the rest of the year. These can be misleading, however, if temporary shocks impact growth in one quarter but are unlikely to last all year – such as happened in the first quarter of 2020 at the outbreak of the covid pandemic, when growth plummeted.
A higher GDP result is generally positive for a nation’s currency as it reflects a growing economy, which is more likely to produce goods and services that can be exported, as well as attracting higher foreign investment. By the same token, when GDP falls it is usually negative for the currency. When an economy grows people tend to spend more, which leads to inflation. The country’s central bank then has to put up interest rates to combat the inflation with the side effect of attracting more capital inflows from global investors, thus helping the local currency appreciate.
When an economy grows and GDP is rising, people tend to spend more which leads to inflation. The country’s central bank then has to put up interest rates to combat the inflation. Higher interest rates are negative for Gold because they increase the opportunity-cost of holding Gold versus placing the money in a cash deposit account. Therefore, a higher GDP growth rate is usually a bearish factor for Gold price.
추천 기사


