

USD/JPY Price Forecast: Breaks above 145.00 as trade hopes lift USD
- USD/JPY clears Monday’s high, trades near 145.20 amid upbeat risk tone.
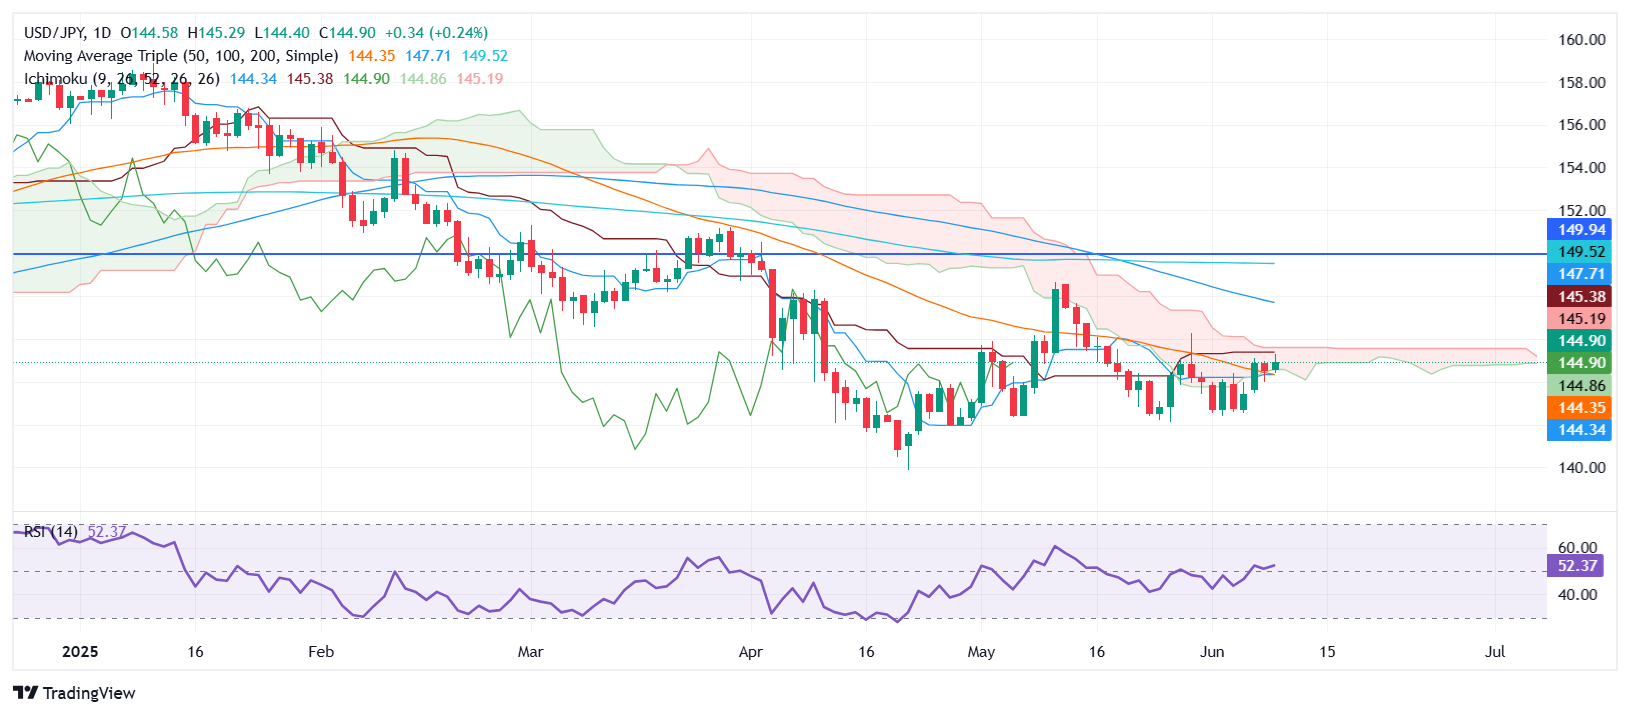
- RSI momentum favors bulls; key resistance stands at 145.38 and 146.00.
- Downside capped by 144.00 support zone and 200-day SMA at 144.26.
The USD/JPY advances for the first time in the week, clearing Monday’s high of 144.95, as the US Dollar climbs on speculation that Washington and Beijing might reach a trade agreement in London. This has pushed the major above 145.00, posting gains of over 0.24%.
USD/JPY Price Forecast: Technical outlook
Consolidation is the name of the game. The USD/JPY is trapped on the downside by the confluence of the bottom of the Ichimoku Cloud (Kumo), the 200-day Simple Moving Average (SMA) at 144.26, and the June 9 close near 144.00. Topside, the first resistance is the Senkou Span B at 145.18, followed by the Kijun-sen at 145.38.
The Relative Strength Index (RSI) is bullish. Hence, the pair may resume its uptrend in the near term, once it clears key resistance levels.
If USD/JPY buyers claim 145.38, the next target is 146.00. A decisive break will expose the 100-day SMA at 147.72. Otherwise, if the pair tumbles below 144.00, the first support would be the June 3 low at 142.37 and the May 27 swing low at 142.11.
Japanese Yen PRICE This week
The table below shows the percentage change of Japanese Yen (JPY) against listed major currencies this week. Japanese Yen was the strongest against the British Pound.
| USD | EUR | GBP | JPY | CAD | AUD | NZD | CHF | |
|---|---|---|---|---|---|---|---|---|
| USD | -0.23% | 0.21% | 0.01% | -0.14% | -0.37% | -0.51% | 0.13% | |
| EUR | 0.23% | 0.43% | 0.23% | 0.07% | -0.13% | -0.29% | 0.35% | |
| GBP | -0.21% | -0.43% | -0.10% | -0.36% | -0.54% | -0.72% | -0.08% | |
| JPY | -0.01% | -0.23% | 0.10% | -0.16% | -0.45% | -0.58% | -0.01% | |
| CAD | 0.14% | -0.07% | 0.36% | 0.16% | -0.25% | -0.36% | 0.27% | |
| AUD | 0.37% | 0.13% | 0.54% | 0.45% | 0.25% | -0.16% | 0.47% | |
| NZD | 0.51% | 0.29% | 0.72% | 0.58% | 0.36% | 0.16% | 0.63% | |
| CHF | -0.13% | -0.35% | 0.08% | 0.01% | -0.27% | -0.47% | -0.63% |
The heat map shows percentage changes of major currencies against each other. The base currency is picked from the left column, while the quote currency is picked from the top row. For example, if you pick the Japanese Yen from the left column and move along the horizontal line to the US Dollar, the percentage change displayed in the box will represent JPY (base)/USD (quote).
USD/JPY Price Chart – Daily
Japanese Yen FAQs
The Japanese Yen (JPY) is one of the world’s most traded currencies. Its value is broadly determined by the performance of the Japanese economy, but more specifically by the Bank of Japan’s policy, the differential between Japanese and US bond yields, or risk sentiment among traders, among other factors.
One of the Bank of Japan’s mandates is currency control, so its moves are key for the Yen. The BoJ has directly intervened in currency markets sometimes, generally to lower the value of the Yen, although it refrains from doing it often due to political concerns of its main trading partners. The BoJ ultra-loose monetary policy between 2013 and 2024 caused the Yen to depreciate against its main currency peers due to an increasing policy divergence between the Bank of Japan and other main central banks. More recently, the gradually unwinding of this ultra-loose policy has given some support to the Yen.
Over the last decade, the BoJ’s stance of sticking to ultra-loose monetary policy has led to a widening policy divergence with other central banks, particularly with the US Federal Reserve. This supported a widening of the differential between the 10-year US and Japanese bonds, which favored the US Dollar against the Japanese Yen. The BoJ decision in 2024 to gradually abandon the ultra-loose policy, coupled with interest-rate cuts in other major central banks, is narrowing this differential.
The Japanese Yen is often seen as a safe-haven investment. This means that in times of market stress, investors are more likely to put their money in the Japanese currency due to its supposed reliability and stability. Turbulent times are likely to strengthen the Yen’s value against other currencies seen as more risky to invest in.
추천 기사


