
Ripple Price Forecast: XRP under pressure as network activity dwindles
- XRP price struggles to hold $2.10 support amid declining network activity.
- User engagement has yet to recover from a sharp decline from the first quarter peak of approximately 612,000 daily active addresses.
- Ripple whales are increasing their holdings, hinting at an improving sentiment and a potential breakout.
- XRP trades under key EMAs as the RSI indicator nears oversold in the 4-hour chart, signaling strong bearish momentum.
Ripple (XRP) price is yet to make headway in its broader recovery potential, targeting $3.00 in the medium term. The cross-border money remittance token hovers at $2.17 at the time of writing on Monday, up slightly on the day. XRP's sluggish lock-step price action may be attributed to waning network activity despite whales' growing risk-on sentiment.
XRP price falters amid declining network activity
The XRP Ledger is experiencing a major slowdown in network activity compared to levels seen in the first quarter. On-chain data from Santiment reveals that daily active addresses on the protocol stand at a fraction of peak levels recorded in March.
At the height of the first quarter, the XRP Ledger posted a robust 612,000 daily active addresses, indicating strong user engagement and transaction activity. However, the chart below shows a dramatic slump through April and early May.
With only about 40,000 daily active addresses, fewer users transact on the XRP Ledger, which could point to waning interest or a lack of confidence in the asset's short-term prospects.
 [07-1746427402215.26.29, 05 May, 2025].png)
XRP Daily Active Addresses | Source: Santiment
Historically, such drops in activity often precede periods of price stagnation or decline, as reduced transaction volume erodes liquidity and buying pressure. This makes the Daily Active Addresses metric an important indicator for traders as it could help ascertain the potential of the XRP price.
Despite the slump in daily active addresses, whale cohorts in the ecosystem are unrelenting in the quest to increase exposure to XRP. Large volume holders have consistently purchased XRP since early April, hinting at an improving risk-on sentiment. For instance, addresses with 10 million to 100 million coins currently account for 12.32% of XRP's total supply, representing a significant jump from 10.91% on April 1.
The green line on the chart below shows whales with between 100 million and 1 billion tokens currently hold 14.37% of XRP's total supply, up from 14.32% recorded on April 1.
 [07-1746427425749.26.33, 05 May, 2025].png)
XRP supply distribution | Source: Santiment
The accumulation by large holders (1 million to 1 billion XRP) is generally a bullish indicator because whales often accumulate during periods of consolidation or before anticipated price increases. This suggests that large investor cohorts could anticipate positive developments such as a settlement between Ripple and the Securities and Exchange Commission (SEC) and a potential approval of spot XRP Exchange Traded Funds (ETFs).
XRP bulls attempt trend reversal
XRP's price holds above short-term support at $2.10, as bulls launch a new recovery attempt, targeting a rally to $3.00. However, XRP's position below the 50-, 100-, and 200 Exponential Moving Averages (EMA) could complicate matters for the bulls, challenging the anticipated breakout.
The Relative Strength Index (RSI) indicator, sitting below the midline at 43.30, signals increasing selling pressure. Yet, its upward trajectory suggests a potential rise above the midline, which could strengthen bullish momentum soon.
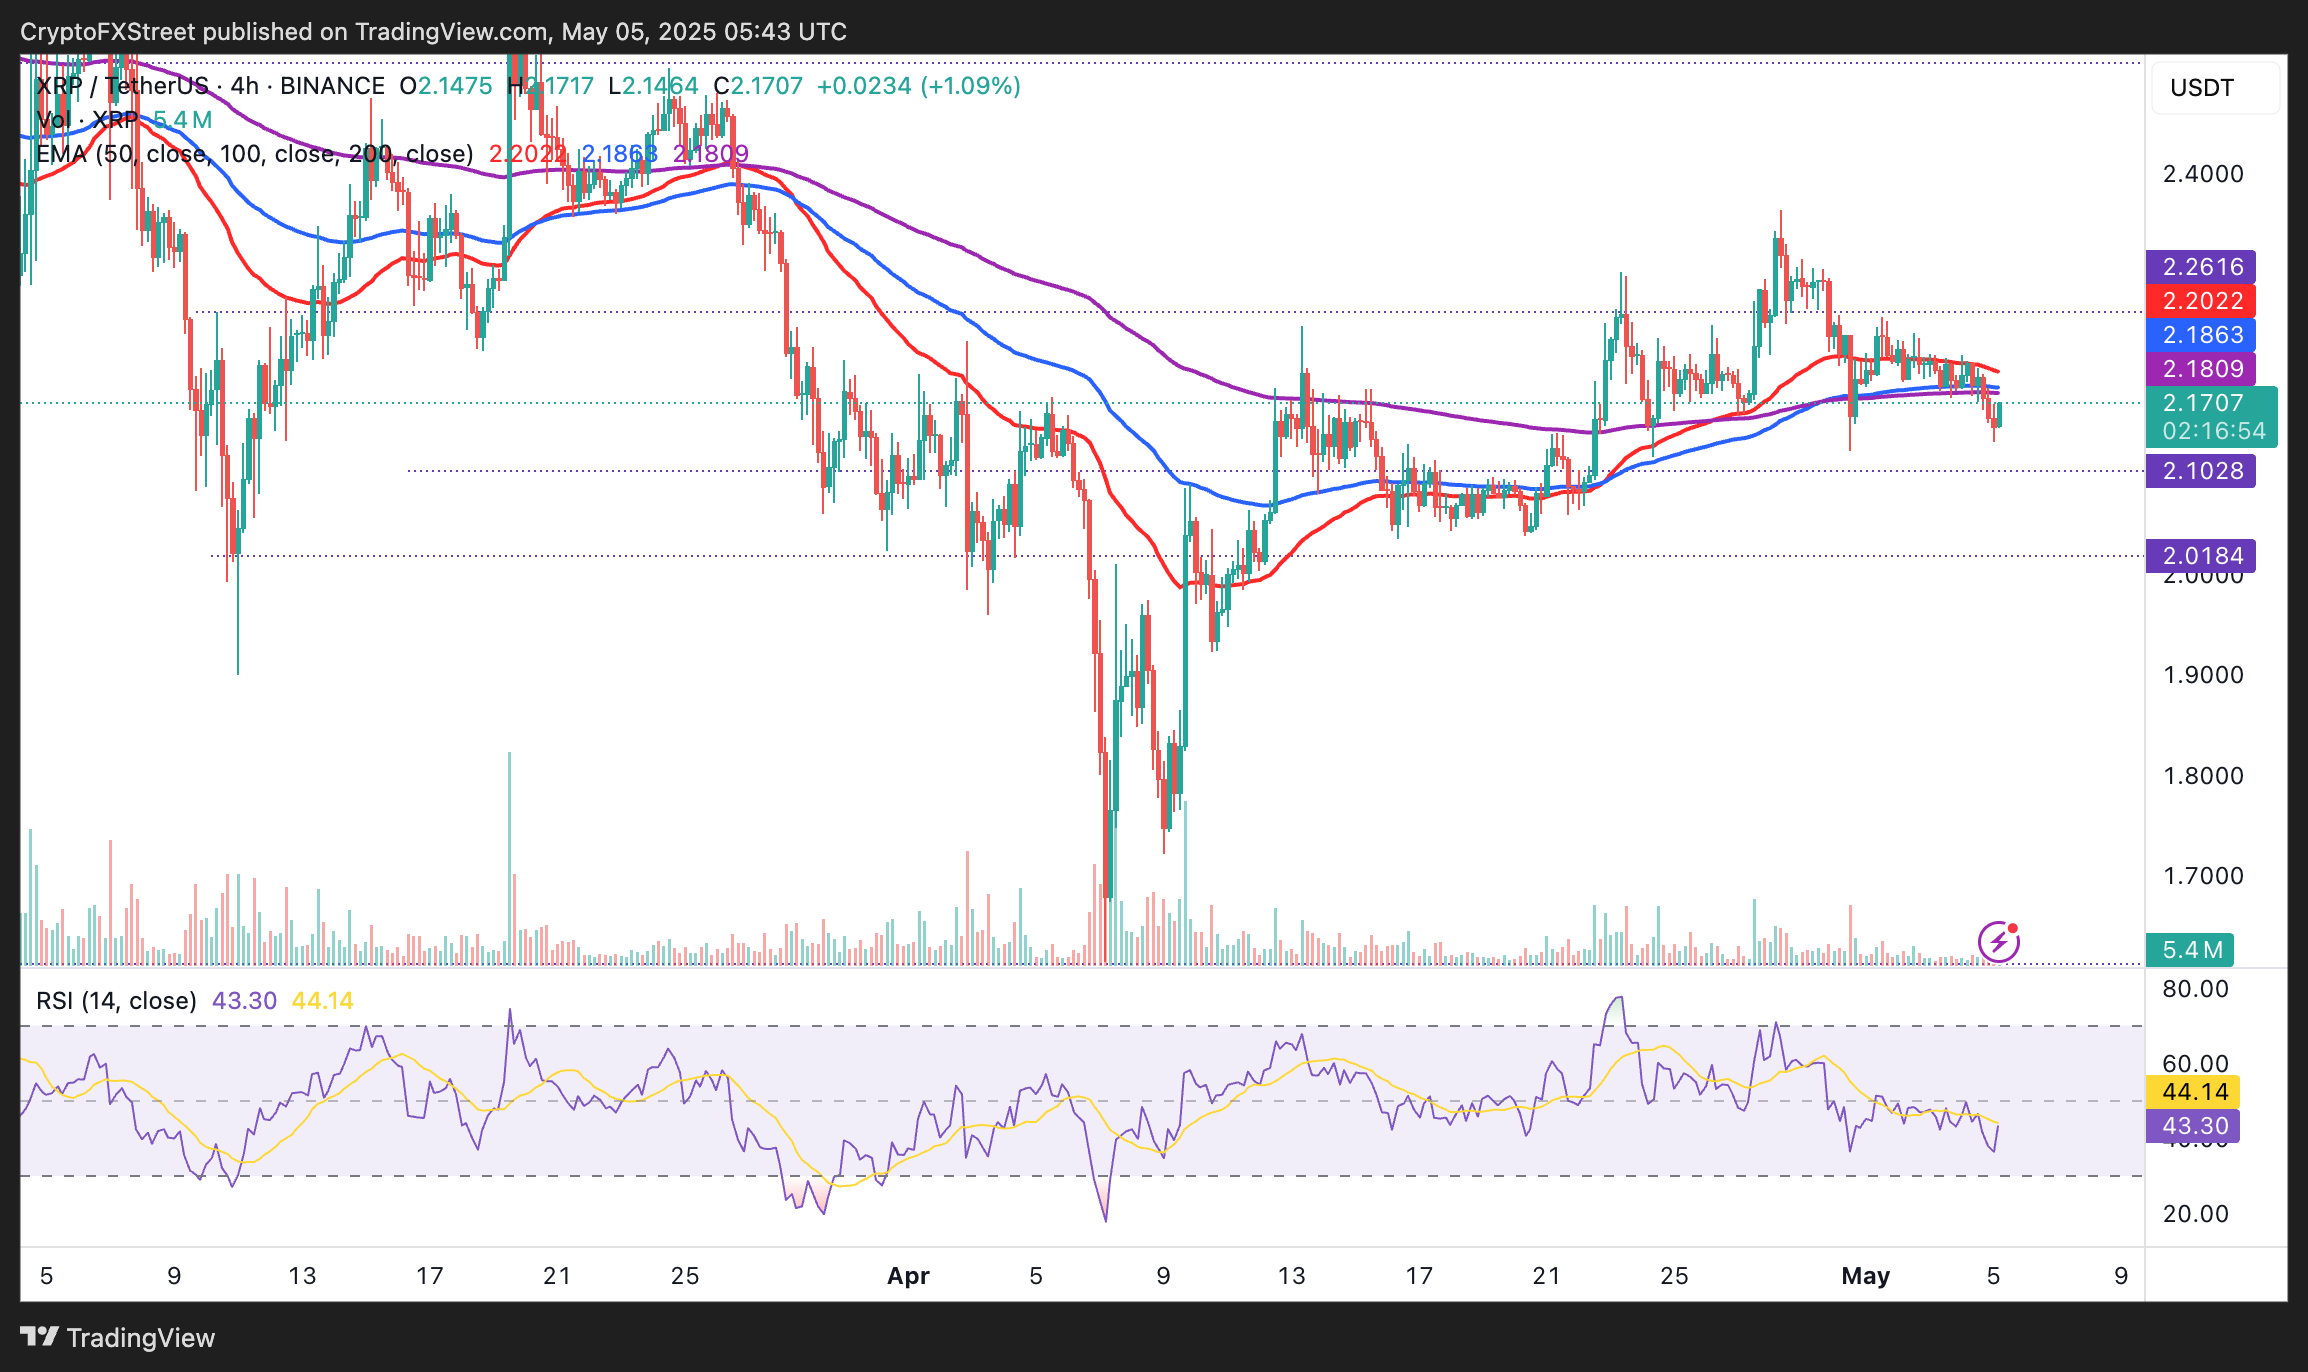
XRP/USDT 4-hour chart
Looking ahead, if XRP flips the 50-, 100-, and 200 EMAs into support, the technical structure would strengthen, favoring a bullish outcome. Beyond the moving averages, converging around $2.18-$2.20, resistance at the April's high of $2.36 must be broken to encourage more traders to buy XRP, anticipating an uptrend toward $3.00.
Meanwhile, decreasing network activity might hinder XRP's bullish momentum, limiting its ability to climb higher due to weak demand. Key support levels to watch include the nearby demand zone at $2.11, the critical $2.00 mark, and the April 7 low of $1.61.
Cryptocurrency metrics FAQs
The developer or creator of each cryptocurrency decides on the total number of tokens that can be minted or issued. Only a certain number of these assets can be minted by mining, staking or other mechanisms. This is defined by the algorithm of the underlying blockchain technology. On the other hand, circulating supply can also be decreased via actions such as burning tokens, or mistakenly sending assets to addresses of other incompatible blockchains.
Market capitalization is the result of multiplying the circulating supply of a certain asset by the asset’s current market value.
Trading volume refers to the total number of tokens for a specific asset that has been transacted or exchanged between buyers and sellers within set trading hours, for example, 24 hours. It is used to gauge market sentiment, this metric combines all volumes on centralized exchanges and decentralized exchanges. Increasing trading volume often denotes the demand for a certain asset as more people are buying and selling the cryptocurrency.
Funding rates are a concept designed to encourage traders to take positions and ensure perpetual contract prices match spot markets. It defines a mechanism by exchanges to ensure that future prices and index prices periodic payments regularly converge. When the funding rate is positive, the price of the perpetual contract is higher than the mark price. This means traders who are bullish and have opened long positions pay traders who are in short positions. On the other hand, a negative funding rate means perpetual prices are below the mark price, and hence traders with short positions pay traders who have opened long positions.
추천 기사


