


Bitcoin vs Gold Forecast: BTC slips under $82K, XAU eyes $4,200 amid easing rate-hike bets
- Bitcoin corrects below $82,000 despite the 30-day Consensus Index flipping bullish.
- Gold gradually ticks up toward $4,200 as the MACD reinforces potential buy-the-dip opportunities.
- Market participants are pricing in higher odds that the Fed will hold interest rates in the 3.75-4.00% range.
Bitcoin (BTC) ticks down below $82,000 on Friday amid a tug-of-war between bulls and bears over the trend. While bulls appear to have the upper hand, backed by strong structural support, key supply levels at $84,000 and around $87,000 suggest the recovery could be an uphill battle.
Gold (XAU/USD), on the other hand, is correcting upward within a broader bearish scope. The metal hovers near $4,180 while building traction for a move above $4,200.
Fed rate hike bets ease
Inflation in the United States (US) remains elevated after accelerating in September. The Consumer Price Index (CPI) report on Wednesday showed headline inflation in the world’s largest economy rose to 3.7% in September, above forecasts of 3.6% and August’s 3.4%.
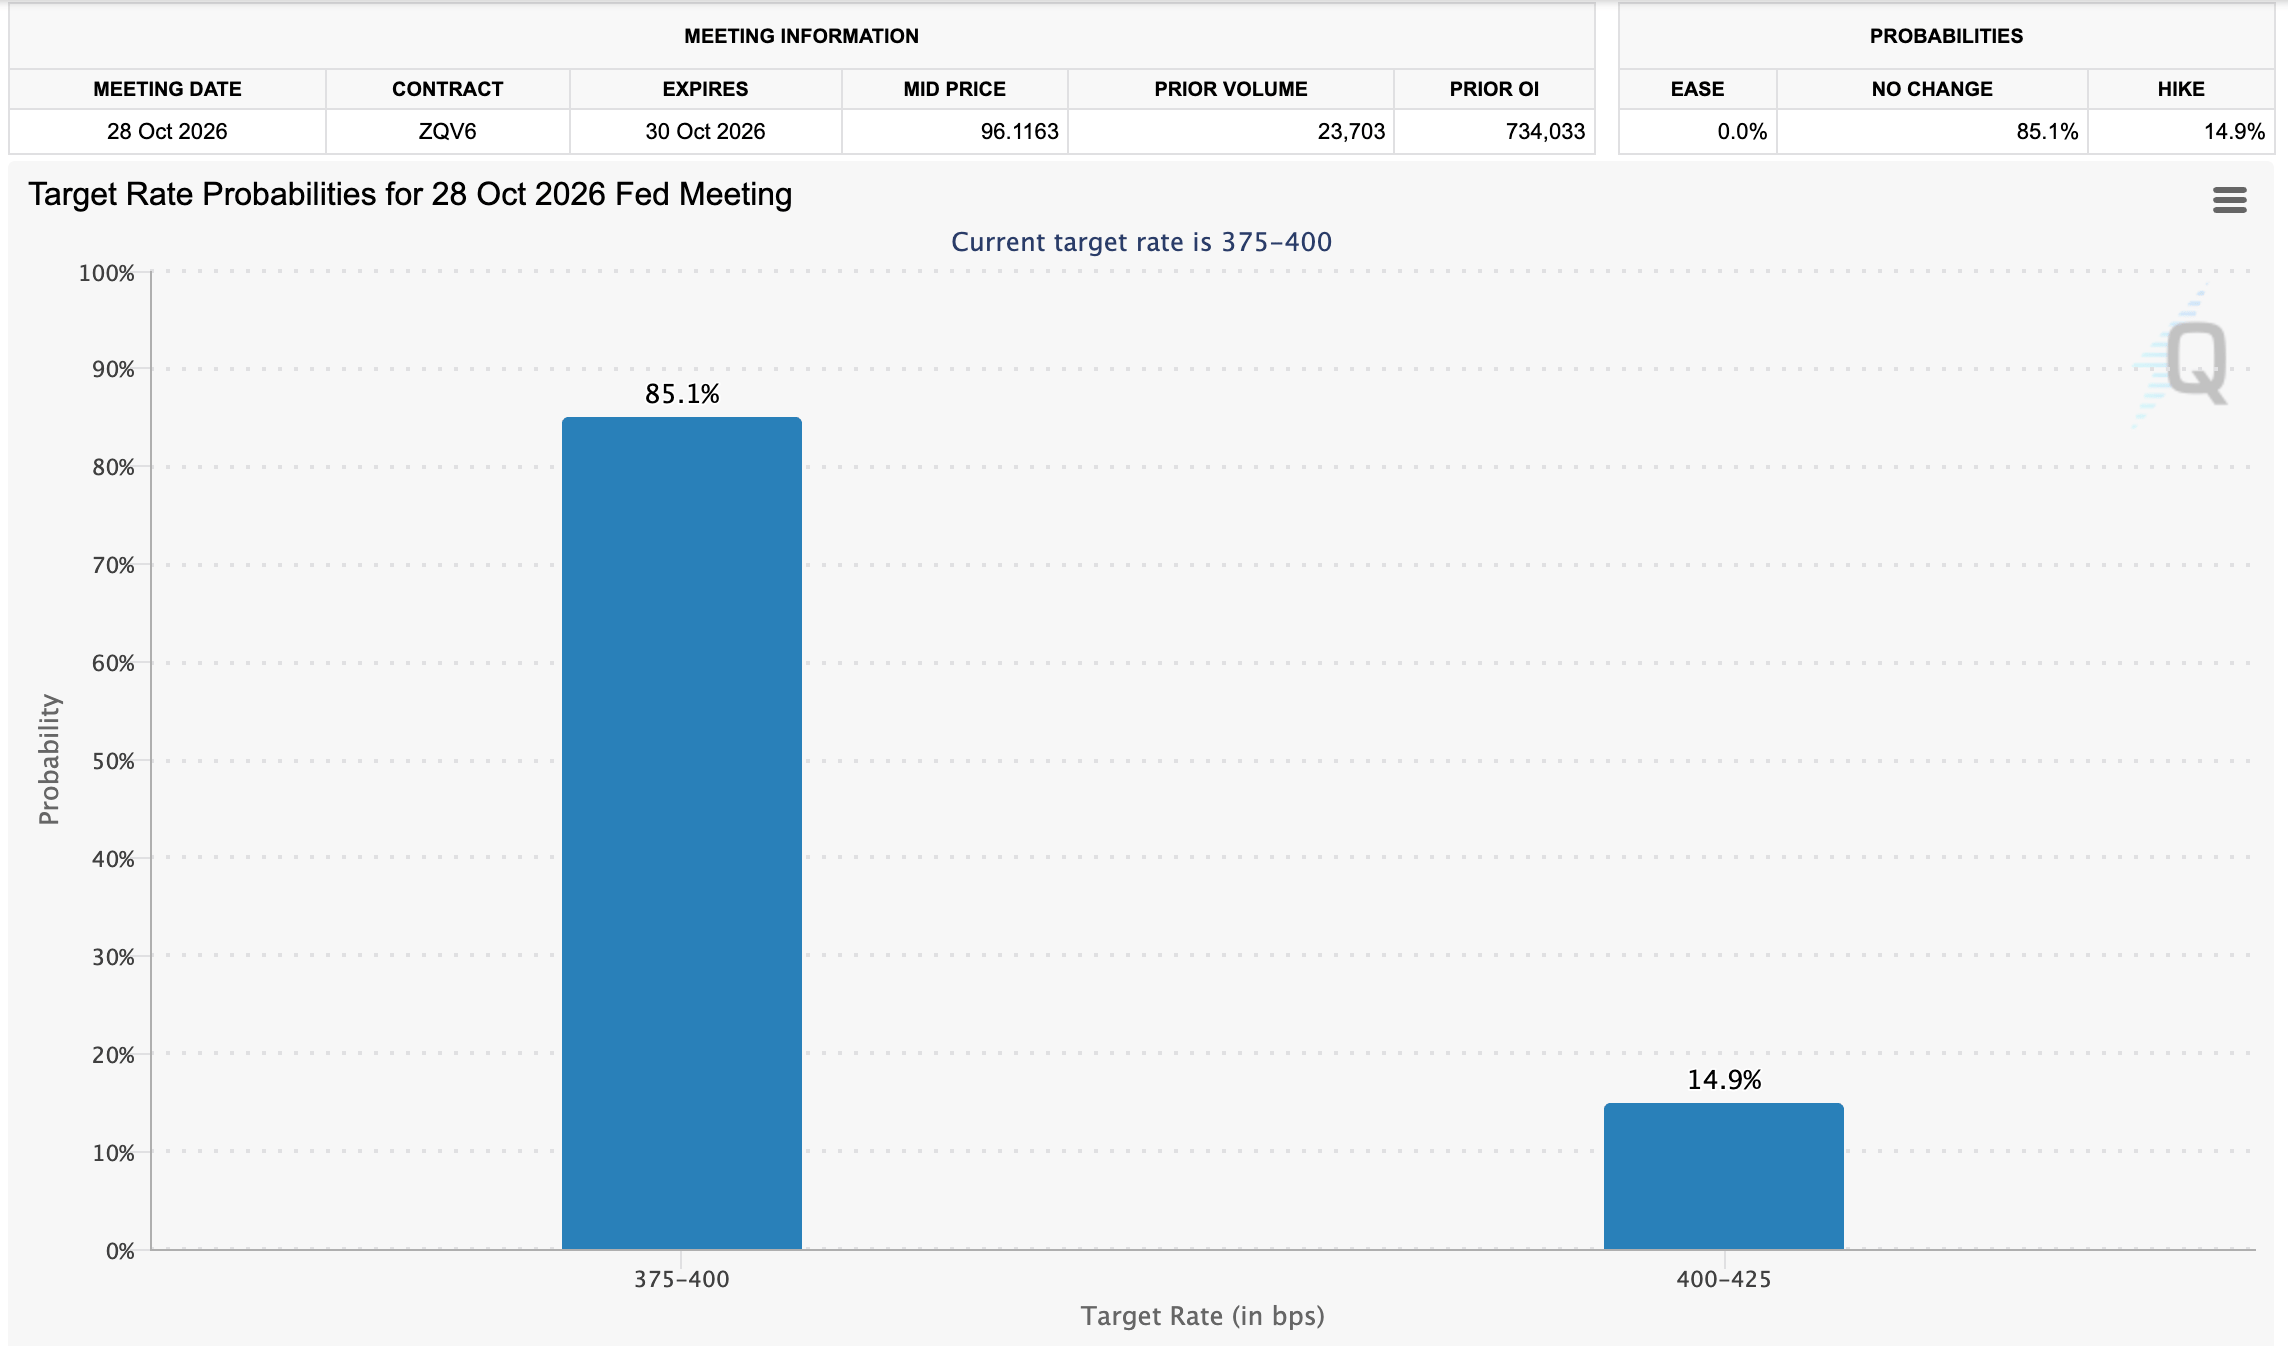
With inflation notably above the Federal Reserve’s (Fed) 2% target, market participants generally expect persistent tight monetary policy. Meanwhile, CME Group’s FedWatch tool shows an 85% probability that the Fed will hold rates in the 3.75-4.00% range later this month. Still, sticky inflation driven by higher Oil and energy prices has economists projecting a rate hike in December. The Fed raised interest rates in September for the first time in three years, underscoring the need to bring inflation down.
Bitcoin Consensus Index upholds bullish outlook
Bitcoin’s 30-day Consensus Index bottomed at -18.3 on July 2, subsequently crossing above zero on July 27. The index currently reads +49.2, with 84% of 164 voting analysts leaning bullish, according to Crypto Quant.
“In the last cycle Bitcoin's 30-day index never fell below −1.3 (two weeks after the $15,800 cycle low of November 21) and reached +34.2 103 days later, on March 20, 2023, with 80% of 113 analysts bullish,” Crypto Quant weekly report states.
Technical analysis: Bitcoin bullish outlook under test
Bitcoin edges lower below $82,000 as bears push for a full-fledged correction below the key $80,000 demand area. Still, the broader technical picture shows BTC holding a constructive near-term bullish bias as price remains above the SuperTrend line at $79,664 and all key Exponential Moving Averages (EMAs).
The Moving Average Convergence Divergence (MACD) indicator is negative and below its zero line, while the Relative Strength Index (RSI) at 48 sits near neutral territory, hinting that upside momentum is not aggressive despite the supportive structure.
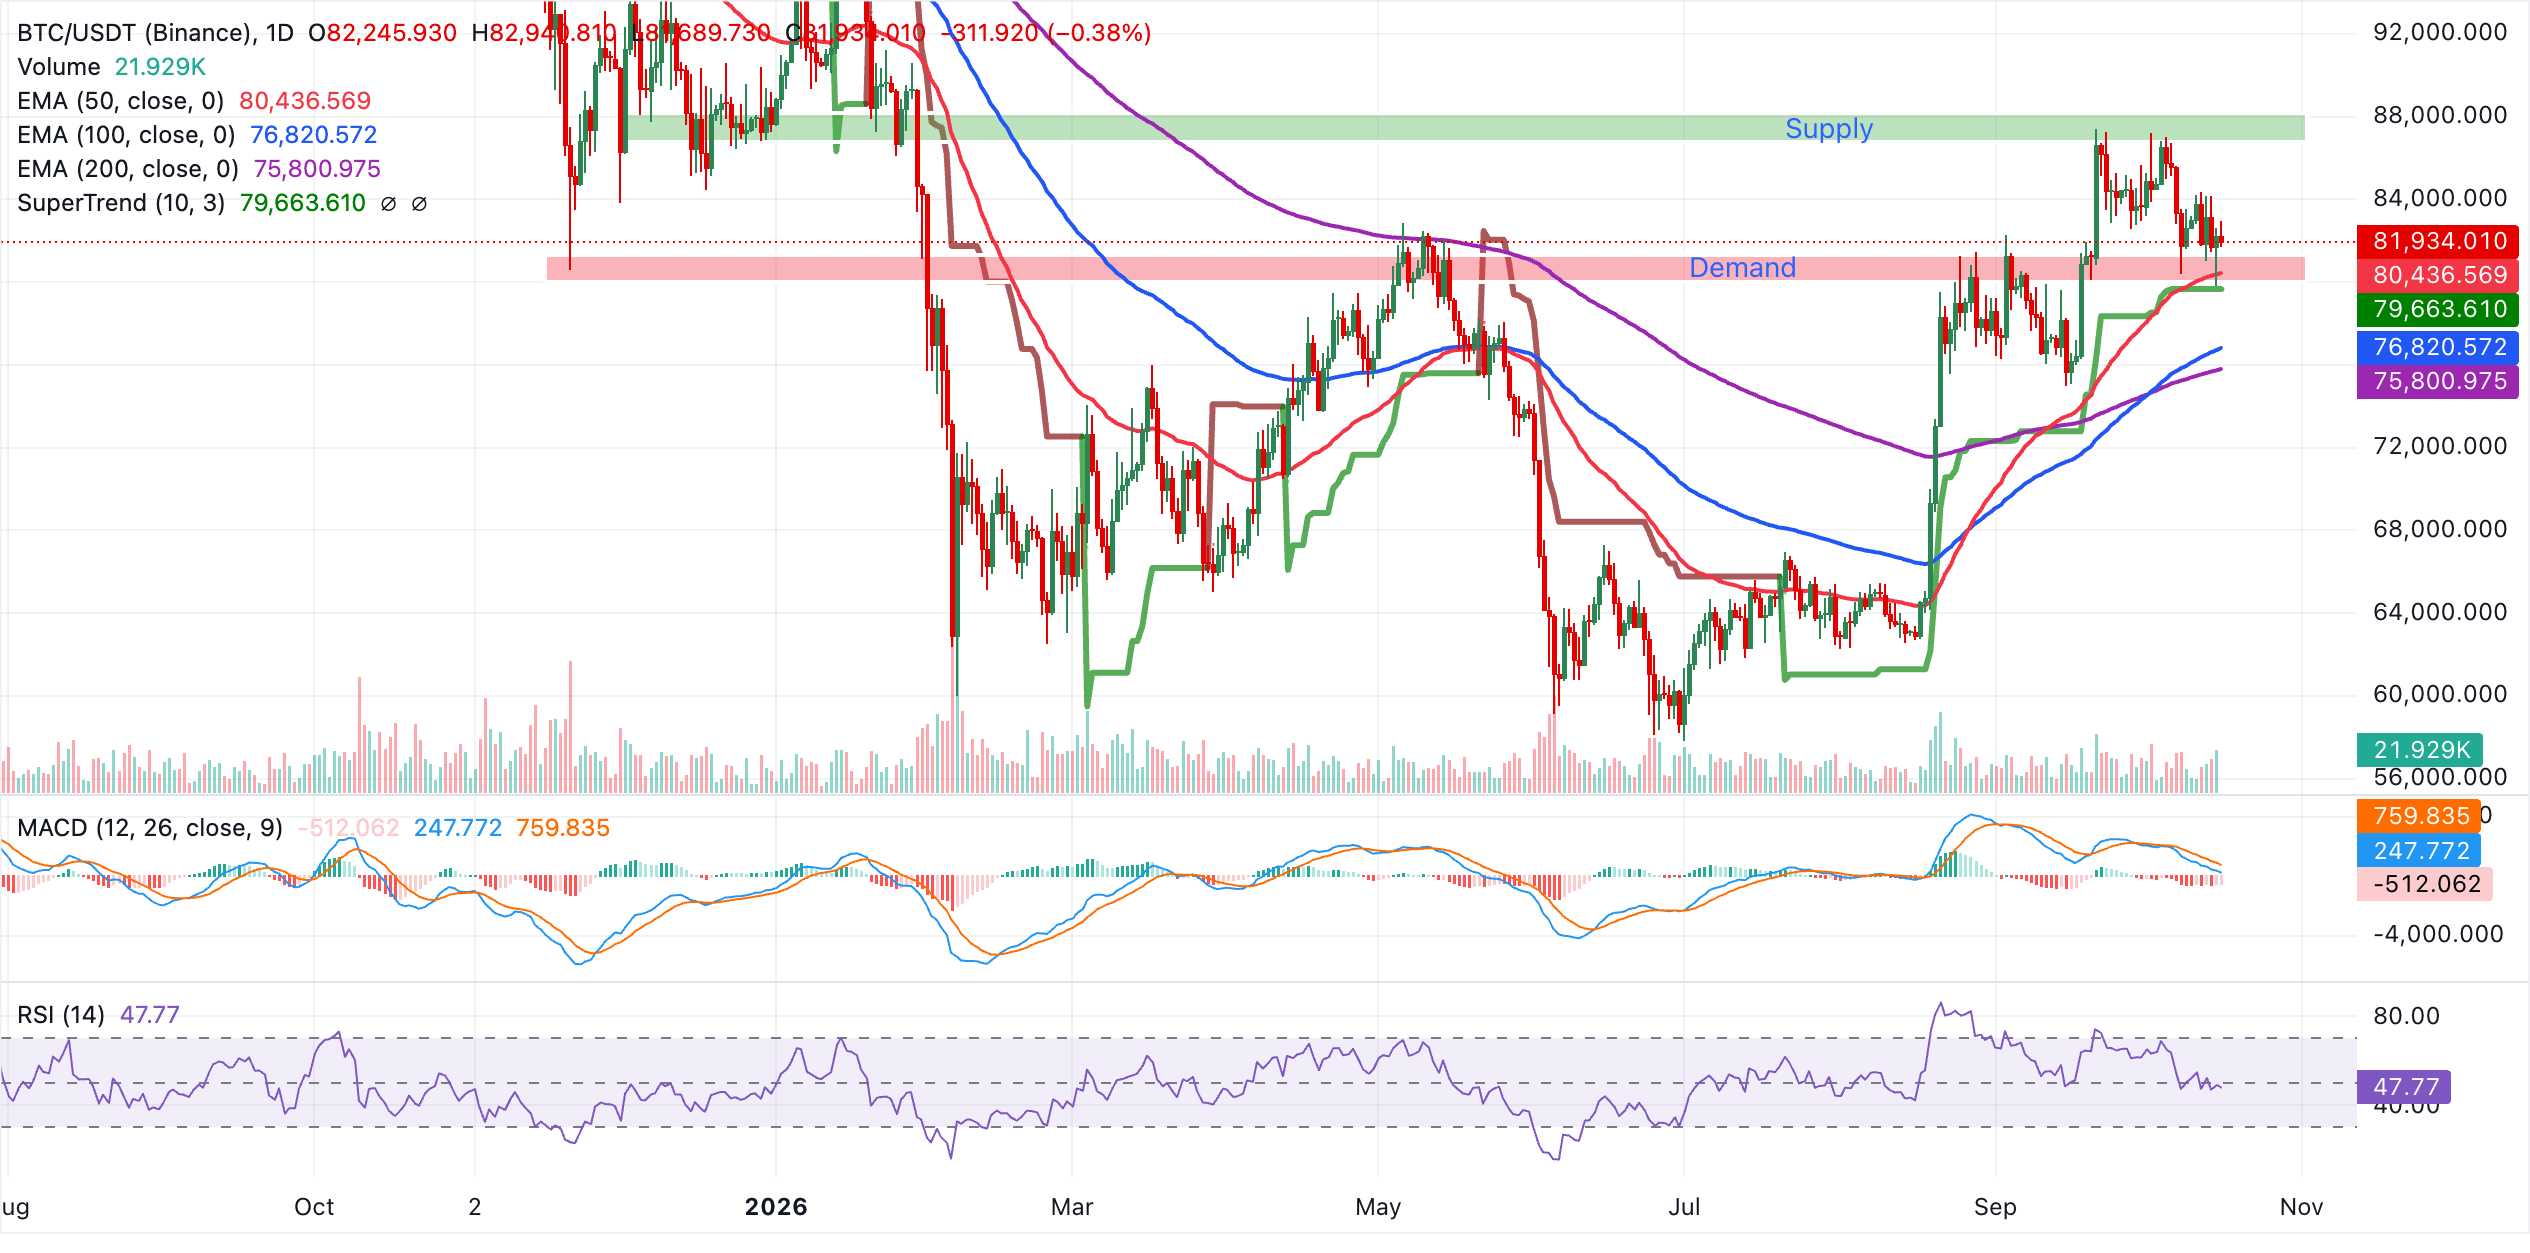
Initial support aligns at the 50-day EMA near $80,436, ahead of the SuperTrend baseline at $79,663, where buyers could attempt to defend the short-term trend. Deeper pullbacks would expose the 100-day EMA at $76,821, and then the 200-day EMA at $75,801 as successive medium-term support layers, and a daily close below these levels would likely weaken the prevailing bullish bias.
Gold technical analysis: XAU bulls attempt recovery
Gold is gaining ground toward $4,200, albeit gradually, as bulls stage a comeback following a sustained bearish trend that recently tested lows below $4,100. Continued dip buying could accelerate the metal's recovery, with gains above $4,200 likely to make the pair more attractive.
Still, XAU/USD remains below key moving averages and the SuperTrend, keeping the near-term bias bearish despite improved momentum. The MACD is now positive, hinting at waning downside pressure, while the RSI at 46 stays below the midline, suggesting that sellers still retain a slight edge as Gold consolidates after its recent recovery attempt.
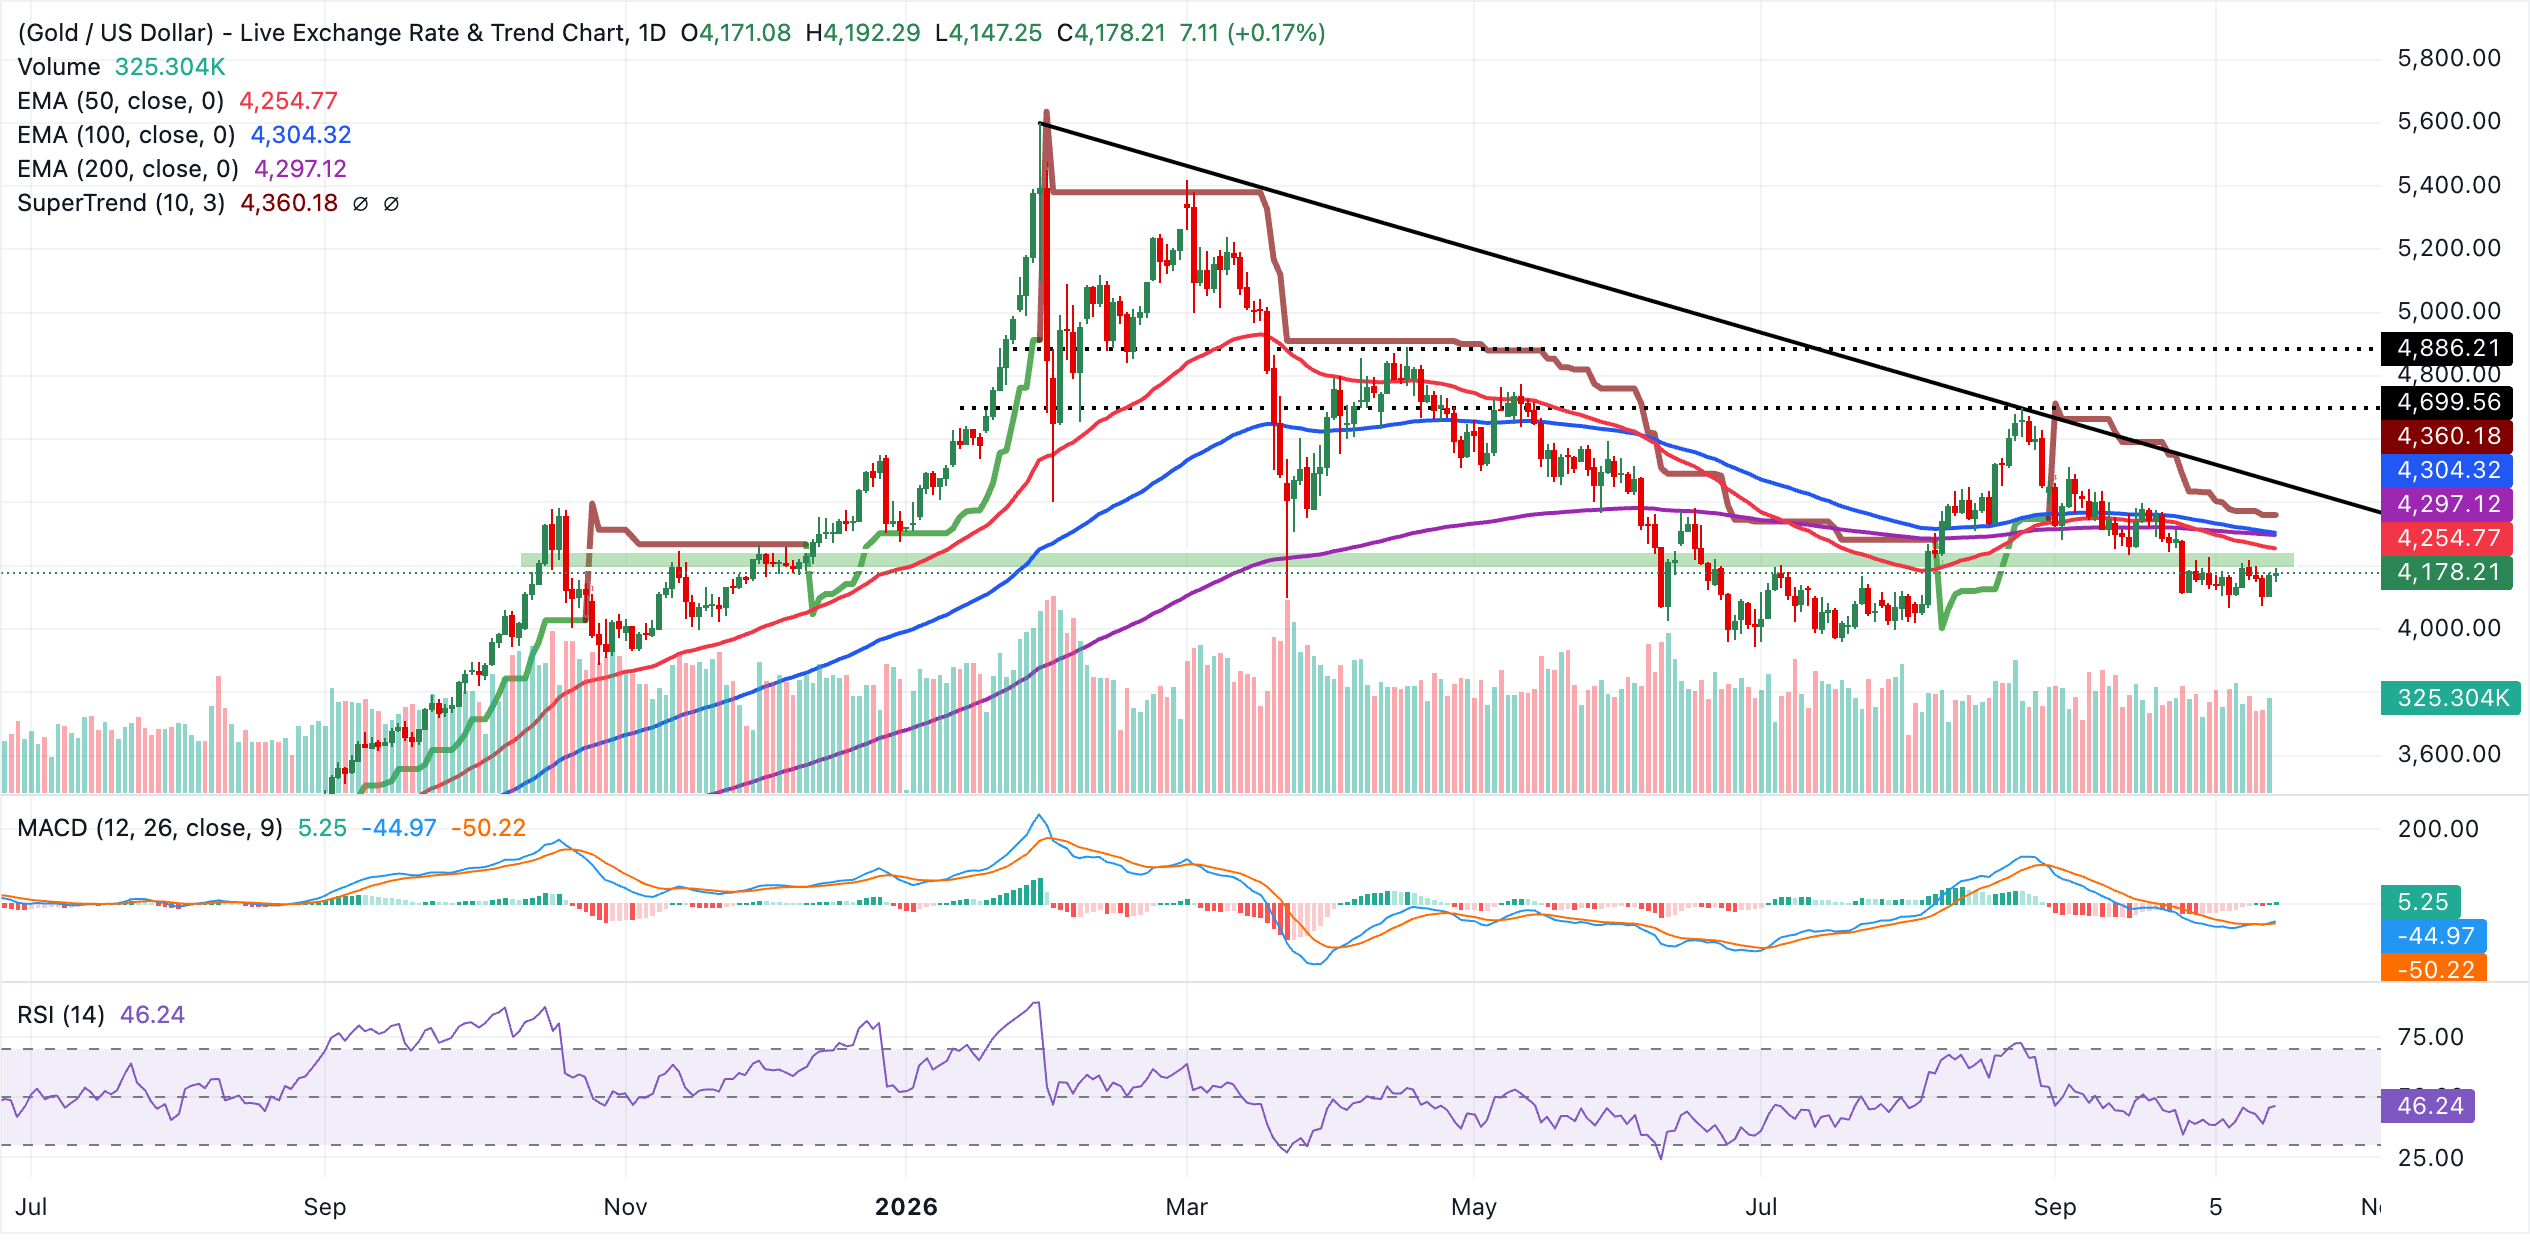
Initial resistance aligns with the 50-day EMA at $4,255, followed by the 200-day EMA at $4,297 and the 100-day EMA at $4,304, forming a dense cap overhead that reinforces the broader corrective tone. Above these, the SuperTrend barrier at $4,360 and the descending trend-line resistance around $4,416 represent the next hurdles; only a sustained break over this cluster would start to ease the prevailing downside bias and open the way for a more constructive medium-term outlook.
(The technical analysis of this story was written with the help of an AI tool. Know more.)
Bitcoin, altcoins, stablecoins FAQs
Bitcoin is the largest cryptocurrency by market capitalization, a virtual currency designed to serve as money. This form of payment cannot be controlled by any one person, group, or entity, which eliminates the need for third-party participation during financial transactions.
Altcoins are any cryptocurrency apart from Bitcoin, but some also regard Ethereum as a non-altcoin because it is from these two cryptocurrencies that forking happens. If this is true, then Litecoin is the first altcoin, forked from the Bitcoin protocol and, therefore, an “improved” version of it.
Stablecoins are cryptocurrencies designed to have a stable price, with their value backed by a reserve of the asset it represents. To achieve this, the value of any one stablecoin is pegged to a commodity or financial instrument, such as the US Dollar (USD), with its supply regulated by an algorithm or demand. The main goal of stablecoins is to provide an on/off-ramp for investors willing to trade and invest in cryptocurrencies. Stablecoins also allow investors to store value since cryptocurrencies, in general, are subject to volatility.
Bitcoin dominance is the ratio of Bitcoin's market capitalization to the total market capitalization of all cryptocurrencies combined. It provides a clear picture of Bitcoin’s interest among investors. A high BTC dominance typically happens before and during a bull run, in which investors resort to investing in relatively stable and high market capitalization cryptocurrency like Bitcoin. A drop in BTC dominance usually means that investors are moving their capital and/or profits to altcoins in a quest for higher returns, which usually triggers an explosion of altcoin rallies.
추천 기사


