


EUR/USD Price Forecast: Recovery remains fragile below key moving averages
- EUR/USD struggles to extend gains as hawkish Fed expectations support the US Dollar.
- The pair trades below key daily moving averages, suggesting sellers retain control.
- Momentum indicators show early signs of recovery, but a strong bullish reversal appears uncertain.
EUR/USD struggles to extend its gains on Friday as the US Dollar (USD) steadies after coming under heavy pressure on Thursday. At the time of writing, the pair trades around 1.1230, below an intraday high of 1.1269, but remains on track for its first weekly gain in six weeks.
Euro Price This week
The table below shows the percentage change of Euro (EUR) against listed major currencies this week. Euro was the strongest against the Australian Dollar.
| USD | EUR | GBP | JPY | CAD | AUD | NZD | CHF | |
|---|---|---|---|---|---|---|---|---|
| USD | -0.32% | -0.65% | -0.05% | -0.82% | 0.49% | -0.63% | -0.67% | |
| EUR | 0.32% | -0.25% | 0.27% | -0.46% | 0.81% | -0.27% | -0.30% | |
| GBP | 0.65% | 0.25% | 0.46% | -0.21% | 1.06% | -0.02% | -0.07% | |
| JPY | 0.05% | -0.27% | -0.46% | -0.63% | 0.65% | -0.56% | -0.50% | |
| CAD | 0.82% | 0.46% | 0.21% | 0.63% | 1.31% | 0.09% | 0.16% | |
| AUD | -0.49% | -0.81% | -1.06% | -0.65% | -1.31% | -1.07% | -1.09% | |
| NZD | 0.63% | 0.27% | 0.02% | 0.56% | -0.09% | 1.07% | -0.06% | |
| CHF | 0.67% | 0.30% | 0.07% | 0.50% | -0.16% | 1.09% | 0.06% |
The heat map shows percentage changes of major currencies against each other. The base currency is picked from the left column, while the quote currency is picked from the top row. For example, if you pick the Euro from the left column and move along the horizontal line to the US Dollar, the percentage change displayed in the box will represent EUR (base)/USD (quote).
Hawkish Federal Reserve (Fed) expectations keep a floor under the US Dollar after this week’s US inflation data reinforced expectations of another rate hike before year-end. The US Dollar Index (DXY), which tracks the Greenback’s value against a basket of six major currencies, trades around 101.90 after touching an intraday low of 101.58, its lowest level since October 1.
Meanwhile, expectations of further European Central Bank (ECB) rate hikes offer limited support to the Euro (EUR), as traders weigh risks to growth alongside France’s fiscal and political concerns.
Nordea turns more constructive on USD as EUR/USD overshoots 2027 target
Strategists at Nordea highlight that "EUR/USD reached our H1 2027 target of 1.12 faster than expected." In response to the quicker-than-anticipated move, they state that "we therefore lower our year-end EUR/USD forecast to 1.10 from 1.14" and now "expect EUR/USD to test 1.08 in H1 2027 before recovering to 1.14 in H2 2027 and 1.20 by end-2028." Nordea underlines that "our baseline remains a strong US economy and two further Fed hikes, with risks skewed to the upside," and concludes that "overall, we remain constructive on the USD relative to the EUR over the next six to nine months."
Technical analysis
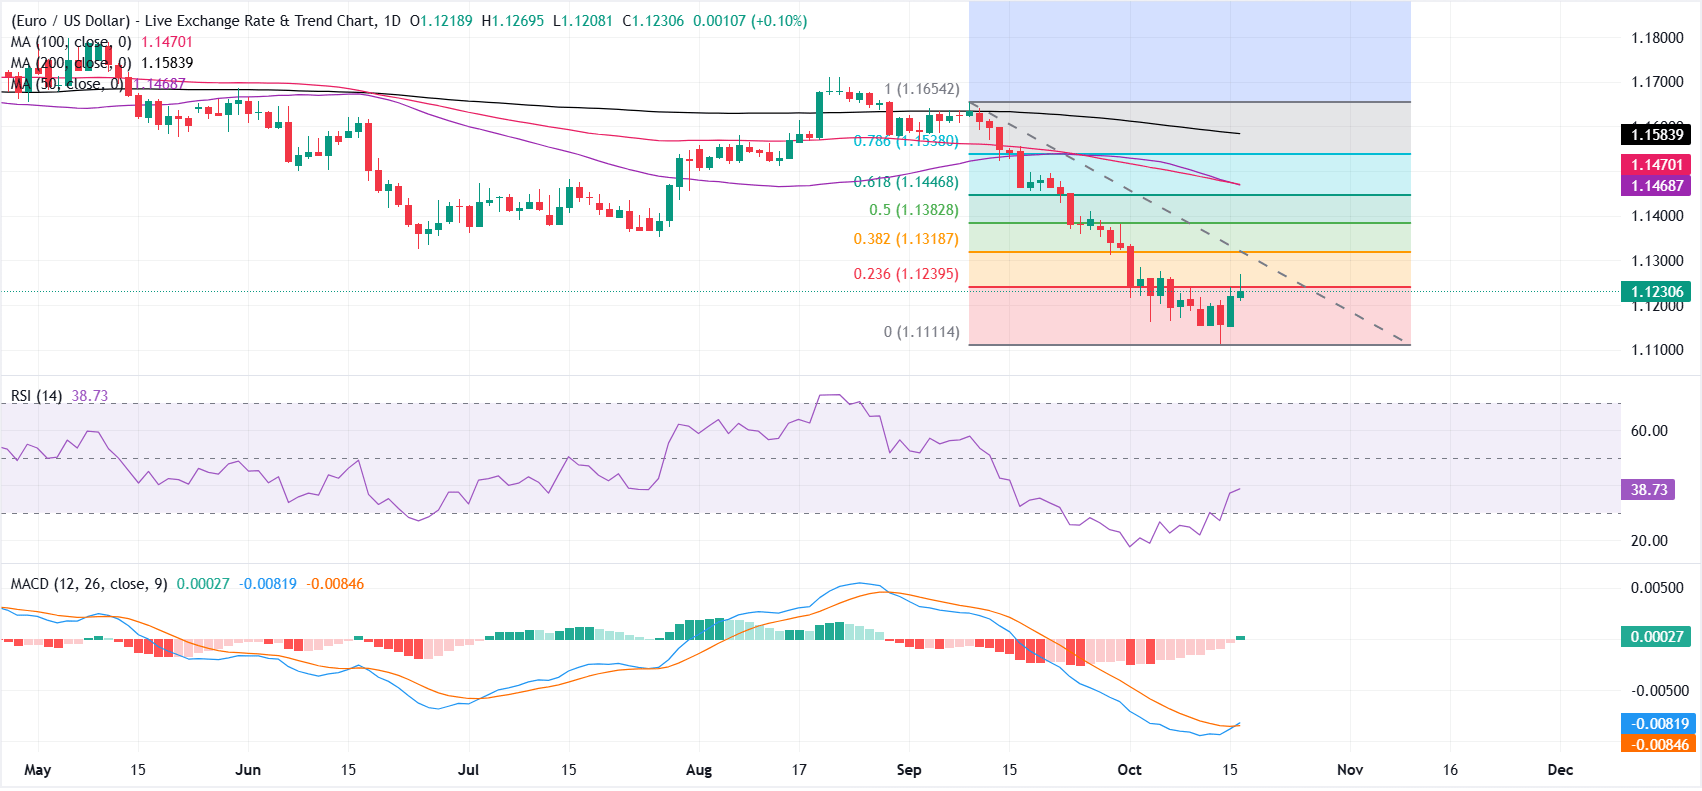
On the daily chart, EUR/USD keeps a bearish near-term bias as the pair holds well beneath the 50-day and 100-day simple moving averages (SMAs) at 1.1469 and 1.1470, and the 200-day SMA at 1.1584. Price is also below a dense Fibonacci retracement cluster, with the 23.6% level at 1.1239 leaning as immediate overhead resistance. The Relative Strength Index (RSI) at 38 suggests the pair is recovering from oversold conditions, while the Moving Average Convergence Divergence (MACD) has just turned marginally positive, hinting at waning downside momentum rather than a clear bullish shift.
On the topside, initial resistance appears at the 23.6% Fibonacci retracement at 1.1239, followed by the 38.2% level at 1.1319 and the 50% retracement at 1.1383. Higher up, the 61.8% retracement at 1.1447 is reinforced by the 50-day and 100-day SMAs clustered around 1.1470, while the 78.6% level at 1.1538 and the 200-day SMA at 1.1584 guard the path toward the cycle high at 1.1654. On the downside, the main support remains the structural Fibonacci anchor near 1.1111, where a sustained break would likely extend the broader bearish phase.
(The technical analysis of this story was written with the help of an AI tool. Know more.)
Euro FAQs
The Euro is the currency for the 20 European Union countries that belong to the Eurozone. It is the second most heavily traded currency in the world behind the US Dollar. In 2022, it accounted for 31% of all foreign exchange transactions, with an average daily turnover of over $2.2 trillion a day. EUR/USD is the most heavily traded currency pair in the world, accounting for an estimated 30% off all transactions, followed by EUR/JPY (4%), EUR/GBP (3%) and EUR/AUD (2%).
The European Central Bank (ECB) in Frankfurt, Germany, is the reserve bank for the Eurozone. The ECB sets interest rates and manages monetary policy. The ECB’s primary mandate is to maintain price stability, which means either controlling inflation or stimulating growth. Its primary tool is the raising or lowering of interest rates. Relatively high interest rates – or the expectation of higher rates – will usually benefit the Euro and vice versa. The ECB Governing Council makes monetary policy decisions at meetings held eight times a year. Decisions are made by heads of the Eurozone national banks and six permanent members, including the President of the ECB, Christine Lagarde.
Eurozone inflation data, measured by the Harmonized Index of Consumer Prices (HICP), is an important econometric for the Euro. If inflation rises more than expected, especially if above the ECB’s 2% target, it obliges the ECB to raise interest rates to bring it back under control. Relatively high interest rates compared to its counterparts will usually benefit the Euro, as it makes the region more attractive as a place for global investors to park their money.
Data releases gauge the health of the economy and can impact on the Euro. Indicators such as GDP, Manufacturing and Services PMIs, employment, and consumer sentiment surveys can all influence the direction of the single currency. A strong economy is good for the Euro. Not only does it attract more foreign investment but it may encourage the ECB to put up interest rates, which will directly strengthen the Euro. Otherwise, if economic data is weak, the Euro is likely to fall. Economic data for the four largest economies in the euro area (Germany, France, Italy and Spain) are especially significant, as they account for 75% of the Eurozone’s economy.
Another significant data release for the Euro is the Trade Balance. This indicator measures the difference between what a country earns from its exports and what it spends on imports over a given period. If a country produces highly sought after exports then its currency will gain in value purely from the extra demand created from foreign buyers seeking to purchase these goods. Therefore, a positive net Trade Balance strengthens a currency and vice versa for a negative balance.
추천 기사


