


Bitcoin Weekly Forecast: Bitcoin rebounds, supported by institutional demand and Fed outlook
- Bitcoin extends rebound to near $112,000 on Friday, recovering nearly 4% so far this week.
- Growing corporate and institutional demand underpins BTC’s rebound.
- Market participants stay cautious ahead of US NFP, which could influence the Fed’s rate-cut outlook.
Bitcoin (BTC) price extends rebound and trades near $112,000 at the time of writing on Friday, gaining nearly 4% so far this week, after declining 4.62% in the previous one. This recovery comes amid growing corporate and institutional support. However, traders remain cautious ahead of key US employment data on Friday, which could influence the Federal Reserve’s (Fed) interest rate outlook and provide fresh directional bias for the largest cryptocurrency by market capitalization.
Fed rate cut expectations boost BTC recovery
After extending its three-week trend of lower lows from its record high of $124,474 to hit a low of $107,255 during the Asian sesion on Monday, Bitcoin price started a recovery, hovering around $112,000 during the European trading session on Friday.
The price recovery got boosted as the US JOLTS Job Openings data released on Wednesday signaled that the US labor market is cooling, reaffirming bets that the Federal Reserve will lower borrowing costs in September.
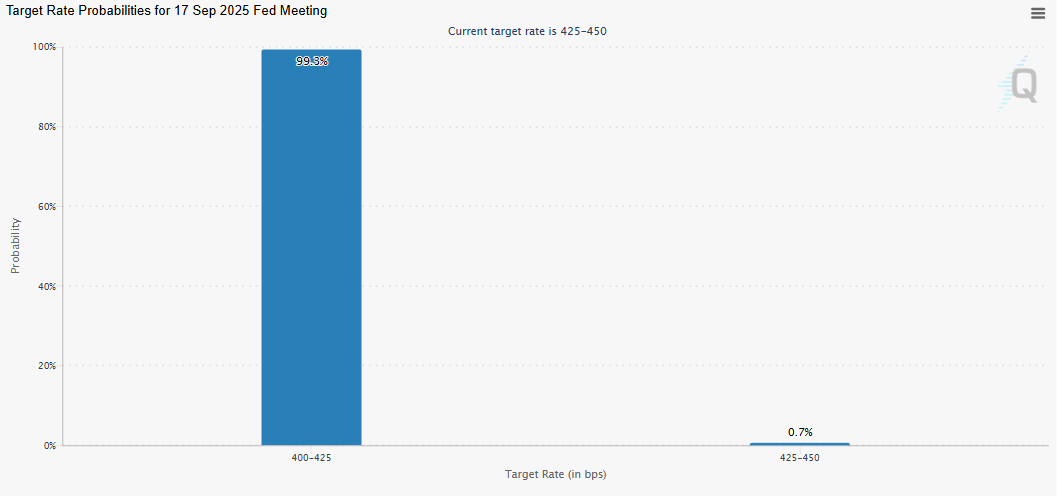
The CME Group’s FedWatch tool, as shown in the graph below, indicates a 99.3% possibility of a 25 basis points (bps) rate cut by the central bank at September's meeting. Fed rate cut expectations may weigh on the US Dollar (USD) and boost risk-on sentiment, supporting a recovery in riskier assets, such as BTC. Furthermore, market participants expect the central bank to deliver at least two rate cuts by the end of 2025, which could further boost riskier asset prices such as BTC.
On Thursday, US economic data pointed to further signs of a cooling labor market. In fact, the Automatic Data Processing (ADP) reported that US private-sector employers added 54,000 jobs in August, down from a 106,000 (revised from 104,000) increase recorded in July and below expectations of 65,000.
The market focus, however, will remain glued to the release of the official monthly employment report, as the Nonfarm Payrolls (NFP) for August is scheduled for Friday at 12:30 GMT.
This key economic data release would provide more clues about the Fed’s rate-cut path and a fresh directional impetus for the largest cryptocurrency by market capitalization.
Institutional and corporate demand help BTC cushion downside pressure
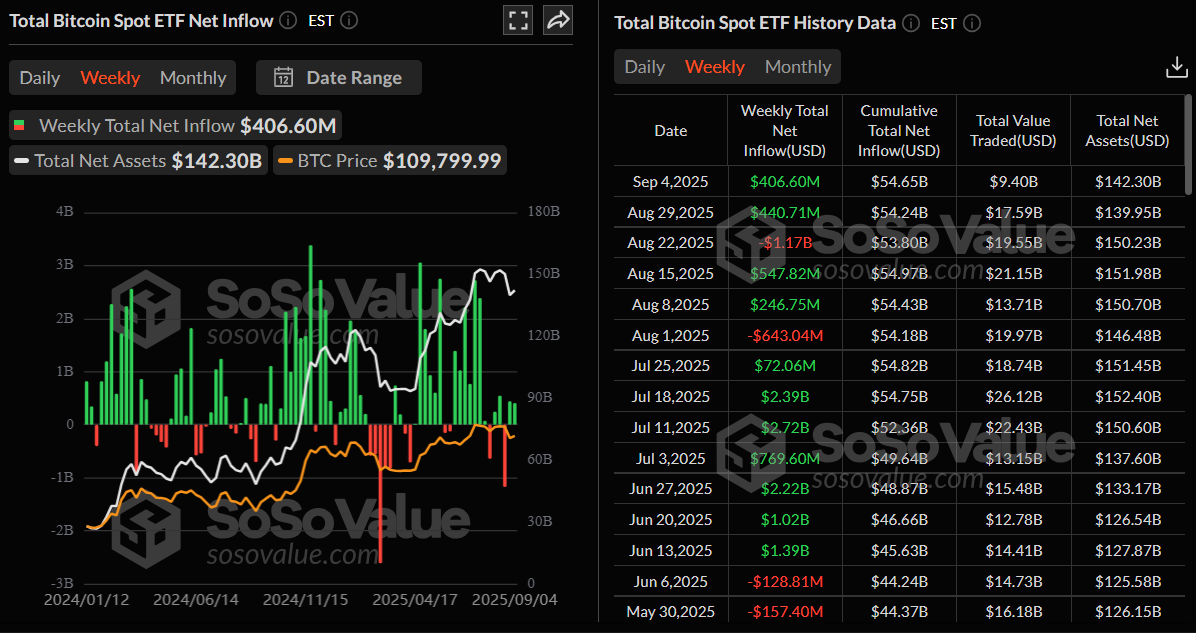
Bitcoin price recovery has been supported by institutional and corporate investors so far this week. SoSoValue data below shows that Bitcoin spot Exchange Traded Funds (ETFs) recorded a total of $406.60 million in inflows so far this week as of Thursday, continuing its second consecutive week of positive flows. However, these weekly inflows are smaller compared to those seen during mid-July, when BTC rallied toward $120,000 mark for the first time.
On the corporate front, Nasdaq-listed CIMG Inc. announced on Tuesday the completion of the sale of 220 million common shares, raising a total of $55 million in exchange for 500 Bitcoins, as part of its long-term holding strategy to establish a Bitcoin reserve.
Earlier on Monday, Japanese investment firm Metaplanet purchased an additional 1,009 BTC, bringing the firm’s total holdings to 20,000 BTC. Additionally, on Tuesday, Michael Saylor announced a dividend increase for STRC preferred stock from 9% to 10%, a strategic move by Strategy (formerly MicroStrategy) to leverage its Bitcoin holdings.
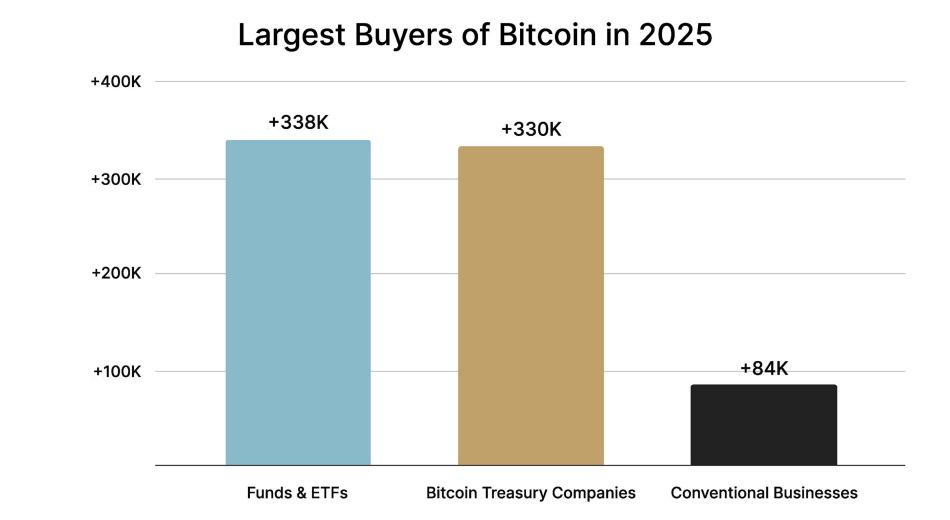
Bitcoin financial services firm River released a research report this week, highlighting that, as a group, Bitcoin treasury companies are the second-largest buyers of Bitcoin in 2025, acquiring roughly 1,400 BTC per day. These purchases are fueled by strong investor interest in the Stocks, Bonds, and other securities issued by these firms.
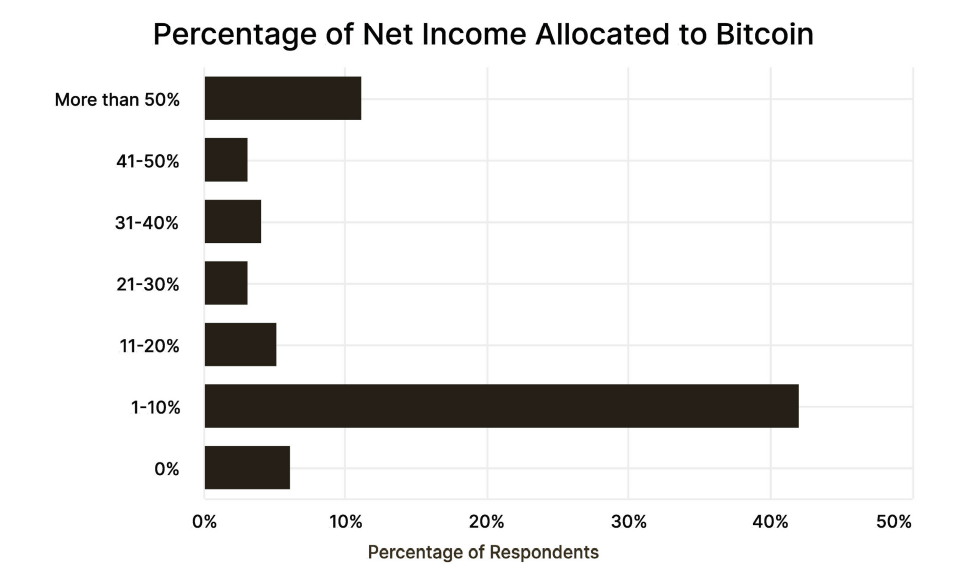
The report further explained that many businesses are allocating far more than a hypothetical 1% of their funds to Bitcoin. Businesses using River allocate an average of 22% of their net income, according to a survey conducted in July 2025. The median allocation is 10%, signaling growing grassroots adoption.
Easing market sentiment
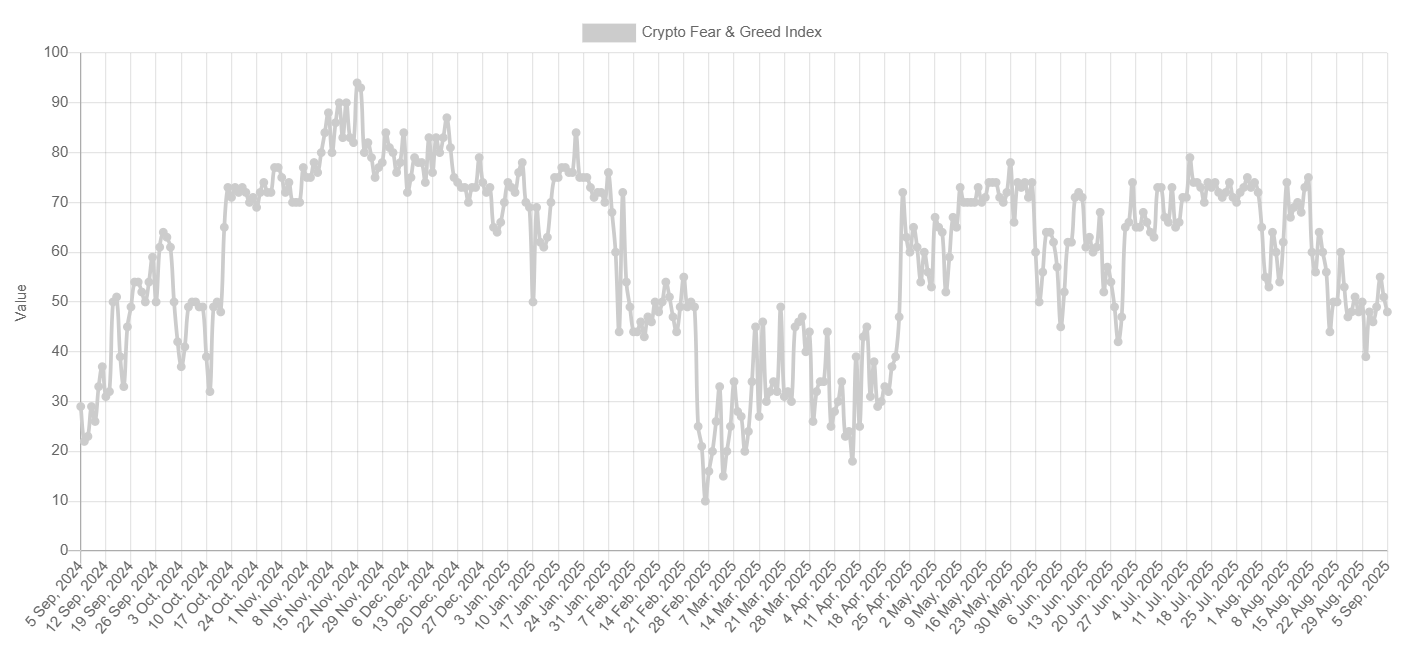
The Crypto Fear and Greed Index metric, which measures the overall sentiment of the cryptocurrency market, has recovered to 48 this week, reflecting a neutral sentiment and suggesting that bearish pressure may be easing.
This metric had dropped to nearly a four-month low on the previous Saturday, indicating a shift in investor sentiment toward extreme fear following recent corrections, while BTC price reached the lows of early July.
Ray Dalio, founder of Bridgewater Associates, said in an interview with the Financial Times this week, “Crypto is now an alternative currency that has its supply limited, so, all things being equal.”
Dalio continued that if the supply of US Dollars rises and/or the demand for it falls, it would likely make crypto an attractive alternative currency. He believes that most fiat currencies, especially those with large debts, will have problems being effective storeholds of wealth and will go down in value relative to hard currencies. This is what happened in the 1930s to 1940s period and the 1970s to 1980s period.
Bitcoin's growing adoption, a key gateway to crypto
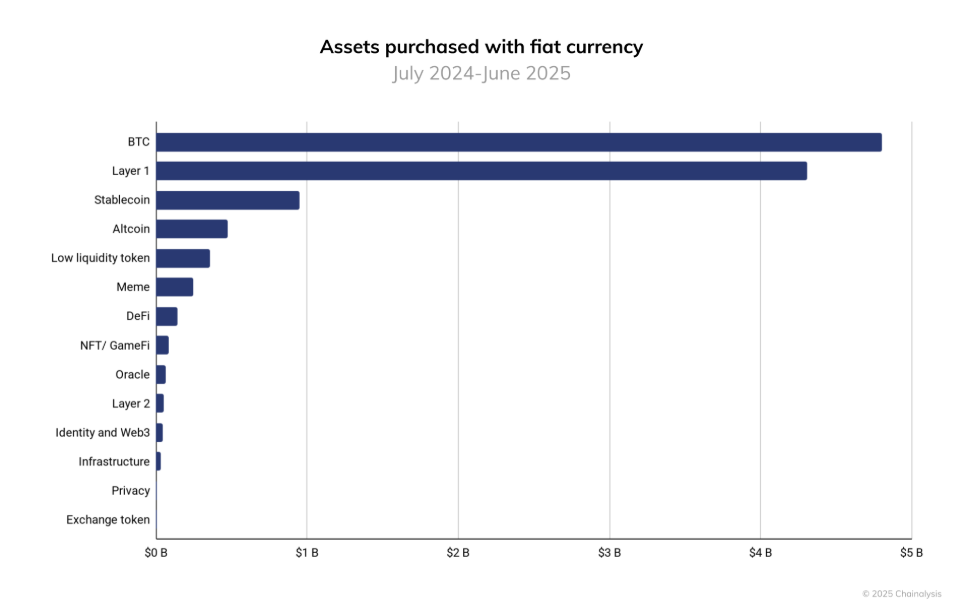
The Chainalysis’ 2025 Global Crypto Adoption Index, released earlier this week, highlighted that Bitcoin remains the primary entry point (serves as the primary gateway into the crypto economy), with over $4.6 trillion in fiat inflows between July 2024 and June 2025, double that of Layer 1 tokens (excluding BTC and ETH).
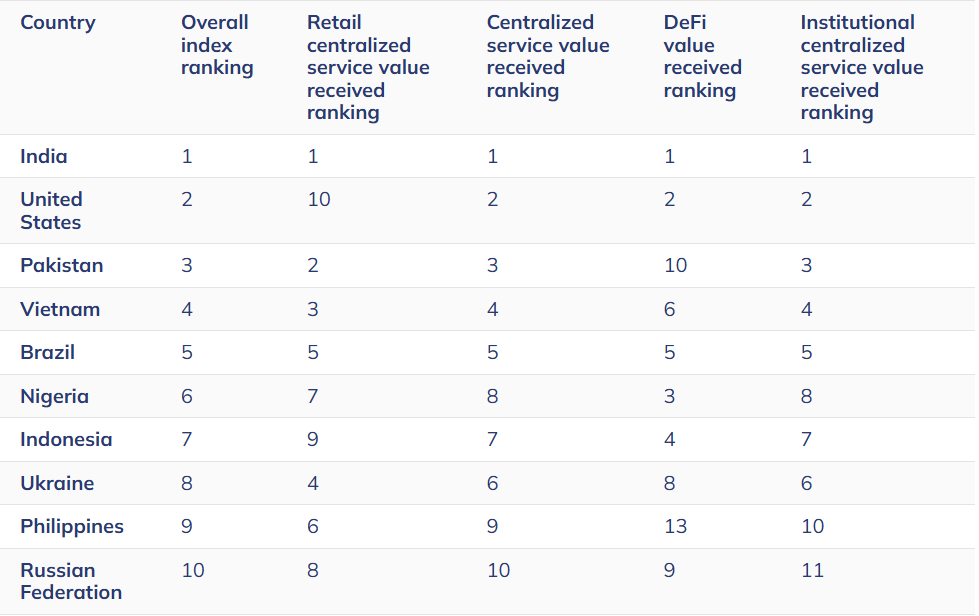
The report further notes that countries such as India, the US, and Pakistan are ranked among the top three, followed by Vietnam and Brazil, indicating that these countries have growing crypto adoption.
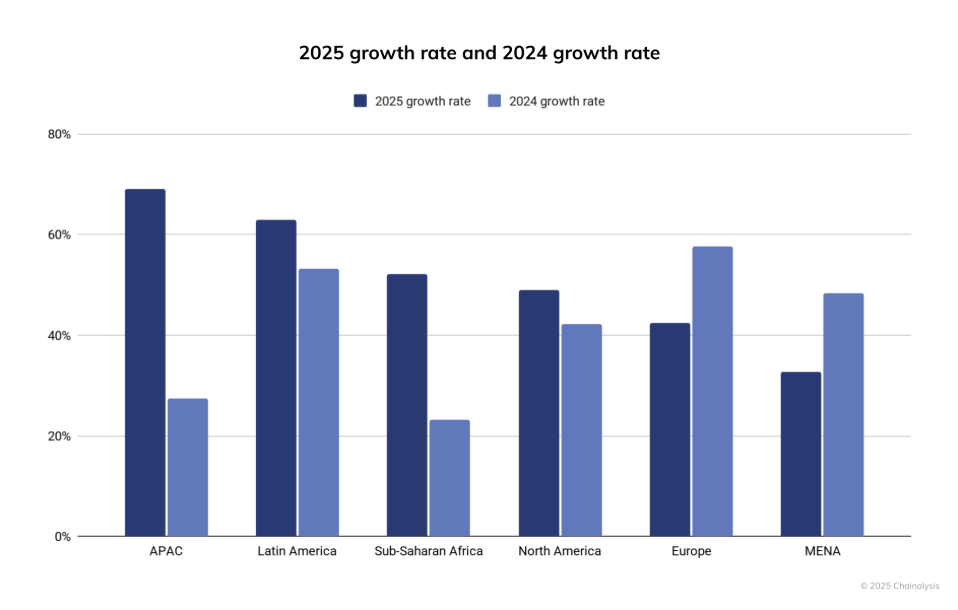
The Asia-Pacific (APAC) region led with 69% year-over-year growth in on-chain crypto transactions, driven primarily by India, Vietnam and Pakistan, while Latin America followed with 63% growth.
Technical outlook breakdown
Bitcoin price on the 4-hour chart shows that the bullish RSI divergence on the momentum indicator on Monday, as shown in the chart below, has played out as expected, supporting its recovery this week.
BTC broke above a descending trendline (drawn by connecting multiple highs on the 4-hour chart since August 22) on Tuesday. It roughly retested this trendline on Thursday and is now rebounding, trading near $112,000 on Friday.
If BTC continues its recovery, it could extend the rally toward its August 22 high at $117,429.
The Relative Strength Index (RSI) on the 4-hour chart stands at 57, above its neutral level of 50, indicating that bullish momentum is gaining traction. The Moving Average Convergence Divergence (MACD) is about to flip a bullish crossover, indicating improving momentum and supporting the bullish view.
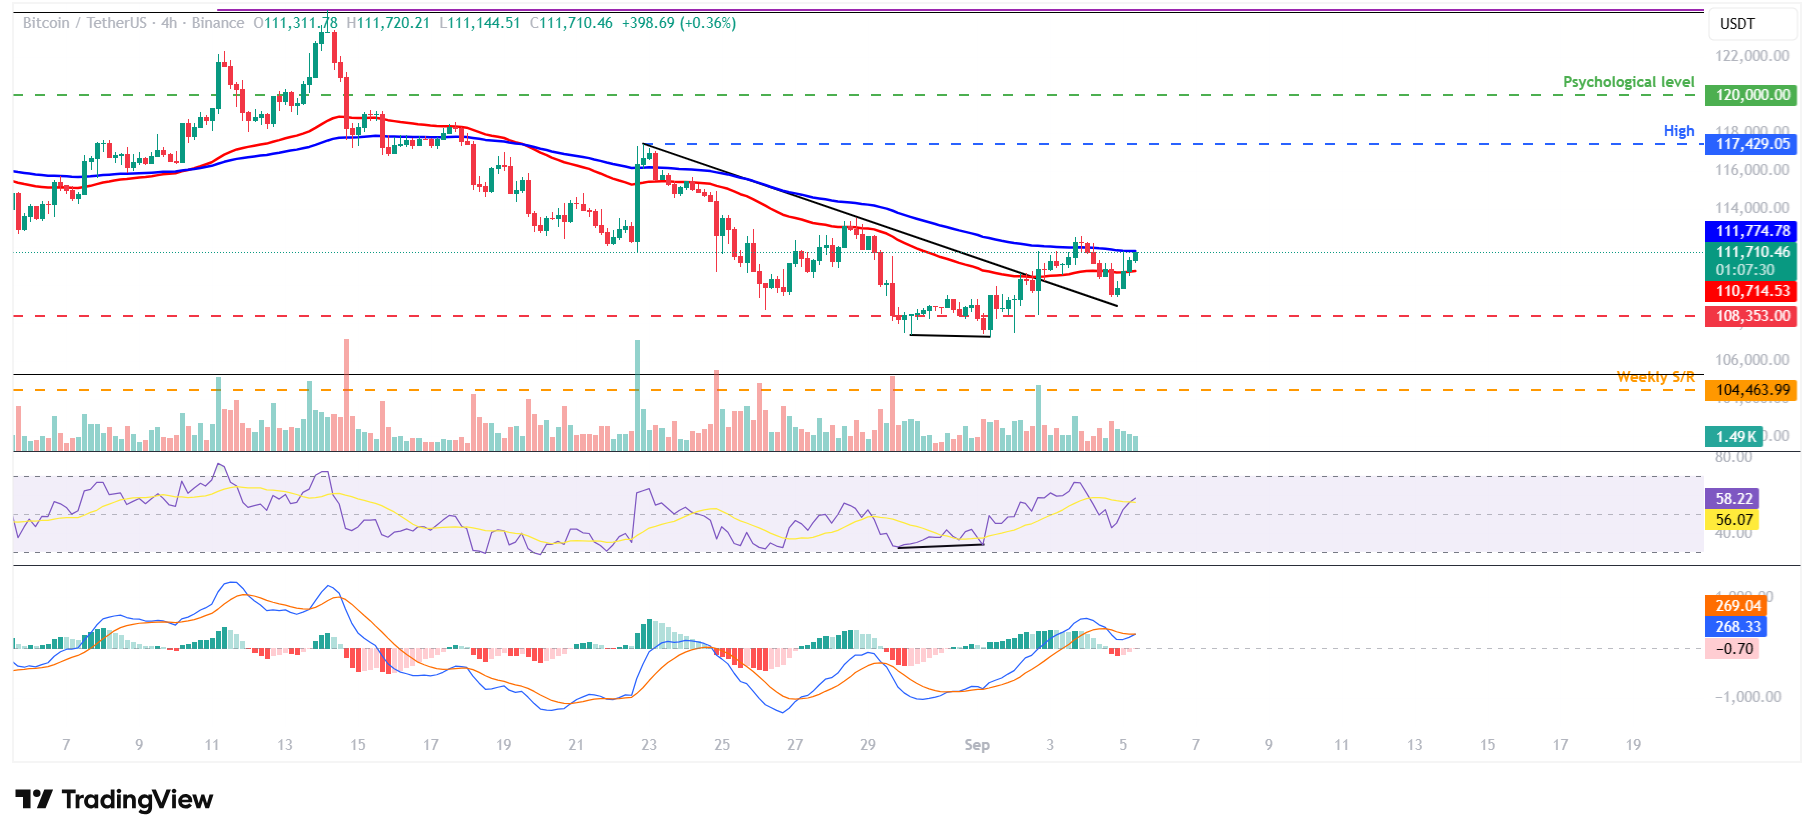
BTC/USDT 4-hour chart
On the daily chart, BTC closed above the 100-day Exponential Moving Average (EMA) at $110,753 on Tuesday, holding above this dynamic support throughout the week, even though it was under pressure on Thursday.
If BTC extends its recovery, it could further the rally toward its daily resistance level at $116,000.
The RSI on the daily chart reads 47 and points upward toward its neutral level of 50, indicating that, after this week's recovery, bearish momentum is fading. Moreover, the MACD is showing a bullish crossover on Friday, indicating improving momentum and supporting the bullish view.
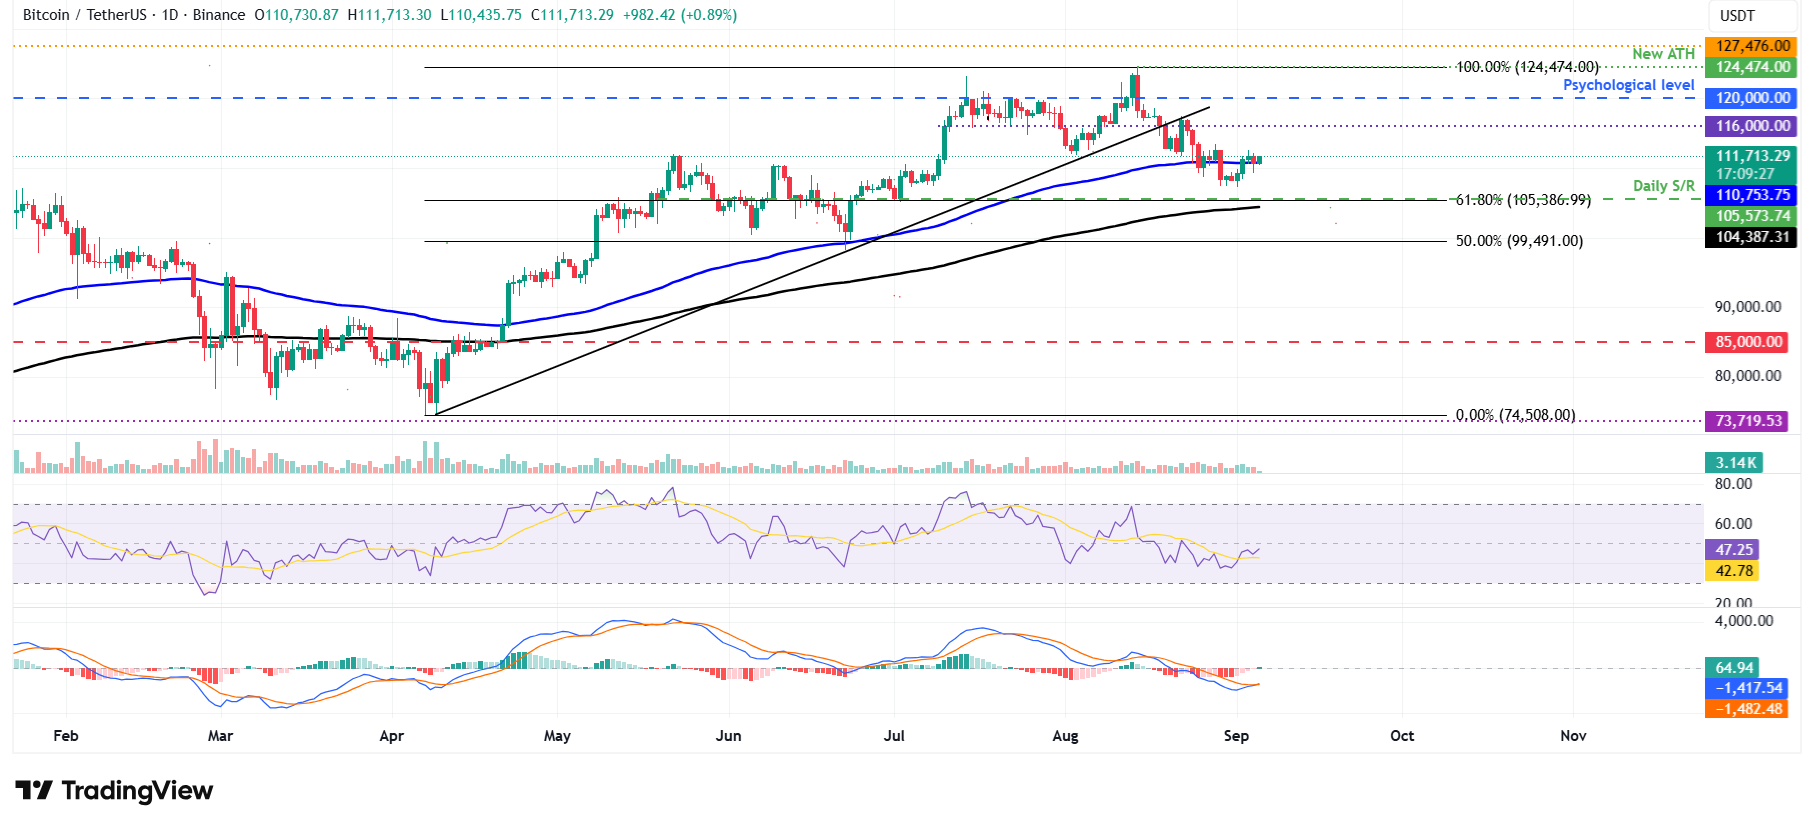
BTC/USDT daily chart
Bitcoin's weekly chart shows that BTC has retested the early July’s weekly low of $107,429, finding support around this level and recovering nearly 4% so far this week.
If the support level at $107,429 continues to hold, BTC could extend the recovery toward its key psychological level at $120,000.
The RSI on the weekly chart read 56, rebounding from its neutral level of 50, indicating bulls still have room for upward momentum. However, traders should be cautious, as the MACD indicator on the weekly chart showed a bearish crossover last week, giving a sell signal and suggesting a weakening of momentum.
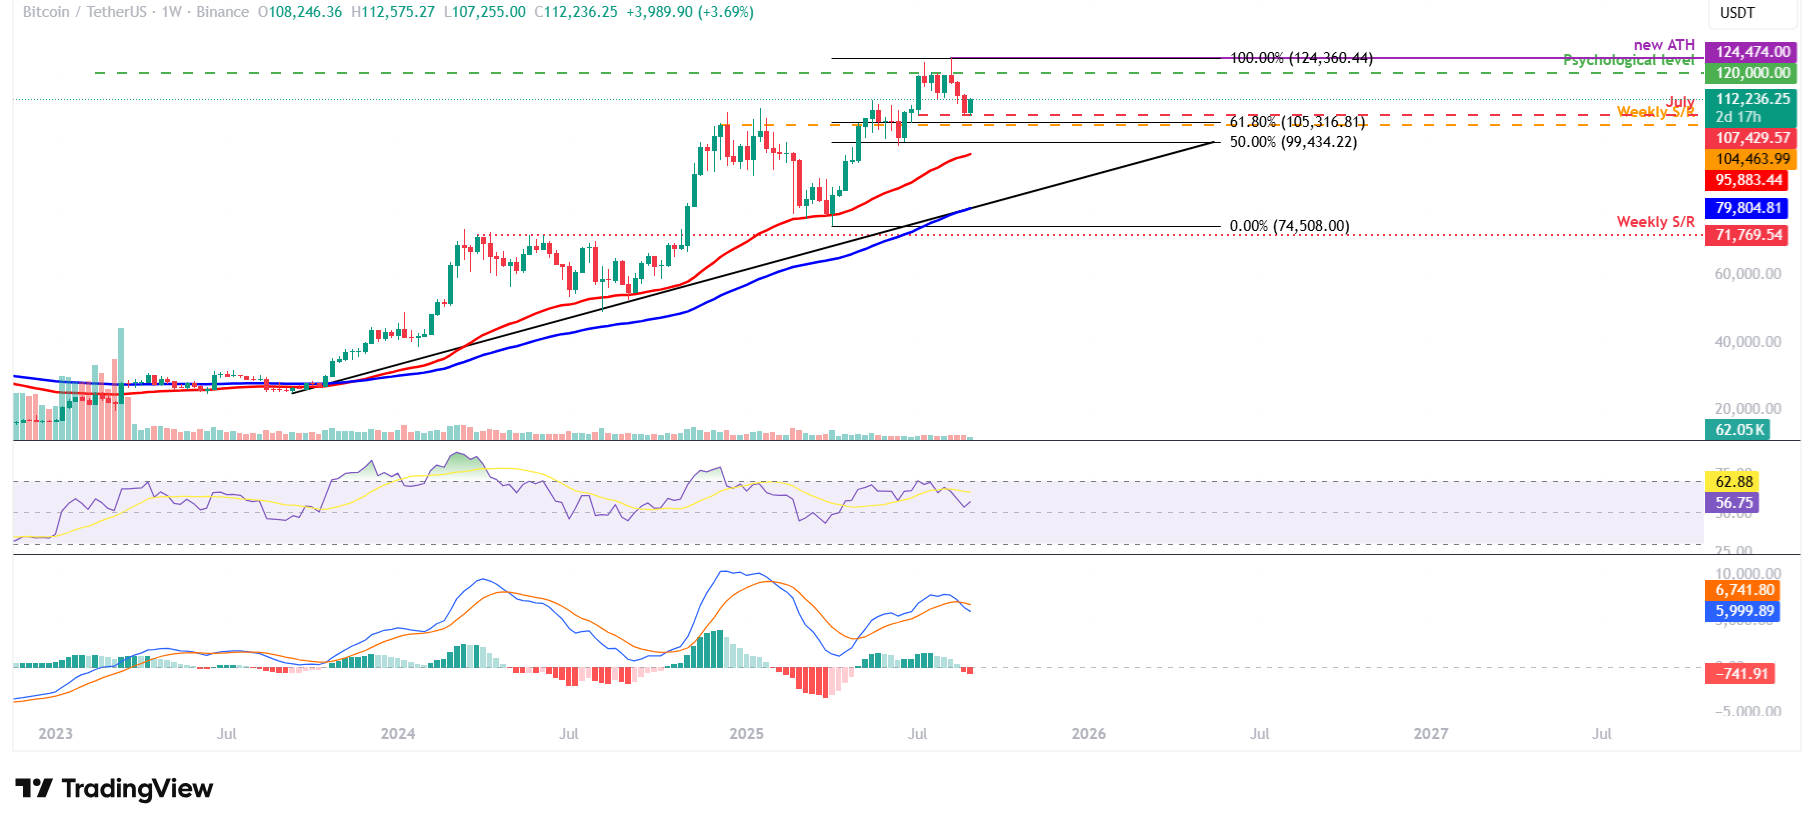
BTC/USDT weekly chart
If BTC faces a correction and closes below the support level at $107,429, it could extend the decline toward its next weekly support at $104,463.
추천 기사


