


Dow Jones Industrial Average rallies on potential trade deals
- The Dow Jones lurched into near-time highs as the Trump administration teases new trade deals.
- Tariff levels are set to swing lower as progress on Japan and EU trade deals is made, but details remain thin.
- Another walkback from sky-high import tax threats is bolstering investor sentiment.
The Dow Jones Industrial Average (DJIA) caught a strong bid on Wednesday, rising to its highest levels in five months and knocking on the door of fresh all-time highs. The United States (US) appears to be making progress on trade deals with both Japan and the European Union (EU), giving investors a firm confidence boost as they head through the midweek market session.
EU trade deal on the table, but backup plans in the works
According to reporting by the Financial Times, the Trump administration and the EU are inching toward a firm deal that would see the majority of President Donald Trump’s threatened tariffs against European goods fall by the wayside. Specific details about what a EU-US trade pact would look like remain thin; however, any sign of progress is good news for stock markets, which have been battling tariff woes through the majority of the year up to this point.
There’s still plenty of time for things to go wrong: according to statements from EU diplomats, European member countries are poised to vote on a package of counter-tariffs against the US as soon as Thursday if a trade deal which includes tariffs of no more than 30% on European exports to the US is not reached. If the vote passes, the EU could impose a targeted package of counter-tariffs on $109B worth of US goods beginning on August 7.
A trade spokesperson for the European Commission (EC), Olof Gill, noted that “the EU’s primary focus is on achieving a negotiated outcome with the US”, but noted that the EU remains ready to use its anti-coercion instruments (ACI) to fast-track retaliatory tariffs should a trade deal fall through.
US-Japan trade deal poses fresh trade complications
A tentative trade agreement between the US and Japan was announced this week, which would include a “reciprocal” 15% tariff level on all Japanese goods imported into the US. While investors are taking it as a good sign in the short term, things could get messy for US companies down the line, who will struggle with the already existing 50% US tariffs on steel and aluminum, as well as pending flat tariffs on copper. Japanese companies that export metal-based goods to the US will enjoy a permanent cost advantage over US products under the current trade plans.
Read more stock news: Fiserv stock plunges 21% on Q2 organic sales miss
Dow Jones price forecast
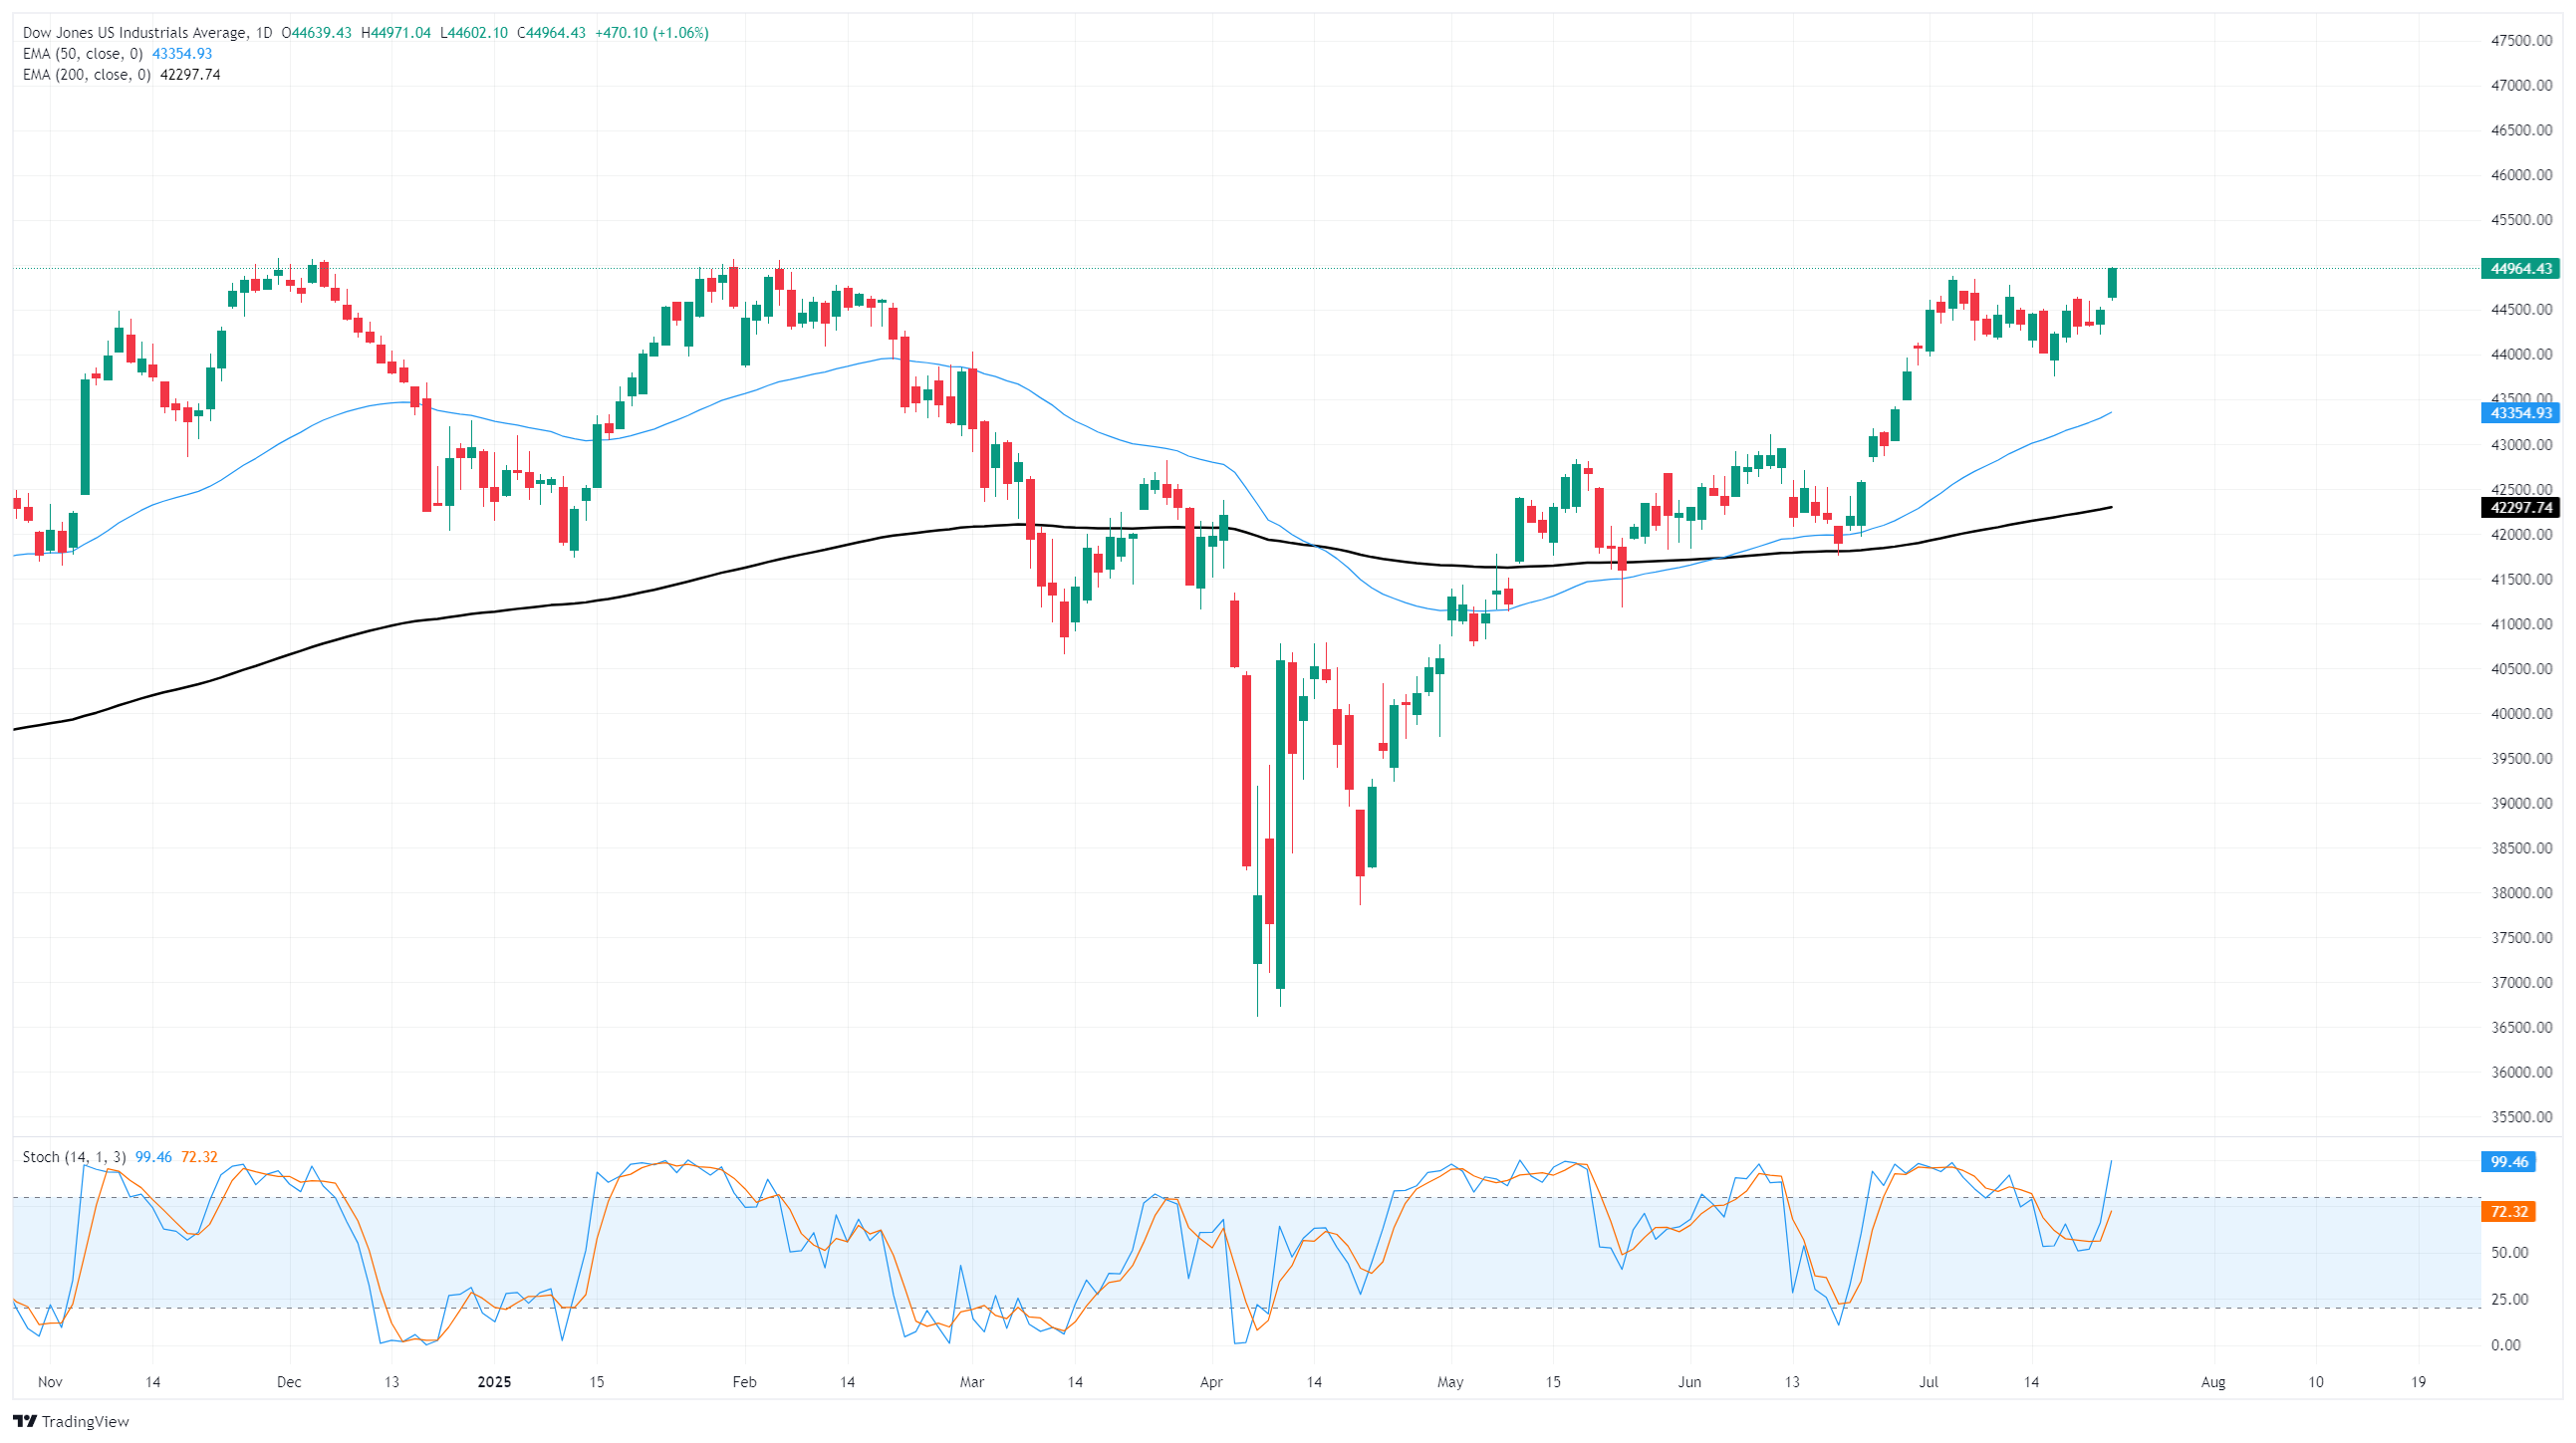
Wednesday’s bullish push has put the Dow Jones on track to challenge record highs north of 45,000. The Dow has broken out of recent congestion to the high side, but a near-term bearish pullback could send the major equity index back into consolidation range.
Last November’s peak of 45,071.56 is the record high that bulls will need to beat to muscle the Dow back into all-time highs. On the low end, a bearish reversal could see the DJIA backslide all the way to the 50-day Exponential Moving Average (EMA) near 43,365.
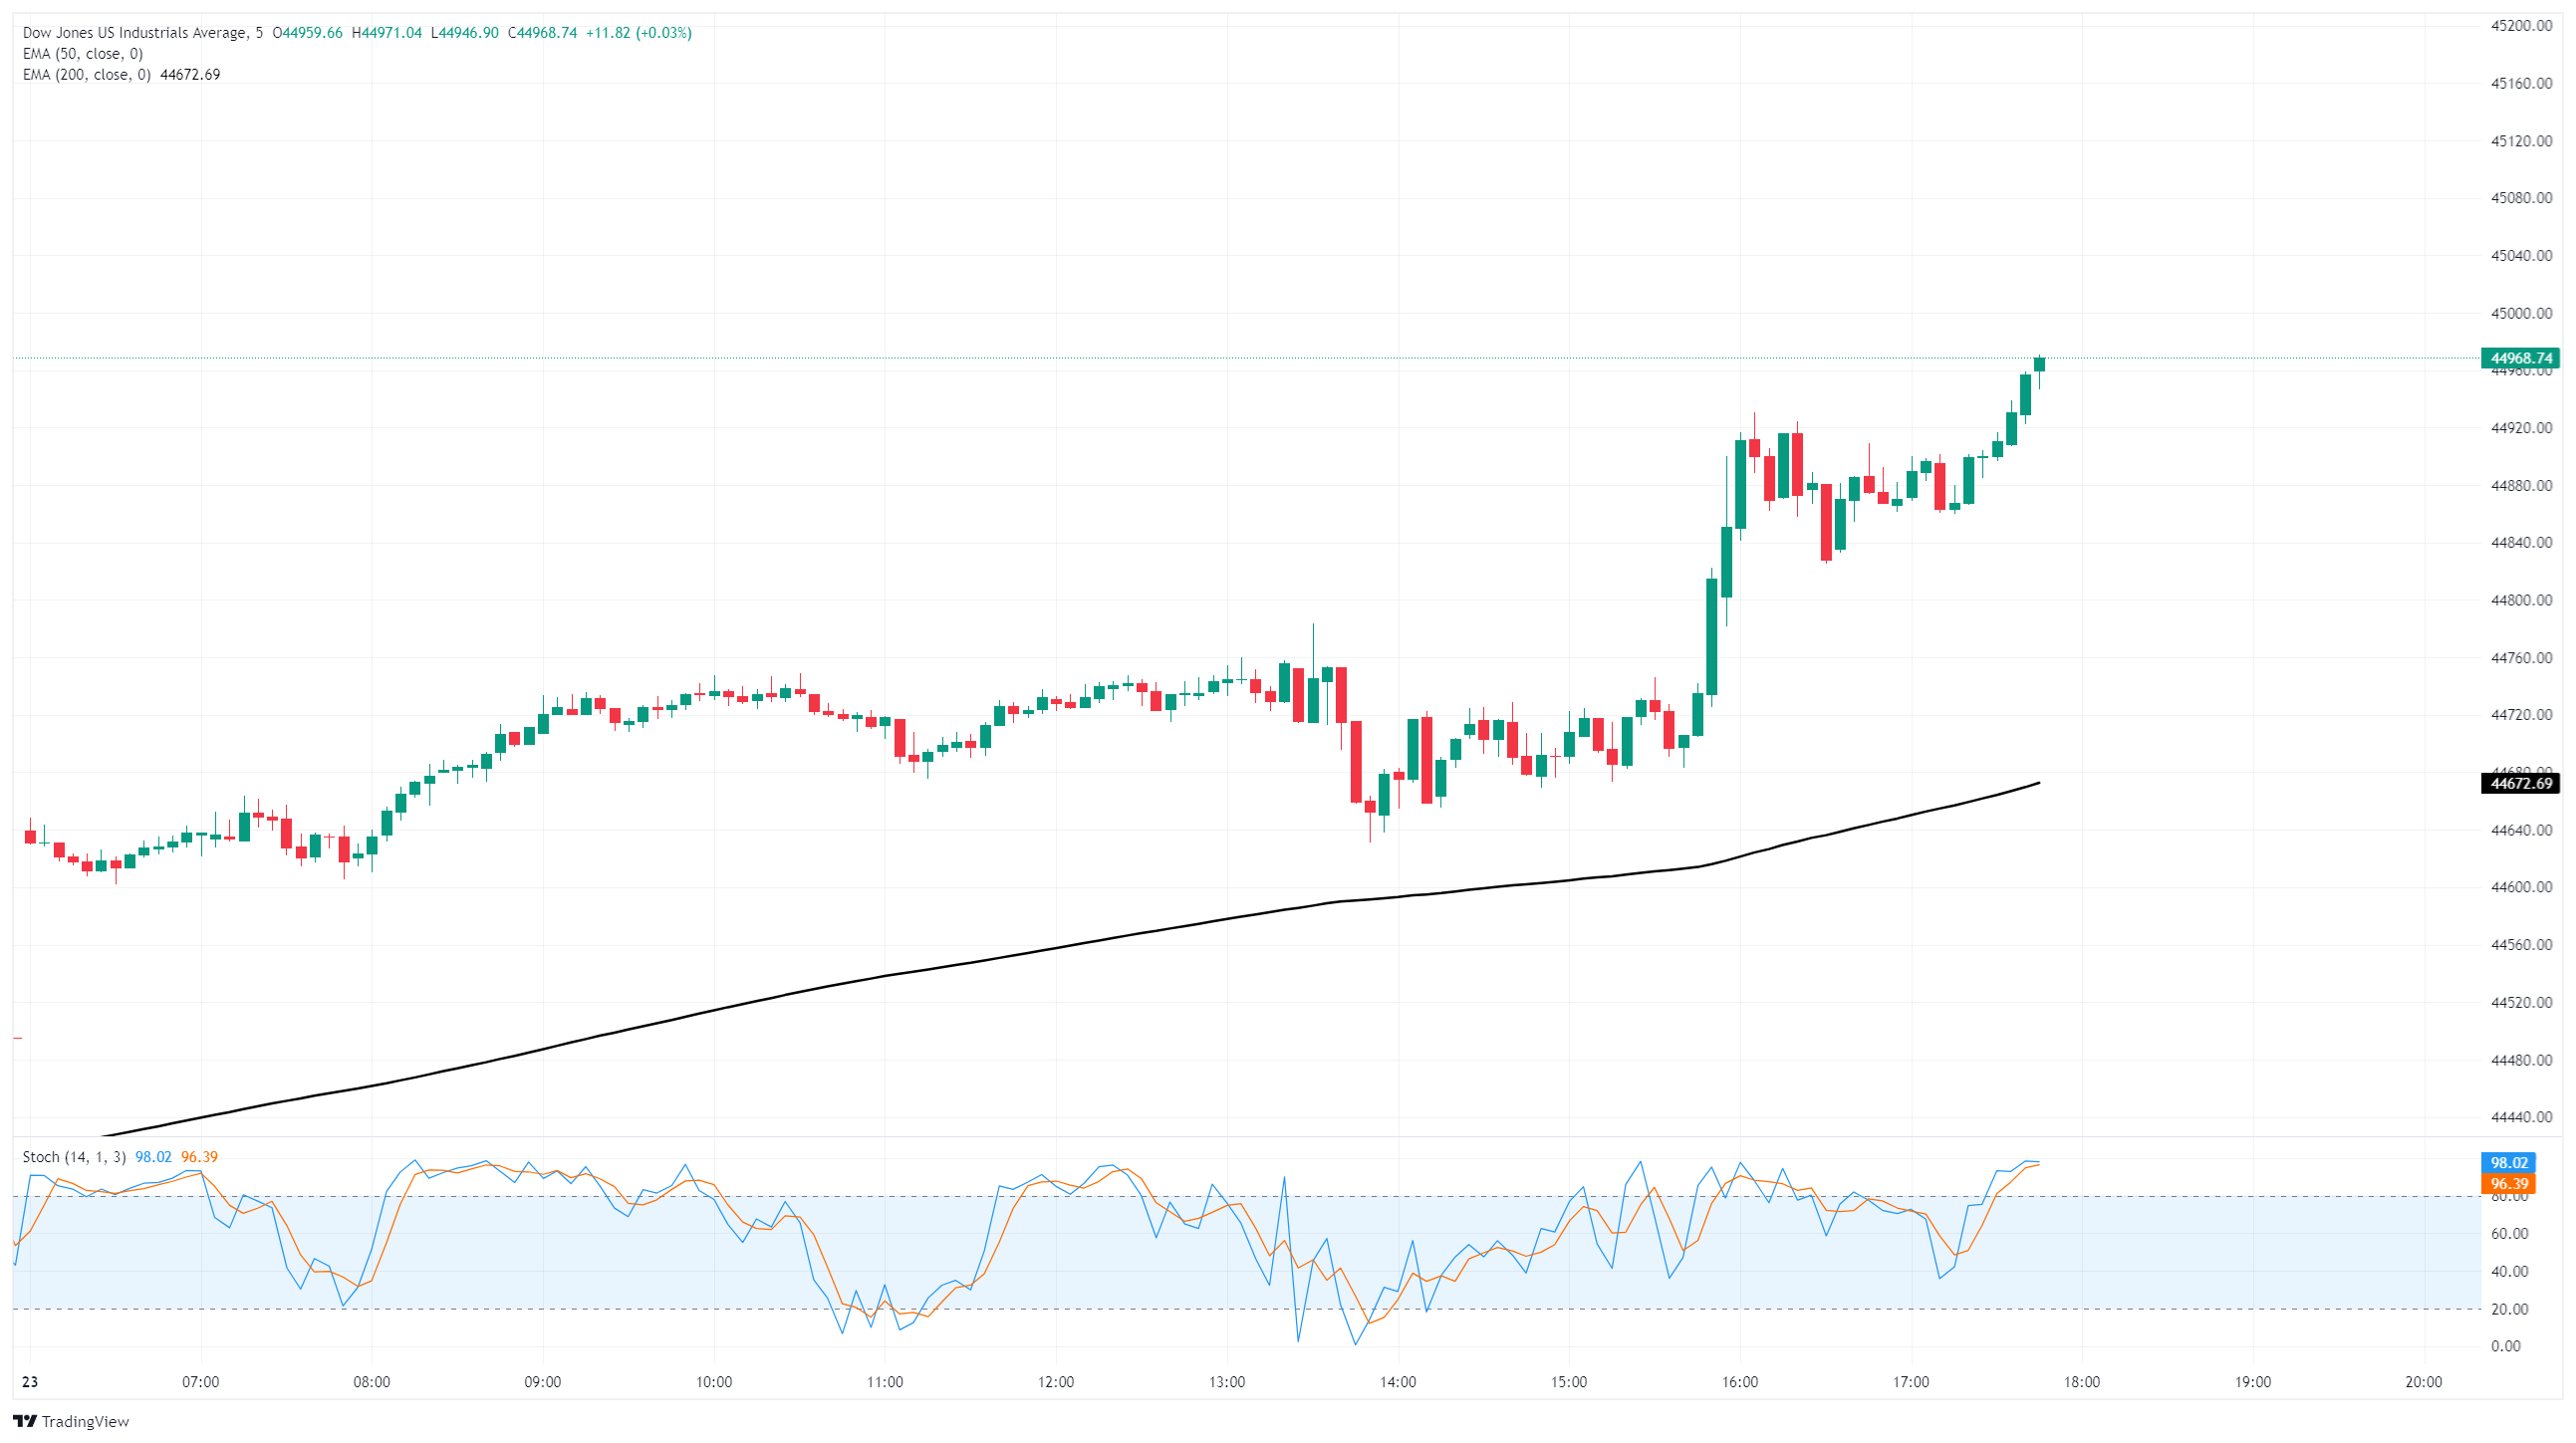
Dow Jones 5-minute chart
Dow Jones daily chart
Dow Jones FAQs
The Dow Jones Industrial Average, one of the oldest stock market indices in the world, is compiled of the 30 most traded stocks in the US. The index is price-weighted rather than weighted by capitalization. It is calculated by summing the prices of the constituent stocks and dividing them by a factor, currently 0.152. The index was founded by Charles Dow, who also founded the Wall Street Journal. In later years it has been criticized for not being broadly representative enough because it only tracks 30 conglomerates, unlike broader indices such as the S&P 500.
Many different factors drive the Dow Jones Industrial Average (DJIA). The aggregate performance of the component companies revealed in quarterly company earnings reports is the main one. US and global macroeconomic data also contributes as it impacts on investor sentiment. The level of interest rates, set by the Federal Reserve (Fed), also influences the DJIA as it affects the cost of credit, on which many corporations are heavily reliant. Therefore, inflation can be a major driver as well as other metrics which impact the Fed decisions.
Dow Theory is a method for identifying the primary trend of the stock market developed by Charles Dow. A key step is to compare the direction of the Dow Jones Industrial Average (DJIA) and the Dow Jones Transportation Average (DJTA) and only follow trends where both are moving in the same direction. Volume is a confirmatory criteria. The theory uses elements of peak and trough analysis. Dow’s theory posits three trend phases: accumulation, when smart money starts buying or selling; public participation, when the wider public joins in; and distribution, when the smart money exits.
There are a number of ways to trade the DJIA. One is to use ETFs which allow investors to trade the DJIA as a single security, rather than having to buy shares in all 30 constituent companies. A leading example is the SPDR Dow Jones Industrial Average ETF (DIA). DJIA futures contracts enable traders to speculate on the future value of the index and Options provide the right, but not the obligation, to buy or sell the index at a predetermined price in the future. Mutual funds enable investors to buy a share of a diversified portfolio of DJIA stocks thus providing exposure to the overall index.
추천 기사


