
US Dollar slips as trade tensions flare, Fed uncertainty weigh on sentiment
- The US Dollar starts the week under pressure, slipping against major currencies on Monday.
- Despite solid US economic data, the DXY remains capped below the key 99.00 resistance.
- The DXY US Dollar Index is hovering above critical support near 98.00, showing signs of fading momentum.
The US Dollar (USD) kicks off the week on the back foot, slipping against major currencies in Monday trading. Investors are reacting to renewed trade tensions ahead of the August 1 deadline and a generally cautious market sentiment. Despite mostly solid US economic data lately, the Greenback is feeling the heat from ongoing uncertainty surrounding the US President Donald Trump administration’s ramped-up tariff threats and increasing political pressure on the Federal Reserve (Fed) to cut interest rates.
The US Dollar Index (DXY), which measures the Greenback against six major currencies, is slipping further after a mild drop in Monday’s Asian session after notching two consecutive weekly gains. Despite a turbulent week marked by fresh tariff threats and reports that President Trump considered firing Fed Chair Jerome Powell, a claim he later downplayed as “highly unlikely”, the US Dollar Index still managed to hold modest gains.
Mixed messages from Fed officials on a possible July rate cut added to the uncertainty, but strong economic data, including solid Retail Sales and a healthy labor market, lent support to the Greenback. The DXY ended the week up 0.62%, showcasing its resilience in the face of political noise and policy tensions. However, the broader trend suggests underlying weakness in the US dollar.
As of the European trading hours, the index is trading around 98.05. Still, the movement has been limited, with the DXY stuck in a tight range between 98.00 and 99.00 over the past five days as it continues to test a cluster of key technical levels.
Looking ahead, the US economic calendar is relatively light, and the Fed is currently in its blackout period ahead of the July 30 policy meeting, meaning that no official comments on monetary policy from Fed members are expected. While Fed Chair Jerome Powell and Governor Michelle Bowman are scheduled to speak on Tuesday, their remarks are expected to avoid policy topics. With the Fed sidelined, markets will look to Thursday’s preliminary S&P Global Purchasing Managers Index (PMI) data and Friday’s Durable Goods orders for fresh clues on the US economy and the Fed’s next move.
Market Movers: BRICS, EU tariff risks mount, GENIUS act becomes law
- The yield on the US 10-year Treasury fell to around 4.40% on Monday, marking its fourth straight daily decline. The drop comes as investors turn more cautious amid rising trade tensions, especially with looming tariff deadlines involving the EU and BRICS nations. Growing geopolitical uncertainty is driving demand toward safer assets, such as Treasuries, and pushing yields lower. Expectations for near-term Fed interest rate cut have also cooled slightly, contributing to the move lower.
- Trade tensions between the United States and the European Union (EU) have reignited ahead of a looming deadline. According to a report by the Financial Times on Friday, President Donald Trump is pushing to raise tariffs on EU imports from the current 10% baseline to 15%–20%, with the potential for a 30% levy on automobiles and pharmaceuticals if a deal isn’t reached by August 1. This follows an earlier warning from the Trump administration on July 12, which outlined plans to impose 30% tariffs on EU goods should negotiations fail to produce a resolution by the deadline.
- US Commerce Secretary Howard Lutnick reiterated that August 1 remains a hard deadline for trade deals with the European Union and other major economies. In an interview with CBS’s Face the Nation on Sunday, Lutnick warned, “Nothing stops countries from talking to us after August 1, but they’re going to start paying.” He added that while discussions could continue past the deadline, tariffs would be enforced if agreements aren't finalized in time. Despite the tough stance, Lutnick struck a cautiously optimistic tone, stating, “We are confident we’ll get a deal with Europe before August 1. But if we don’t, the tariffs will apply.” He also clarified that the US will move ahead with a 10% baseline tariff on imports from smaller countries.
- Trade tensions widened over the weekend as President Trump took fresh aim at the BRICS bloc, labeling the group a “little group fading fast,” citing them as a challenge to US economic dominance and the US Dollar’s reserve status. Speaking during a campaign stop, Trump reiterated his plan to impose a 10% tariff on all BRICS nations, warning that any country "in the BRICS consortium of nations, we are going to tariff you 10 percent."
- The cryptocurrency market experienced a significant win this weekend after Donald Trump signed the GENIUS Act into law. This new rulebook sets clear guidelines for companies that issue stablecoins — digital tokens tied to the US Dollar. The law requires stablecoin issuers to maintain 1:1 reserves in cash or short-term Treasuries, provide monthly disclosures, and undergo regular audits. Larger issuers will face stricter oversight, including annual reviews by federal banking authorities.
- While the move is a major milestone for crypto adoption, it also has potentially supportive implications for the US Dollar. By enforcing Dollar-backed collateral standards, the legislation strengthens the role of USD-pegged stablecoins in global finance, particularly in decentralized markets and cross-border transactions. Analysts note that the clarity and legitimacy offered by the Genius Act may attract more institutional capital into USD-linked digital assets, thereby reinforcing demand for the Greenback in both traditional and digital ecosystems.
Technical analysis: DXY pauses after wedge breakout as momentum fades
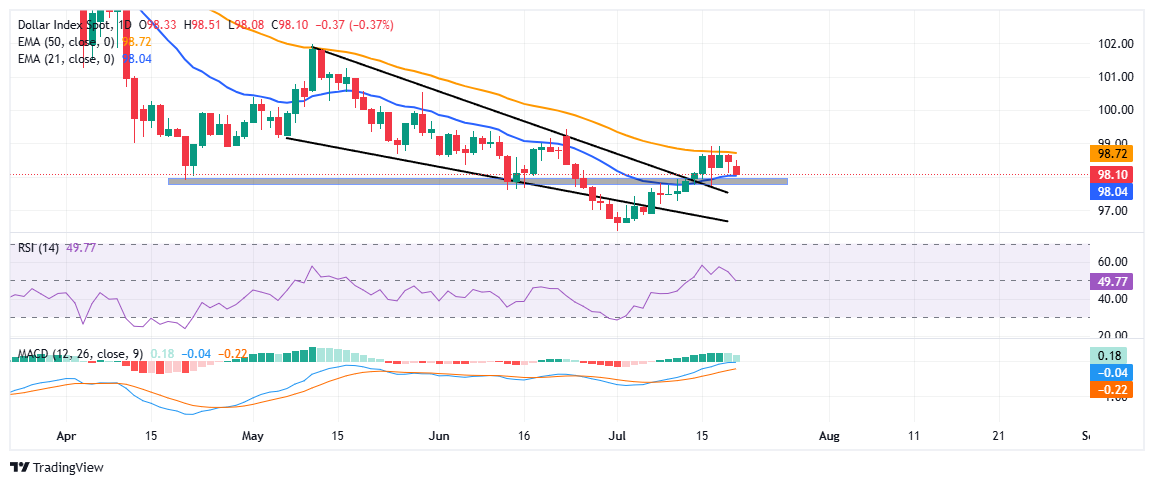
The US Dollar Index (DXY) broke out of a falling wedge pattern last week, hinting at a potential bullish reversal and pushing the index to a four-week high of 98.93 on Thursday. But the rally lost steam just shy of the key 99.00 level, which continues to serve as strong resistance. Since then, the DXY has been stuck in a tight range between 98.00 and 99.00, reflecting a market that's hesitant to commit amid ongoing trade tensions and uncertainty over the Fed’s next move.
On the downside, the 97.80-98.00 zone has become a critical support area, aligning with the 21-day Exponential Moving Average (EMA) at 98.04 and the upper boundary of the former wedge pattern, which is now acting as a support level. This zone is critical to maintaining the bullish breakout structure. On the upside, the 50-day EMA, currently at 98.72, has consistently capped intraday advances, keeping the index in check throughout the last week.
The Relative Strength Index (RSI) on the daily chart is hovering near the neutral level, signalling a lack of momentum, while the Moving Average Convergence Divergence (MACD) indicator is showing signs of weakening, suggesting continued consolidation unless a clear catalyst emerges.
US Dollar PRICE Today
The table below shows the percentage change of US Dollar (USD) against listed major currencies today. US Dollar was the strongest against the New Zealand Dollar.
| USD | EUR | GBP | JPY | CAD | AUD | NZD | CHF | |
|---|---|---|---|---|---|---|---|---|
| USD | -0.24% | -0.35% | -0.19% | -0.06% | -0.01% | 0.13% | -0.21% | |
| EUR | 0.24% | -0.04% | 0.05% | 0.16% | 0.19% | 0.18% | -0.01% | |
| GBP | 0.35% | 0.04% | -0.12% | 0.24% | 0.27% | 0.44% | 0.22% | |
| JPY | 0.19% | -0.05% | 0.12% | 0.13% | 0.22% | 0.27% | 0.14% | |
| CAD | 0.06% | -0.16% | -0.24% | -0.13% | 0.12% | 0.20% | -0.20% | |
| AUD | 0.00% | -0.19% | -0.27% | -0.22% | -0.12% | 0.07% | -0.05% | |
| NZD | -0.13% | -0.18% | -0.44% | -0.27% | -0.20% | -0.07% | -0.22% | |
| CHF | 0.21% | 0.01% | -0.22% | -0.14% | 0.20% | 0.05% | 0.22% |
The heat map shows percentage changes of major currencies against each other. The base currency is picked from the left column, while the quote currency is picked from the top row. For example, if you pick the US Dollar from the left column and move along the horizontal line to the Japanese Yen, the percentage change displayed in the box will represent USD (base)/JPY (quote).
추천 기사


