
US Dollar unable to hold on to momentum ahead of US CPI
- The US Dollar is on the backfoot on Tuesday as the US-China trade deal euphoria quickly dampens.
- Traders brace for US CPI while details remain sketchy on the US-China trade deal.
- The US Dollar Index slips back to 101.50 after failing to reclaim the 102.00 level.
The US Dollar Index (DXY), which tracks the performance of the US Dollar (USD) against six major currencies, corrects to near 101.50 in the European trading session on Tuesday. The partial paring back of Monday’s gains comes as traders become wary of the lack of detail on the recent trade deal between China and the United States (US). Besides slashing the tariffs, no forward dates or topics are set, raising questions on what has been discussed, similar to the UK-US trade deal from Thursday.
Meanwhile, on the economic data front, some dark clouds could form above the Greenback this Tuesday with the US Consumer Price Index (CPI) release for April. Markets expect an uptick in the monthly core and headline figures as US President Donald Trump’s ‘Liberation Day’ took place at the start of April. Overnight, Federal Reserve (Fed) Bank President of Chicago Austan Goolsbee warned that even current tariff levels will still have an inflationary impulse, the New York Times reported.
Daily digest market movers: Inflation risk hangover
- On Monday, President Trump lashed out at the European Union (EU), saying that the US has the upper hand in its trade discussions with the EU. "The European Union is in many ways nastier than China. We've just started with them. We have all the cards. They treated us very unfairly," Trump said at the White House.
- At 10:00 GMT, the National Federation of Independent Business (NFIB) released its Business Optimism Index for April. The actual number came in at 95.8 compared to the previous 97.4. The expectation was for a 94.5.
- At 12:30 GMT, the April US Consumer Price Index data will be released:
- Monthly headline CPI is expected to surge to 0.3%, from the disinflationary -0.1% in March. The yearly figure is set to remain stable at 2.4%.
- The Monthly core CPI is expected to tick up to 0.3%, from 0.1% in March. The yearly figure is set to remain unchanged at 2.8%.
- Equities see a very binary picture this Tuesday, with Japan being the final region where the trade deal euphoria materialised. Chinese equities cut off that euphoria and dipped nearly 2% at their closing bell. European equities are flat and looking for direction, while US Futures are facing less than 0.5% of losses before their opening bell.
- The CME FedWatch tool shows the chance of an interest rate cut by the Federal Reserve in June’s meeting at just 8.2%. Further ahead, the July 30 decision sees odds for rates being lower than current levels at 38.6%.
- The US 10-year yields trade around 4.45%, edging higher towards levels not seen since the beginning of April, and reducing rate cut bets for 2025.
US Dollar Index Technical Analysis: Rejection angst
Warning lights flashing this Tuesday for the US Dollar Index from a pure technical point of view. The fact that the DXY was unable to break 102.00 and closed below the important 101.90 technical level is opening up the door for a harsh retracement back to 100.00. The US CPI release later this Tuesday could be vital to either broaden the rejection with a weaker Greenback or push it firmly above 102.00.
On the upside, the DXY is flirting with a technical rejection against 101.90, which acted as a pivotal level throughout December 2023 and as a base for the inverted head-and-shoulders (H&S) formation during the summer of 2024. In case Dollar bulls push the DXY even higher, the 55-day Simple Moving Average (SMA) at 102.29 comes into play.
On the other hand, the previous resistance at 100.22 is acting as firm support, followed by 97.73 near the low of 2025. Further below, a relatively thin technical support comes in at 96.94 before looking at the lower levels of this new price range. These would be at 95.25 and 94.56, meaning fresh lows not seen since 2022.
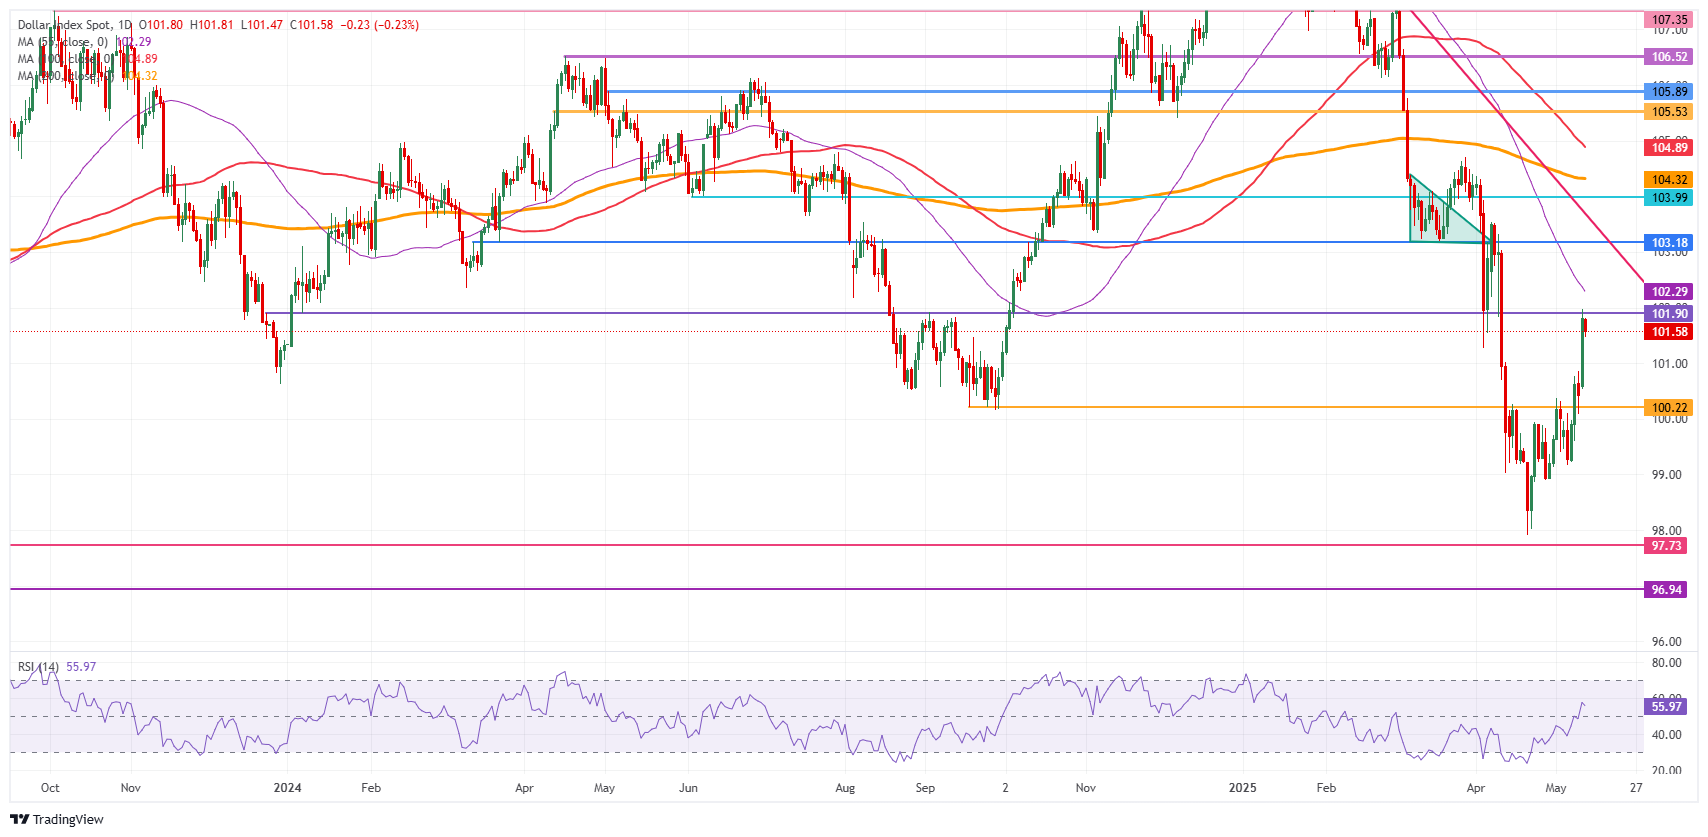
US Dollar Index: Daily Chart
US-China Trade War FAQs
Generally speaking, a trade war is an economic conflict between two or more countries due to extreme protectionism on one end. It implies the creation of trade barriers, such as tariffs, which result in counter-barriers, escalating import costs, and hence the cost of living.
An economic conflict between the United States (US) and China began early in 2018, when President Donald Trump set trade barriers on China, claiming unfair commercial practices and intellectual property theft from the Asian giant. China took retaliatory action, imposing tariffs on multiple US goods, such as automobiles and soybeans. Tensions escalated until the two countries signed the US-China Phase One trade deal in January 2020. The agreement required structural reforms and other changes to China’s economic and trade regime and pretended to restore stability and trust between the two nations. However, the Coronavirus pandemic took the focus out of the conflict. Yet, it is worth mentioning that President Joe Biden, who took office after Trump, kept tariffs in place and even added some additional levies.
The return of Donald Trump to the White House as the 47th US President has sparked a fresh wave of tensions between the two countries. During the 2024 election campaign, Trump pledged to impose 60% tariffs on China once he returned to office, which he did on January 20, 2025. With Trump back, the US-China trade war is meant to resume where it was left, with tit-for-tat policies affecting the global economic landscape amid disruptions in global supply chains, resulting in a reduction in spending, particularly investment, and directly feeding into the Consumer Price Index inflation.
추천 기사


