
Is the Altcoin season back? Exploring Bitcoin dominance and the altcoins market's golden cross
- Altcoin season shows signs of a major comeback as the altcoins market capitalization chart flashes the first golden cross in four years.
- Bitcoin dominance slumps to 63% on Tuesday from the May 7 peak of 65%, hinting at growing capital rotation.
- Ethereum's strong bullish comeback could attract retail investors as interest in altcoins grows.
The altcoin market has become difficult to navigate during Bitcoin's (BTC) bull cycle, with fragmented narratives, isolated rallies, liquidity crunches and colossal token unlocks. However, in recent weeks, the altcoin market has signalled the potential for a major turnaround, accentuated by a sharp drop in the Bitcoin dominance.
A recent K33 Research report states, "a broad-based altseason is unlikely for now, as capital is concentrating into selective winners rather than lifting all tokens indiscriminately." In other words, select crypto projects could rally extensively. At the same time, altcoins that do not exemplify real-world utility and market fit products or even those that fail to attract users could miss the altcoin season.
Altcoin season looms as golden cross signals a potential rally
Altcoin season refers to a period in the crypto market when alternative cryptocurrencies (altcoins) outperform Bitcoin, supported by prominent rallies across the board. The altcoin season begins when 75% of the top 50 coins, excluding stablecoins and asset-backed tokens, outperform Bitcoin over 90 days. According to Blockchaincenter.net, just 10 of the top 50 cryptocurrencies have outperformed Bitcoin over the past 90 days. This indicates that while early signs of an altcoin season are emerging, a full-fledged rally is likely still some way off.
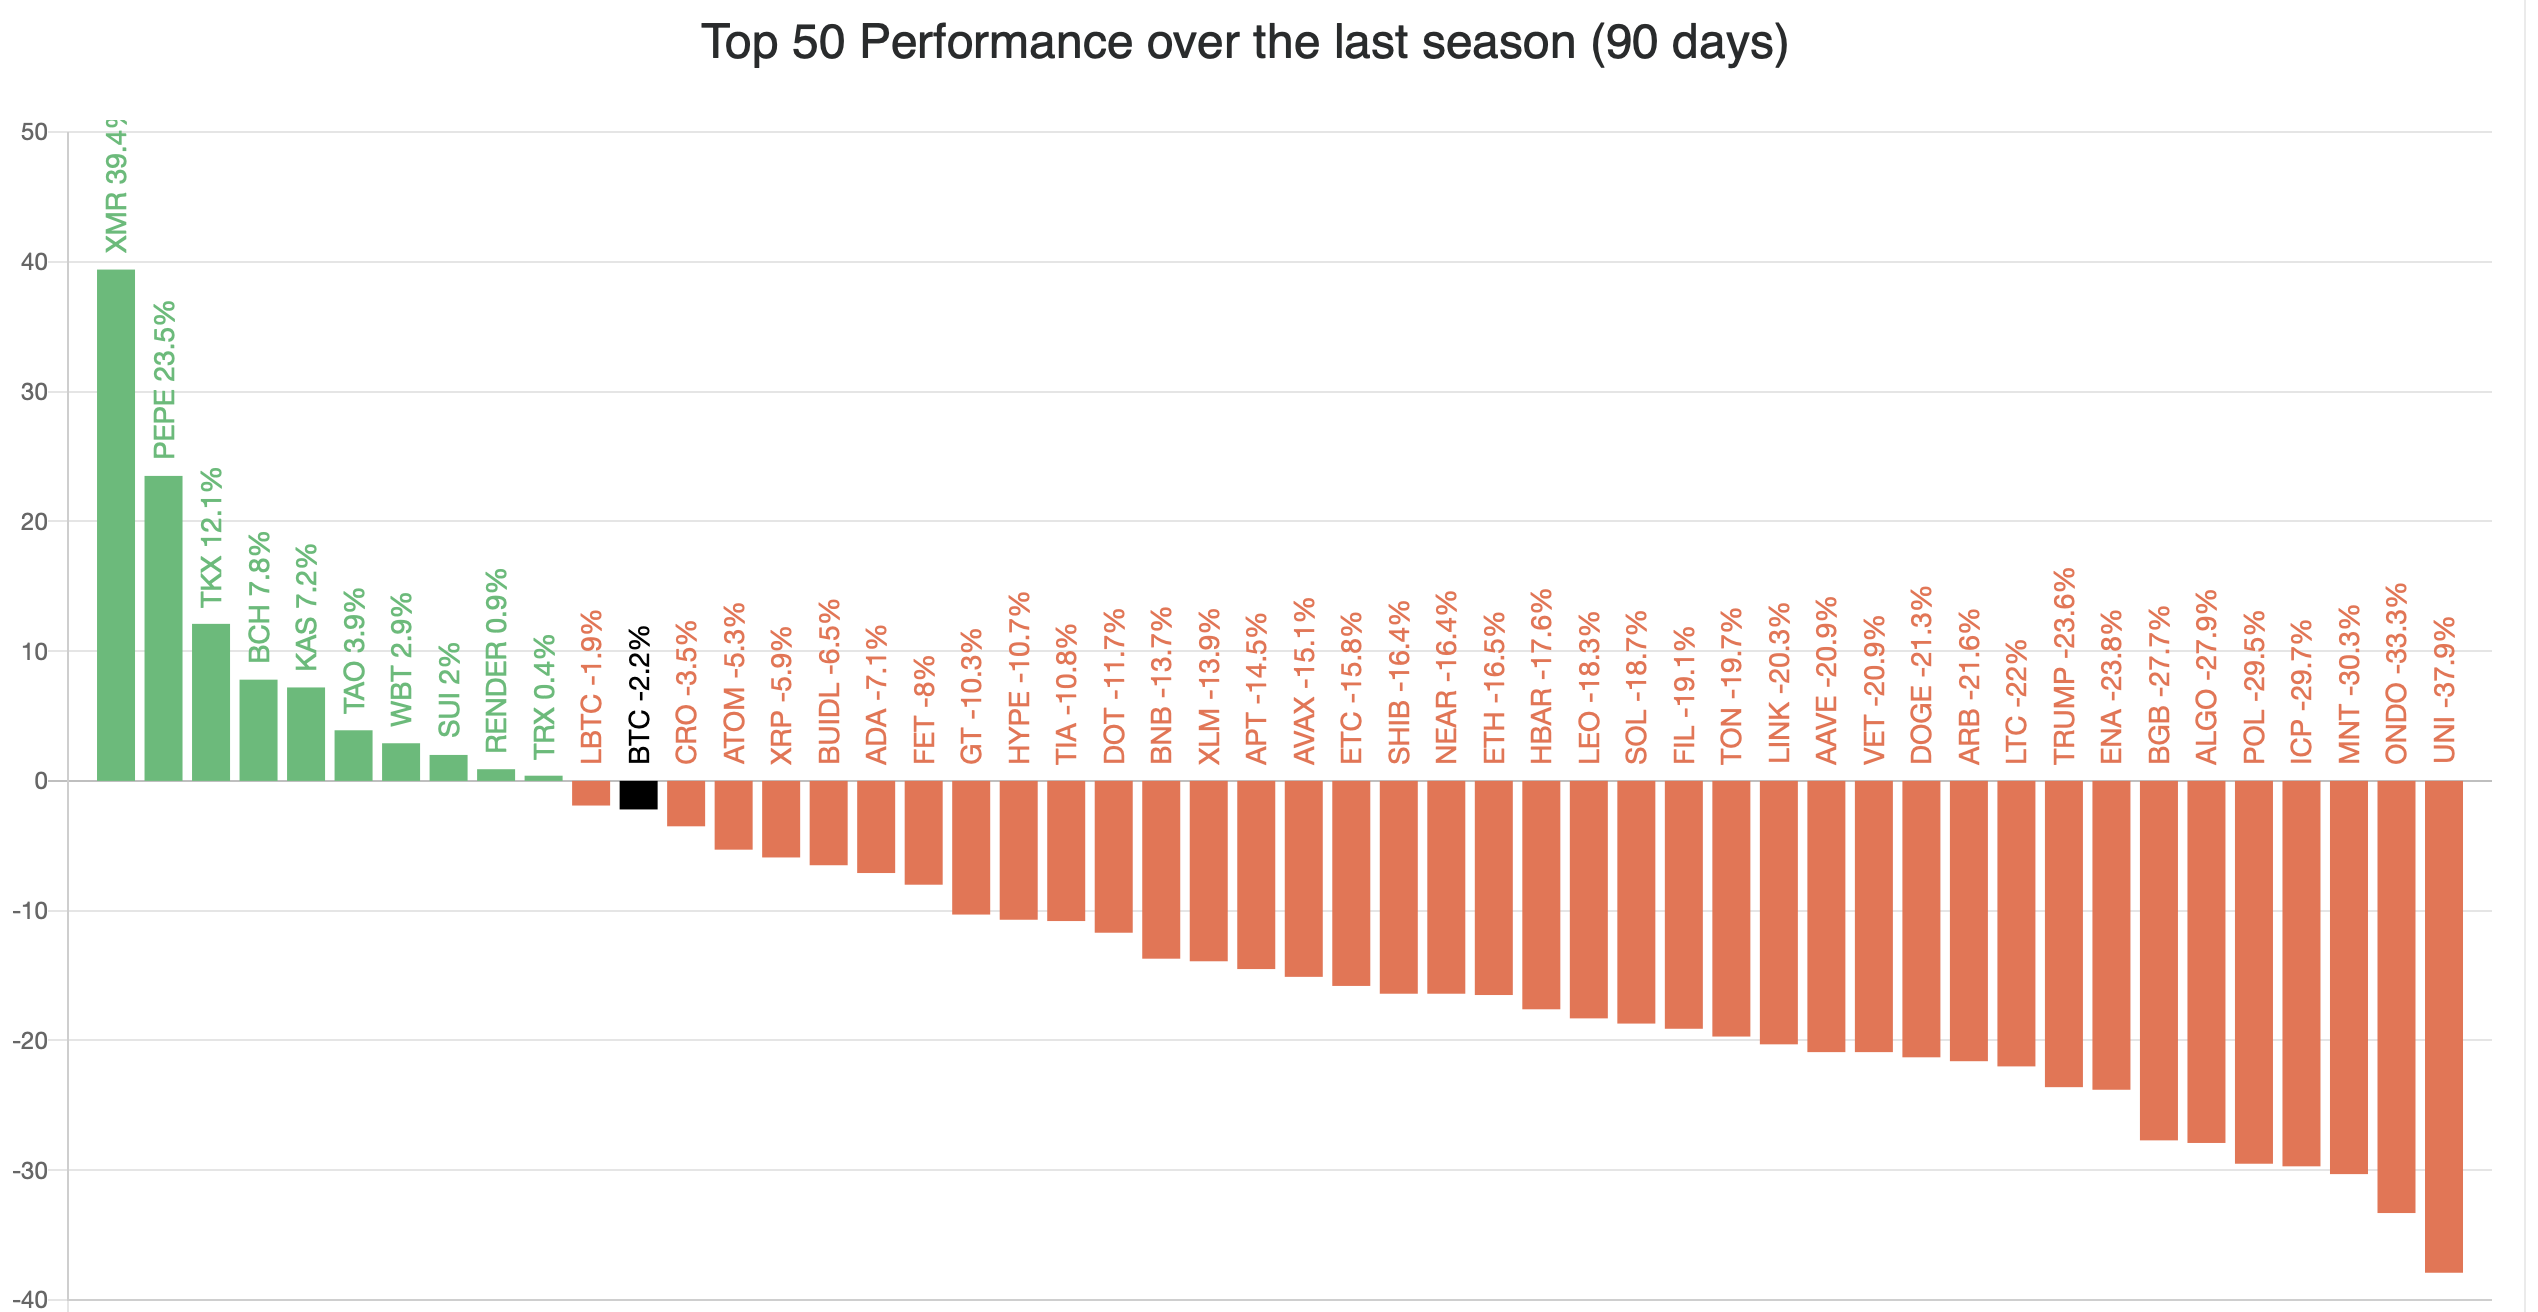
Top 50 coins performance over 90 days | Source: blockchaincenter.net
Based on the altcoin market capitalization chart, a golden cross pattern is coming into play, exacerbating the dream for a full-fledged altcoin season. This pattern occurs when a short-term moving average, for example, 50-day, crosses above a long-term moving average, such as the 200-day, thus signaling a high probability of the market moving into a substantial uptrend.
As observed on the chart below shared by crypto analyst and investor OxNobler on X, a golden cross is coming into play for the first time since 2021. Following the pattern, altcoins experienced broad-based rallies, with the altcoin market capitalization springing up to $1.67 trillion from slightly below $150 billion. If history repeats, the golden cross could usher in a major rally across the altcoin market for the first time in four years.
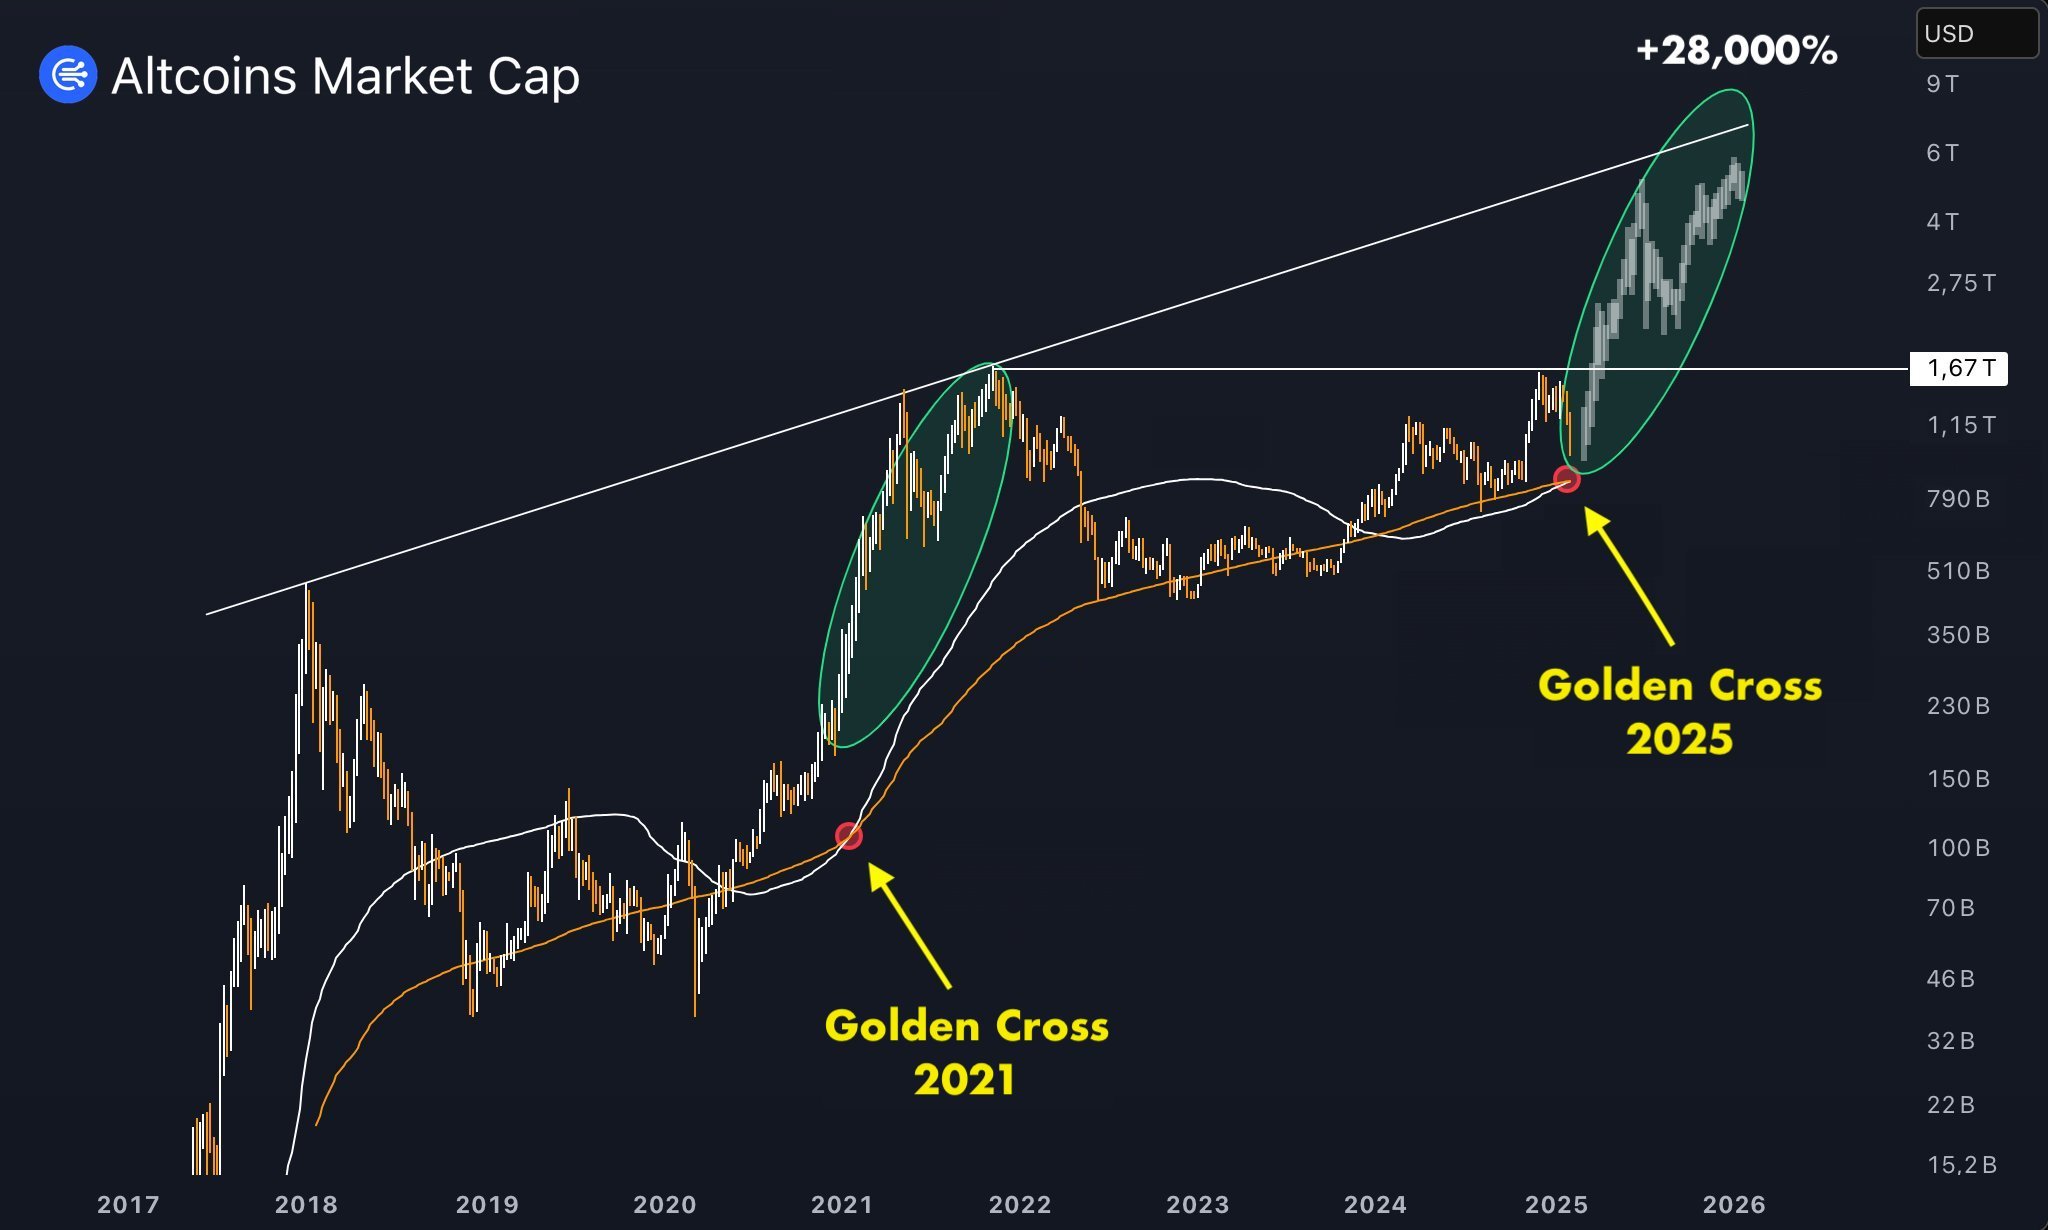
Altcoins market cap | Source: OxNobler
Bitcoin dominance slides as altcoins wake up
Bitcoin's price has sustained strong bullish momentum since the April 7 tariff-triggered crash low of $74,508 to $105,819 on Monday, demonstrating renewed strength driven by macro tailwinds, including easing trade and tariff tensions, and the dovish Federal Reserve's (Fed) stance on the policy informing decisions on interest rates. The bounce back aligns with broader risk-on sentiment that has seen Bitcoin outperform equities.
"Capital rotation into Bitcoin appears sustained, as reflected in the realised cap, reaching a new all-time high and ETF inflows exceeding $920 million over the past two weeks. On-chain data also confirms a significant drop in coins held at a loss, with over 3 million BTC returning to profit," the latest Bitfinex Alpha report stated.
Bitcoin upholds a solid technical structure, reinforced by surging spot Exchange Traded Funds (ETFs) inflows and institutional interest. Short-term drawbacks will likely be absorbed quickly as investors buy the dip, potentially resulting in a sustained leg up to fresh highs.
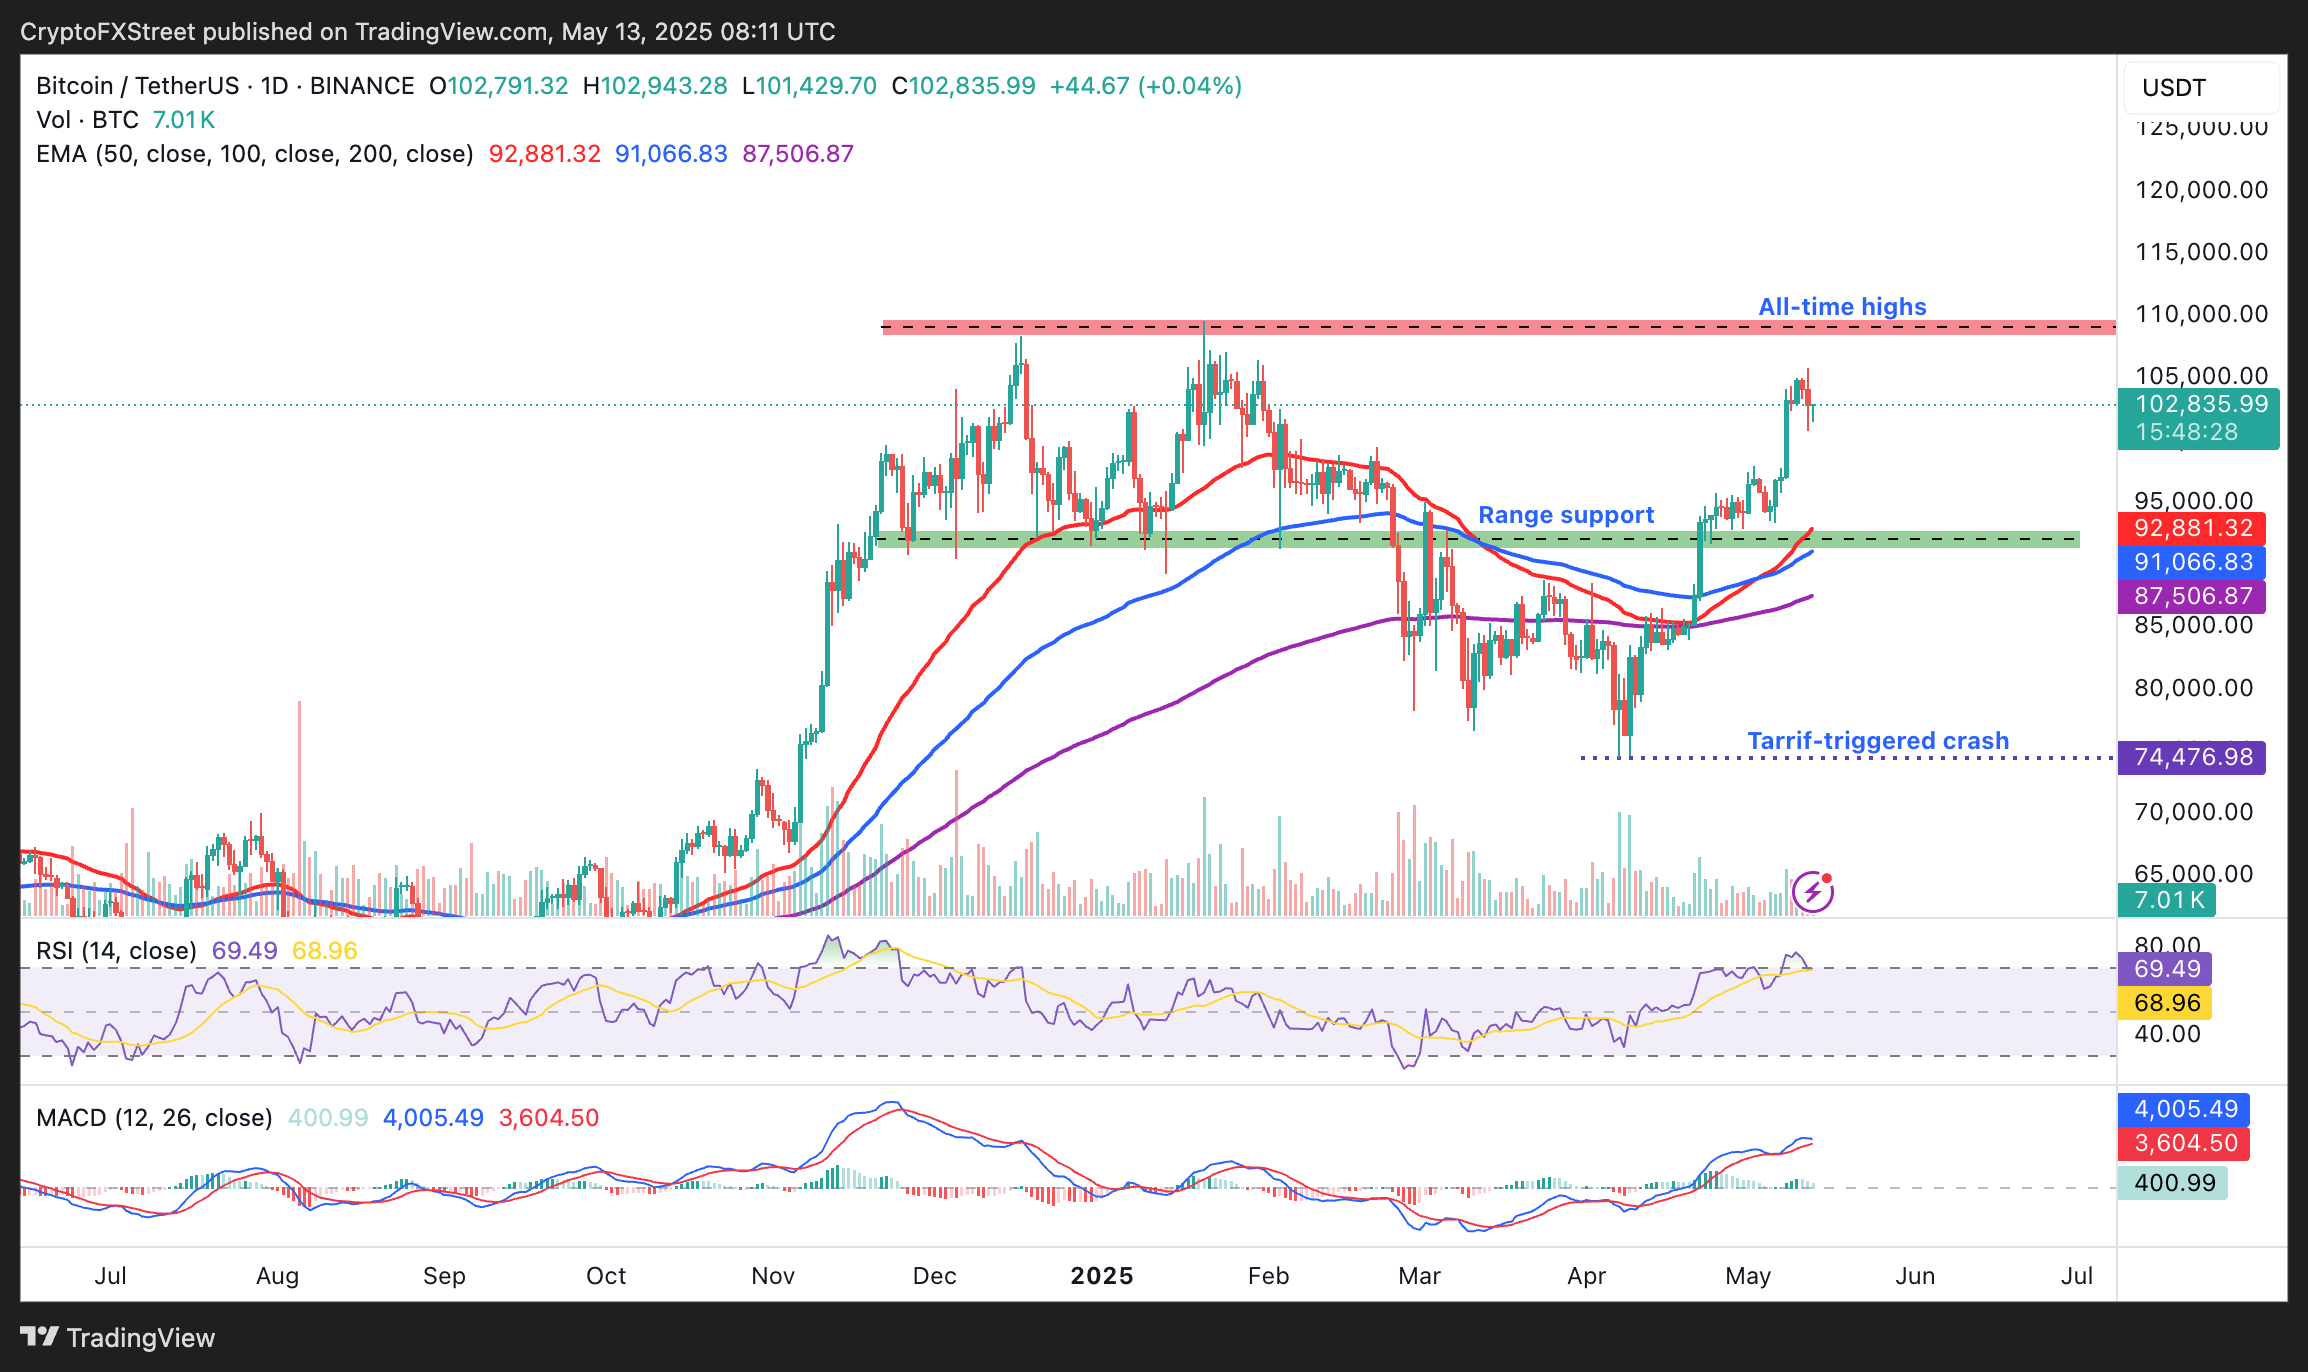
BTC/USDT daily chart
Meanwhile, Bitcoin dominance (BTC.D), representing BTC's market capitalization as a percentage of the total crypto market cap, sharply dropped to 62.2% from the May 7 peak of 65.37%. The decline occurred following a market-wide rally on risk-on sentiment due to progressive trade talks between the United States (US) and China.
A decline in Bitcoin dominance often signals an altcoin season because capital flows from BTC into altcoins. The capital rotation, in turn, drives altcoin rallies. In 2021, Bitcoin dominance peaked at 73.62% before correcting, boosting altcoin rallies. As BTC.D expands, the buzz across the market is that a reversal could be imminent, with the altcoin season likely to start thereafter.
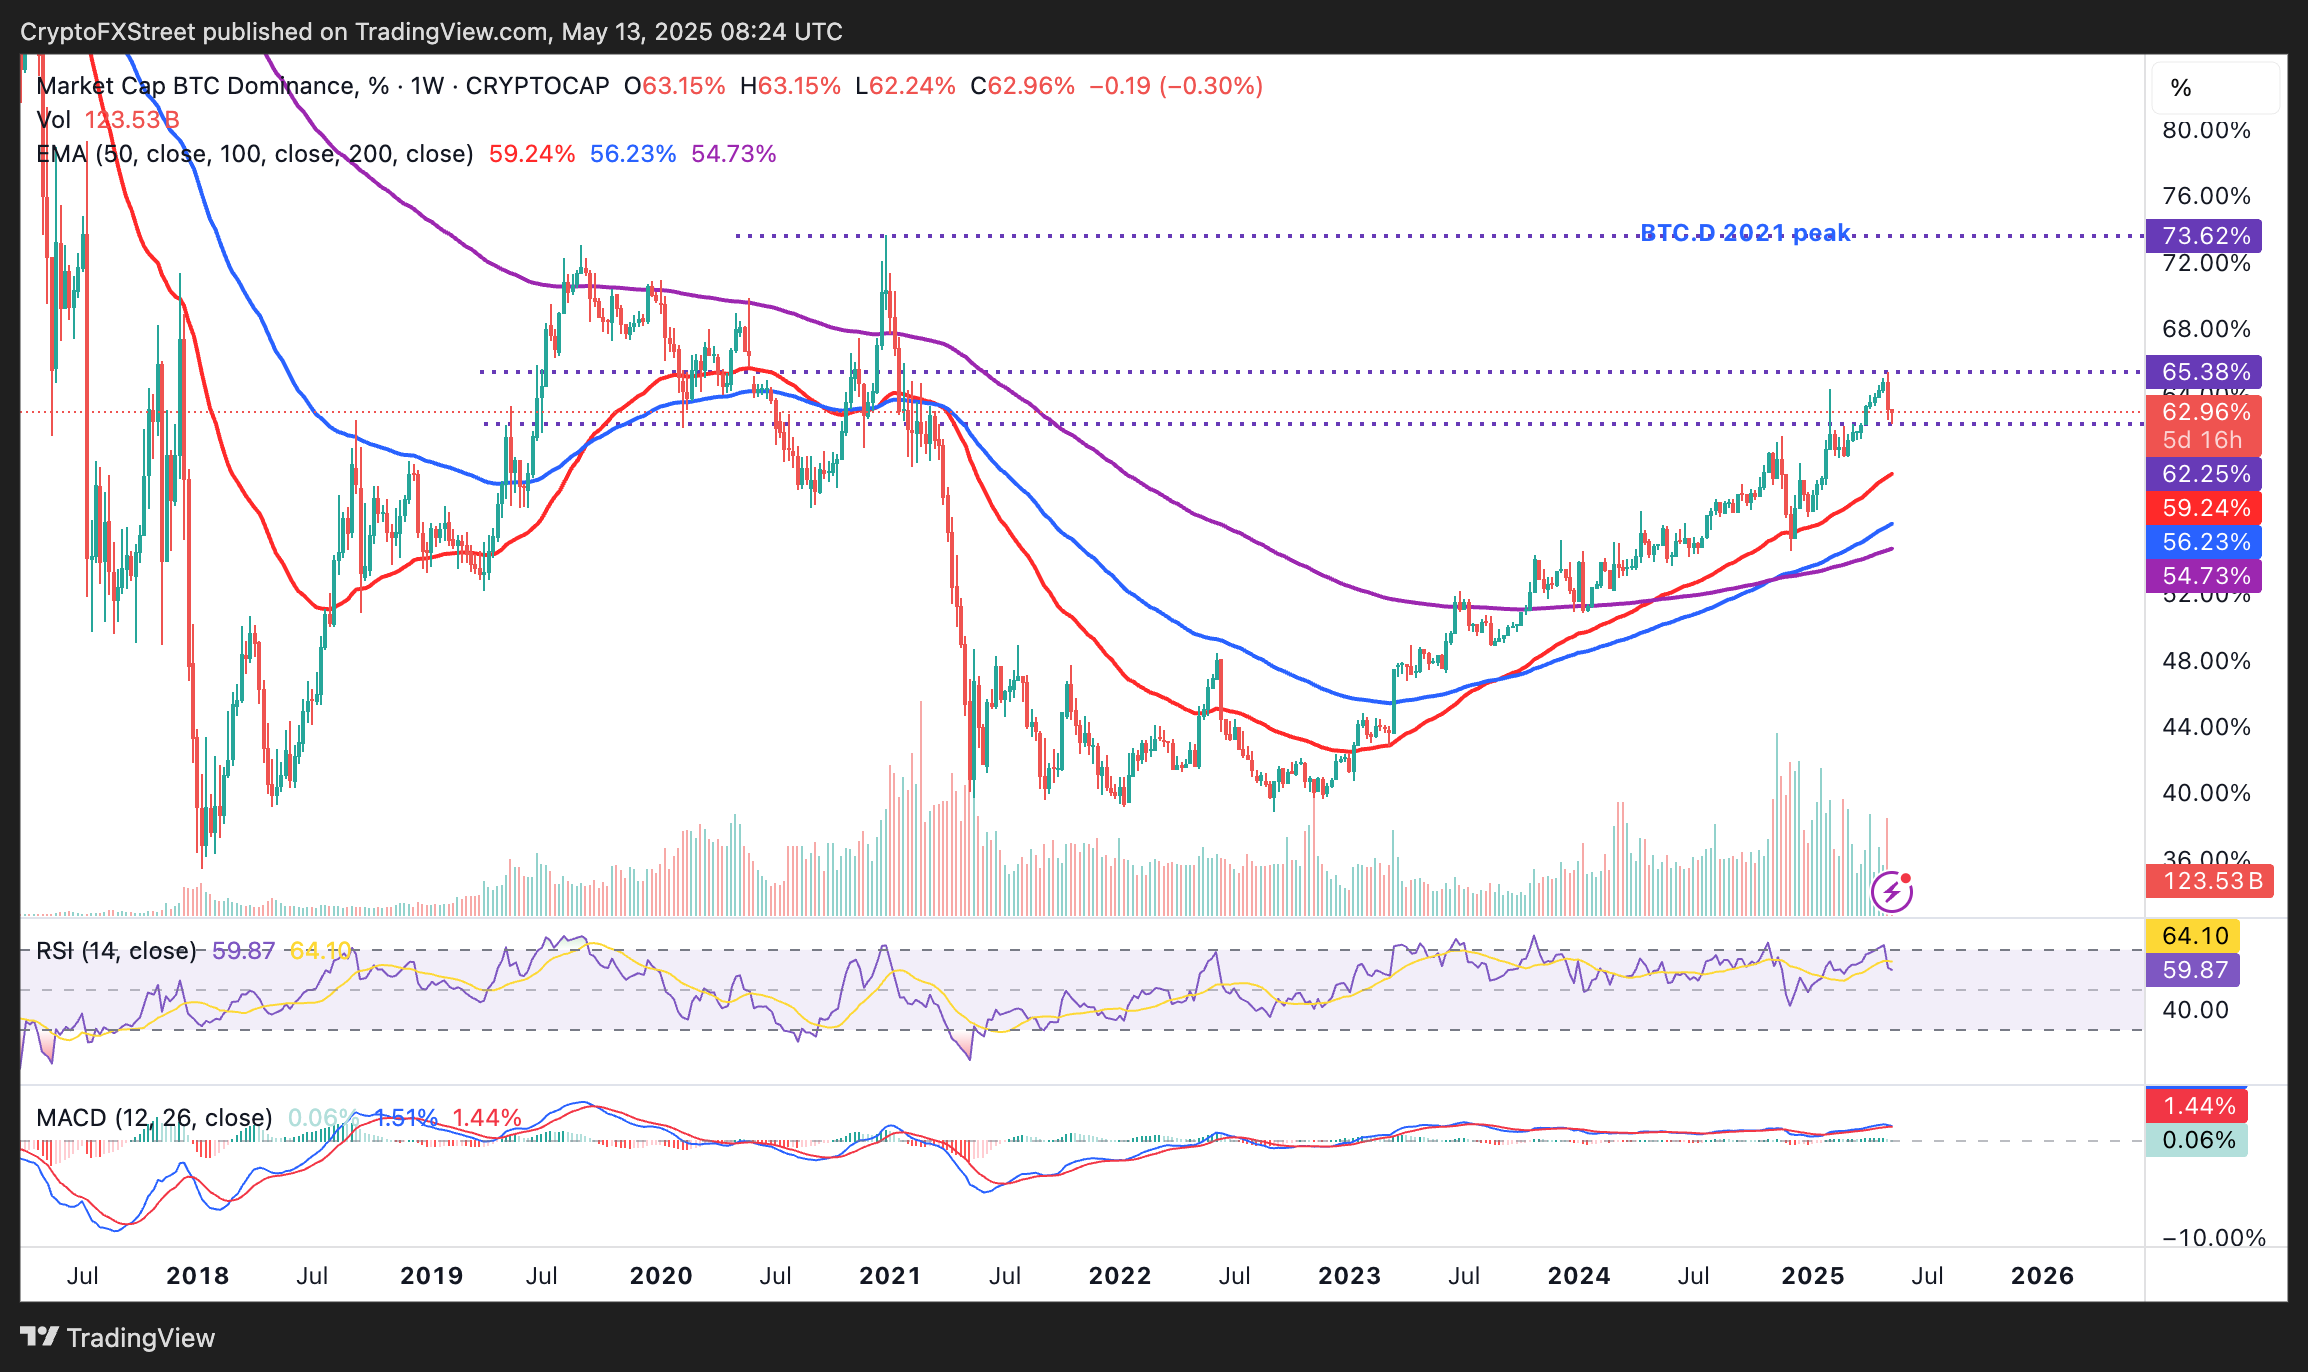
BTC.D weekly chart
Ethereum price comeback could accelerate altcoin season
The ETH/BTC ratio has persistently plummeted from the December 2022 peak of 0.0881, reflecting a heavy altcoin market compared to the strong tailwinds on Bitcoin. Historically, this trading pair has been viewed as a bellwether indicator for altcoins' performance, with a persistent downtrend suggesting that widespread rallies in altcoins are a pipe dream, at least in the short term.
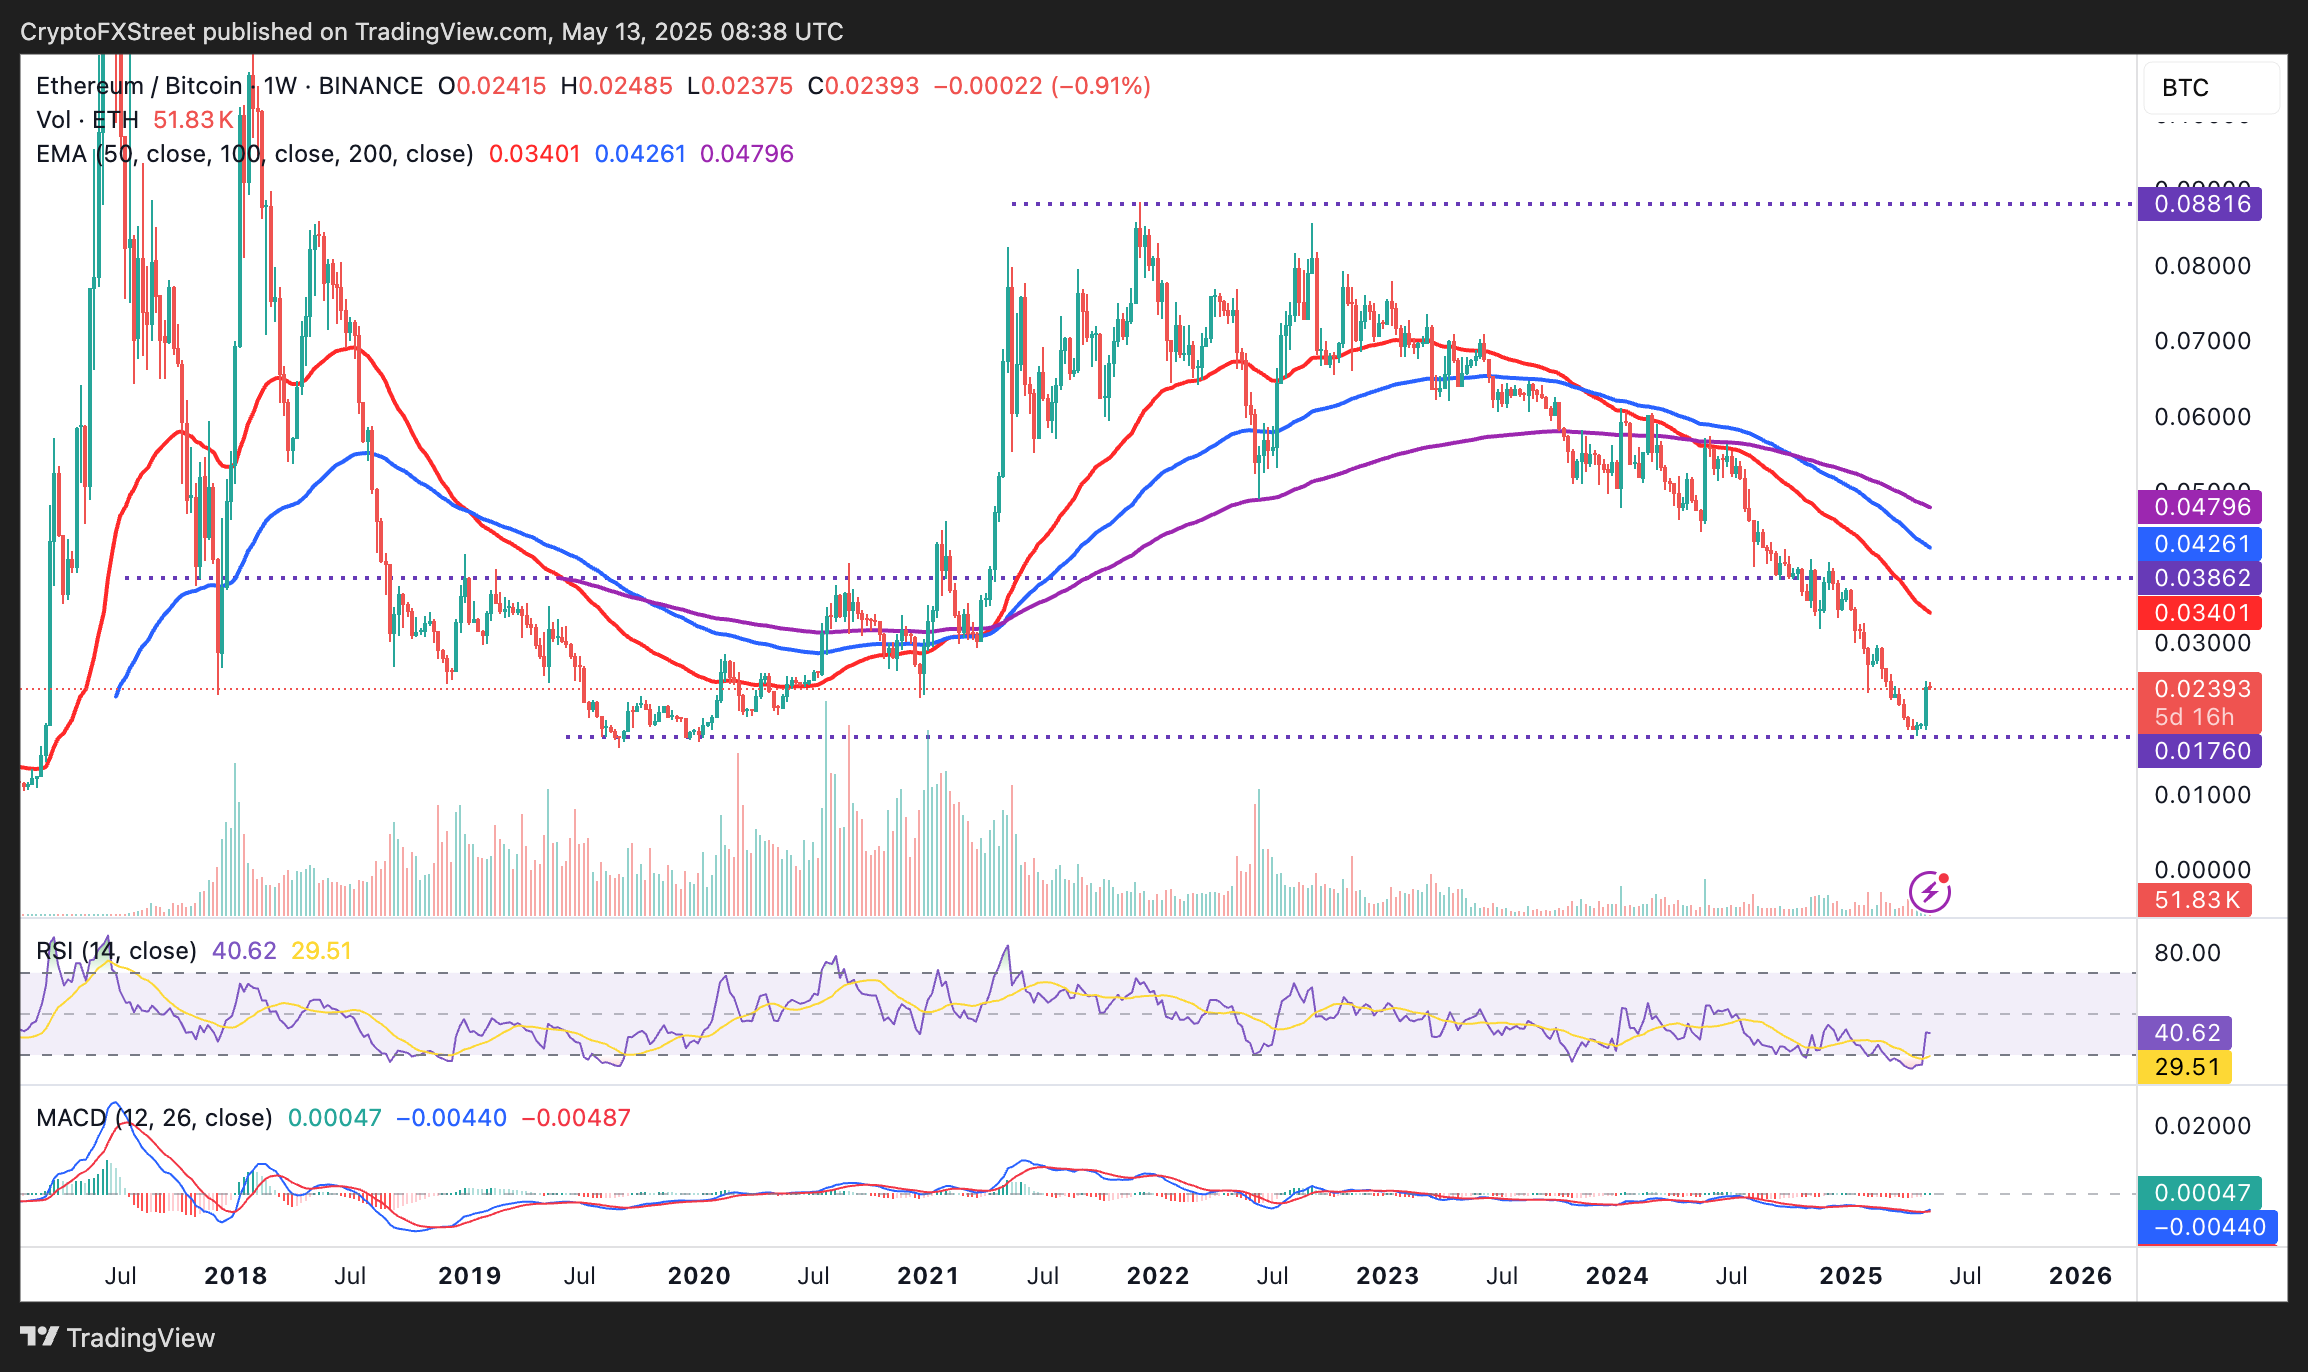
ETH/BTC weekly chart
However, a massive rally in Ethereum (ETH) from the April 7 low of $1,385 to highs around $2,621 triggered a reversal in the ETH/BTC trading pair after testing 0.0176, a level last tested in December 2019. The ratio currently stands at 0.0239, reflecting a 26.4% increase, portraying Ethereum's growing strength relative to Bitcoin.
Meanwhile, ETH/USD exchanges hands at $2,460 at the time of writing, reflecting changing dynamics in the market and the need for traders to respond to price movements and developments in the broader market with speed and accuracy.
Cryptocurrency prices FAQs
Token launches influence demand and adoption among market participants. Listings on crypto exchanges deepen the liquidity for an asset and add new participants to an asset’s network. This is typically bullish for a digital asset.
A hack is an event in which an attacker captures a large volume of the asset from a DeFi bridge or hot wallet of an exchange or any other crypto platform via exploits, bugs or other methods. The exploiter then transfers these tokens out of the exchange platforms to ultimately sell or swap the assets for other cryptocurrencies or stablecoins. Such events often involve an en masse panic triggering a sell-off in the affected assets.
Macroeconomic events like the US Federal Reserve’s decision on interest rates influence crypto assets mainly through the direct impact they have on the US Dollar. An increase in interest rate typically negatively influences Bitcoin and altcoin prices, and vice versa. If the US Dollar index declines, risk assets and associated leverage for trading gets cheaper, in turn driving crypto prices higher.
Halvings are typically considered bullish events as they slash the block reward in half for miners, constricting the supply of the asset. At consistent demand if the supply reduces, the asset’s price climbs.
추천 기사


