

Dow Jones Industrial Average recovers footing on Monday
- The Dow Jones recovered ground on Monday, climbing back to 42,500.
- Equities are broadly gaining ground as investors hope for easing tariff pressures.
- Economic concerns and inflation fears continue to simmer away as data comes in mixed.
The Dow Jones Industrial Average (DJIA) pared recent losses on Monday, climbing back to the 42,500 region as investors hope for more signs that the Trump administration will cave on its own high-tension tariff threats. United States (US) Purchasing Managers Index (PMI) survey results came in mixed for March as industry sectors grapple with an uneasy trade stance.
US equity indexes are broadly higher to kick off the new trading week. The Dow Jones gained around 600 points, adding 1.4% on the day. The Standard & Poor’s 500 (S&P) rose 100 points, gaining 1.7%, and the NASDAQ tech index rallied 400 points to climb 2.2%.
US President Donald Trump hit the ground running on Monday, reiterating his common tariff threats that are slated to kick off April with a wide array of “reciprocal” tariffs. Donald Trump followed his own statements up later in the day, teasing the potential for tariff exemptions as the Trump administration goes for another spin around the now-familiar wheel of tariffs-on, tariffs-off.
US Manufacturing PMI survey results sank faster than expected in March as tariff threats take a bite out of the physical production outlook. The Manufacturing PMI for March sank to a three-month low of 49.8, slipping back into economic contraction territory as businesses grow increasingly worried about the economic landscape. The Services PMI came in better than expected, rising to 54.3, it’s own three-month high as services operators expect to be able to fully pass on tariff cost increases to consumers.
Stocks news
Tesla (TSLA) rallied on Monday, recovering a solid 11.5% to $277 per share as the battered EV maker pares recent losses. It may develop into a dead cat bounce, however: Tesla remains down 37% from the year’s peak near $440. Despite the near-term recovery, Tesla remains steeply overvalued, and the electric car producer is still trading at a P/E ratio of nearly 122.0.
Read more stock news: Boeing holds onto gains from last week
Dow Jones price forecast
Monday’s Dow Jones rally came at the perfect time for equity bulls, sending the major equity index back above the 200-day Exponential Moving Average (EMA) near the 42,000 key handle. The Dow Jones is still stuck trading below the 50-day EMA near 43,000, but the DJIA has recovered nearly 5% from its latest swing low below 40,700.
Dow Jones daily chart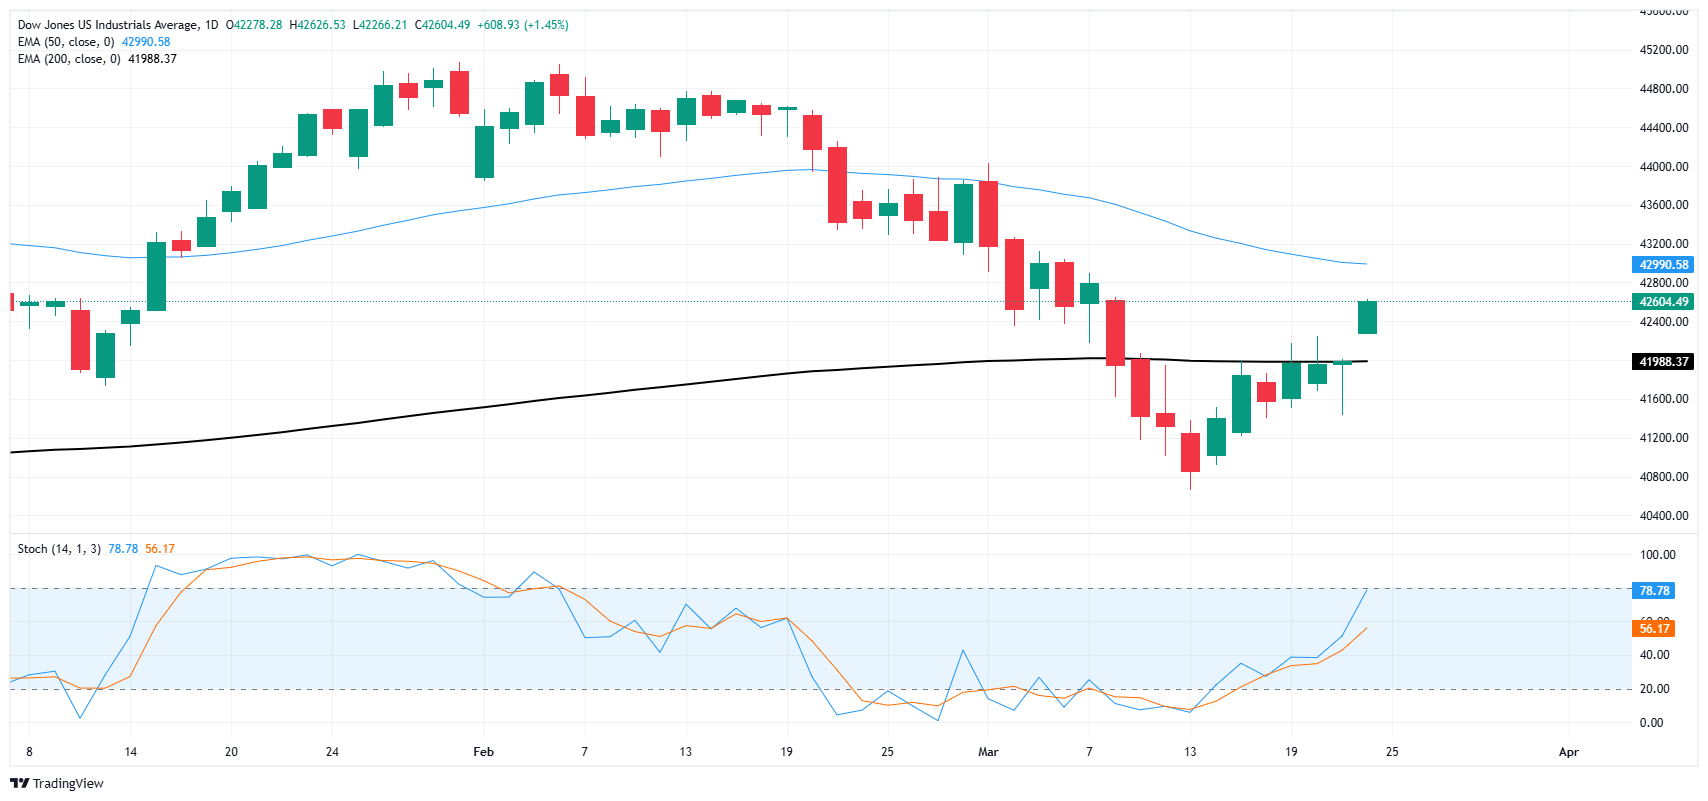
Dow Jones FAQs
The Dow Jones Industrial Average, one of the oldest stock market indices in the world, is compiled of the 30 most traded stocks in the US. The index is price-weighted rather than weighted by capitalization. It is calculated by summing the prices of the constituent stocks and dividing them by a factor, currently 0.152. The index was founded by Charles Dow, who also founded the Wall Street Journal. In later years it has been criticized for not being broadly representative enough because it only tracks 30 conglomerates, unlike broader indices such as the S&P 500.
Many different factors drive the Dow Jones Industrial Average (DJIA). The aggregate performance of the component companies revealed in quarterly company earnings reports is the main one. US and global macroeconomic data also contributes as it impacts on investor sentiment. The level of interest rates, set by the Federal Reserve (Fed), also influences the DJIA as it affects the cost of credit, on which many corporations are heavily reliant. Therefore, inflation can be a major driver as well as other metrics which impact the Fed decisions.
Dow Theory is a method for identifying the primary trend of the stock market developed by Charles Dow. A key step is to compare the direction of the Dow Jones Industrial Average (DJIA) and the Dow Jones Transportation Average (DJTA) and only follow trends where both are moving in the same direction. Volume is a confirmatory criteria. The theory uses elements of peak and trough analysis. Dow’s theory posits three trend phases: accumulation, when smart money starts buying or selling; public participation, when the wider public joins in; and distribution, when the smart money exits.
There are a number of ways to trade the DJIA. One is to use ETFs which allow investors to trade the DJIA as a single security, rather than having to buy shares in all 30 constituent companies. A leading example is the SPDR Dow Jones Industrial Average ETF (DIA). DJIA futures contracts enable traders to speculate on the future value of the index and Options provide the right, but not the obligation, to buy or sell the index at a predetermined price in the future. Mutual funds enable investors to buy a share of a diversified portfolio of DJIA stocks thus providing exposure to the overall index.
추천 기사


