

Dow Jones Industrial Average finds footing on Tuesday
- The Dow Jones held steady on Tuesday, treading water near 42,000.
- Geopolitical market tensions eased after the US discouraged an Israeli escalation against Iran.
- Investors are now grappling with lower rate cut expectations after last week’s labor print.
The Dow Jones Industrial Average (DJIA) churned on Tuesday, digging in near the 42,000 handle as markets chew on factors pulling investor expectations in multiple directions. Investor concerns about the Israel-Iran ramp-up eased early Tuesday after the US verbally intervened in the still-broiling Middle East conflict. Risk appetite recovered footing on the news, but investor sentiment remains tepid as traders grapple with a muggier outlook on Federal Reserve (Fed) rate cuts for the rest of the year.
US President Joe Biden stepped in to directly warn Israel that a direct retaliatory attack against Iran would be unwise, helping to blow off some of the building pressure and prevent the Middle East conflict from bubbling over into into further neighboring countries. Iran launched a retaliatory strike against Israel this weekend in response to Israel’s invasion of Lebanon.
Rate markets continue to overwhelmingly bet on a single quarter-point rate cut from the Fed in November. According to the CME’s FedWatch Tool, rate markets see nearly 90% odds that the Fed will follow up September’s jumbo 50 bps rate cut with a more modest 25 bps on November 7. Markets were pushed back on hopes for a second double-cut after US labor data printed well above expectations last week. Fed officials widely telegraphed that a weakening in the US labor market would be required to push the Federal Reserve into further outsized rate trims.
Dow Jones news
A little over half of the Dow Jones’ listed stocks are in the green on Tuesday, but overall gains remain thin as higher ground is spread evenly amongst several sectors. Caterpillar (CAT) fell back 2.5% to $388 per share after China failed to announce further construction-supporting subsidies, and Travelers Companies rose 1.75% to $230 per share in a thin recovery from Monday’s -2.4% plunge.
Dow Jones price forecast
Despite a bearish start to the trading week, the Dow Jones continues to trade north of the 50-day Exponential Moving Average (EMA) near 41,220. The major equity index has bounced off of the 50-day EMA several times in recent months as a bullish uptrend holds steady.
The MACD has been flashing bearish warnings as the Dow Jones trades deep into bull country, but downside momentum remains limited as indexes continue to lean into the high end.
Dow Jones daily chart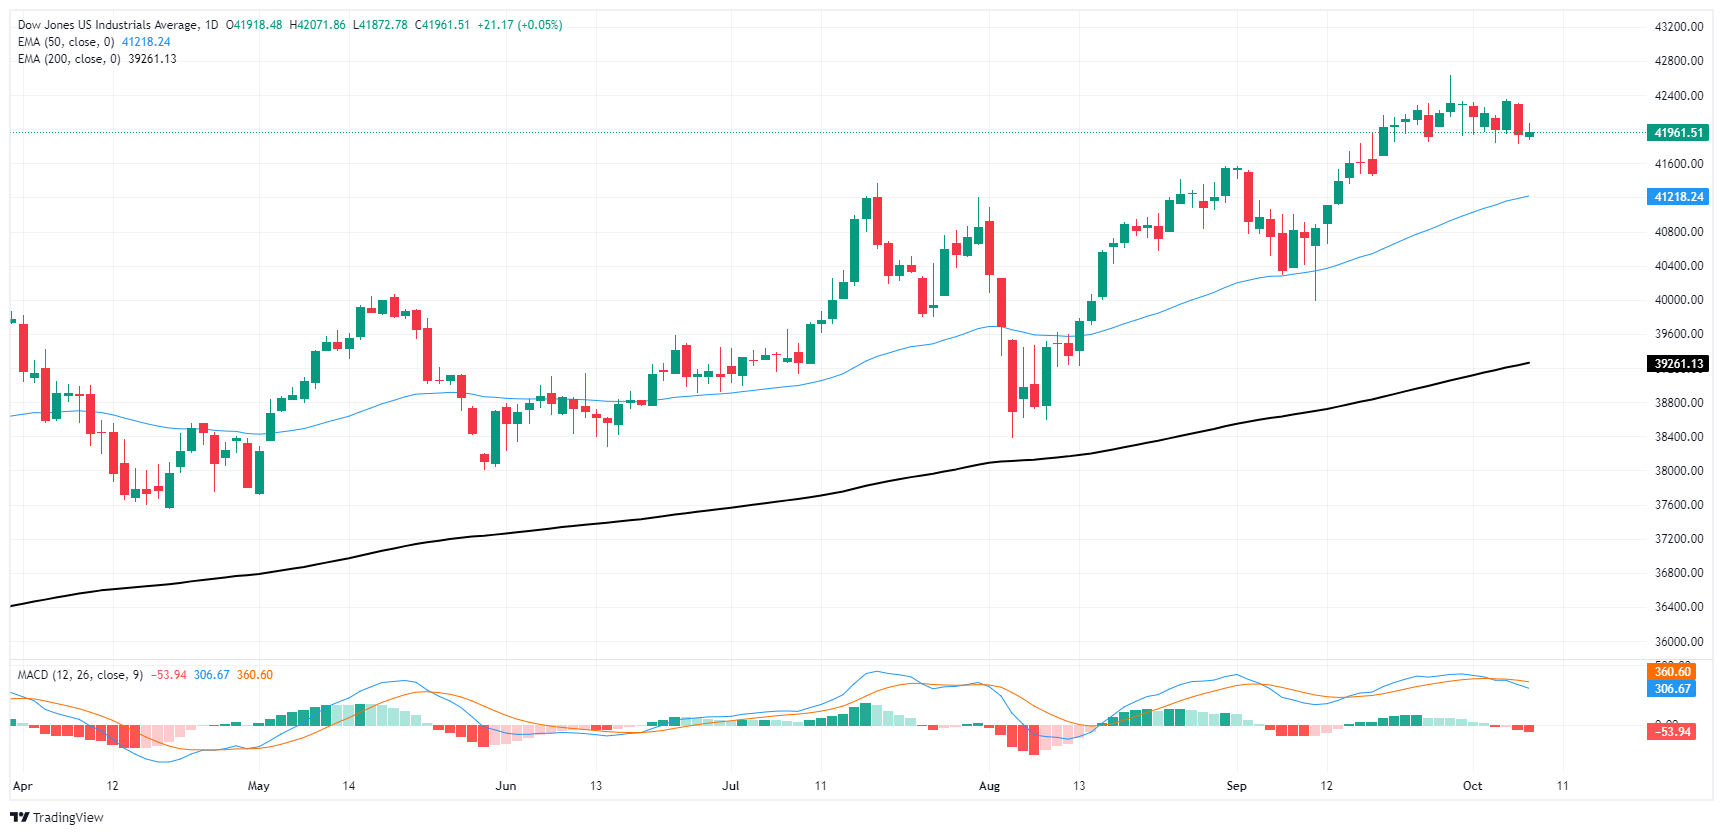
Dow Jones FAQs
The Dow Jones Industrial Average, one of the oldest stock market indices in the world, is compiled of the 30 most traded stocks in the US. The index is price-weighted rather than weighted by capitalization. It is calculated by summing the prices of the constituent stocks and dividing them by a factor, currently 0.152. The index was founded by Charles Dow, who also founded the Wall Street Journal. In later years it has been criticized for not being broadly representative enough because it only tracks 30 conglomerates, unlike broader indices such as the S&P 500.
Many different factors drive the Dow Jones Industrial Average (DJIA). The aggregate performance of the component companies revealed in quarterly company earnings reports is the main one. US and global macroeconomic data also contributes as it impacts on investor sentiment. The level of interest rates, set by the Federal Reserve (Fed), also influences the DJIA as it affects the cost of credit, on which many corporations are heavily reliant. Therefore, inflation can be a major driver as well as other metrics which impact the Fed decisions.
Dow Theory is a method for identifying the primary trend of the stock market developed by Charles Dow. A key step is to compare the direction of the Dow Jones Industrial Average (DJIA) and the Dow Jones Transportation Average (DJTA) and only follow trends where both are moving in the same direction. Volume is a confirmatory criteria. The theory uses elements of peak and trough analysis. Dow’s theory posits three trend phases: accumulation, when smart money starts buying or selling; public participation, when the wider public joins in; and distribution, when the smart money exits.
There are a number of ways to trade the DJIA. One is to use ETFs which allow investors to trade the DJIA as a single security, rather than having to buy shares in all 30 constituent companies. A leading example is the SPDR Dow Jones Industrial Average ETF (DIA). DJIA futures contracts enable traders to speculate on the future value of the index and Options provide the right, but not the obligation, to buy or sell the index at a predetermined price in the future. Mutual funds enable investors to buy a share of a diversified portfolio of DJIA stocks thus providing exposure to the overall index.
추천 기사


