


United States Dollar Index edges higher ahead of US CPI data
- The US Dollar turns slightly positive after recovering early losses ahead of the US CPI release.
- Financial markets see the US headline CPI arriving higher at 3.6% YoY in September.
- Almost every Fed member has warned of upside inflation risks since the September policy outcome.
The US Dollar (USD) claws back its early losses and ticks higher ahead of the United States (US) Consumer Price Index (CPI) data for September releasing at 12:30 GMT.
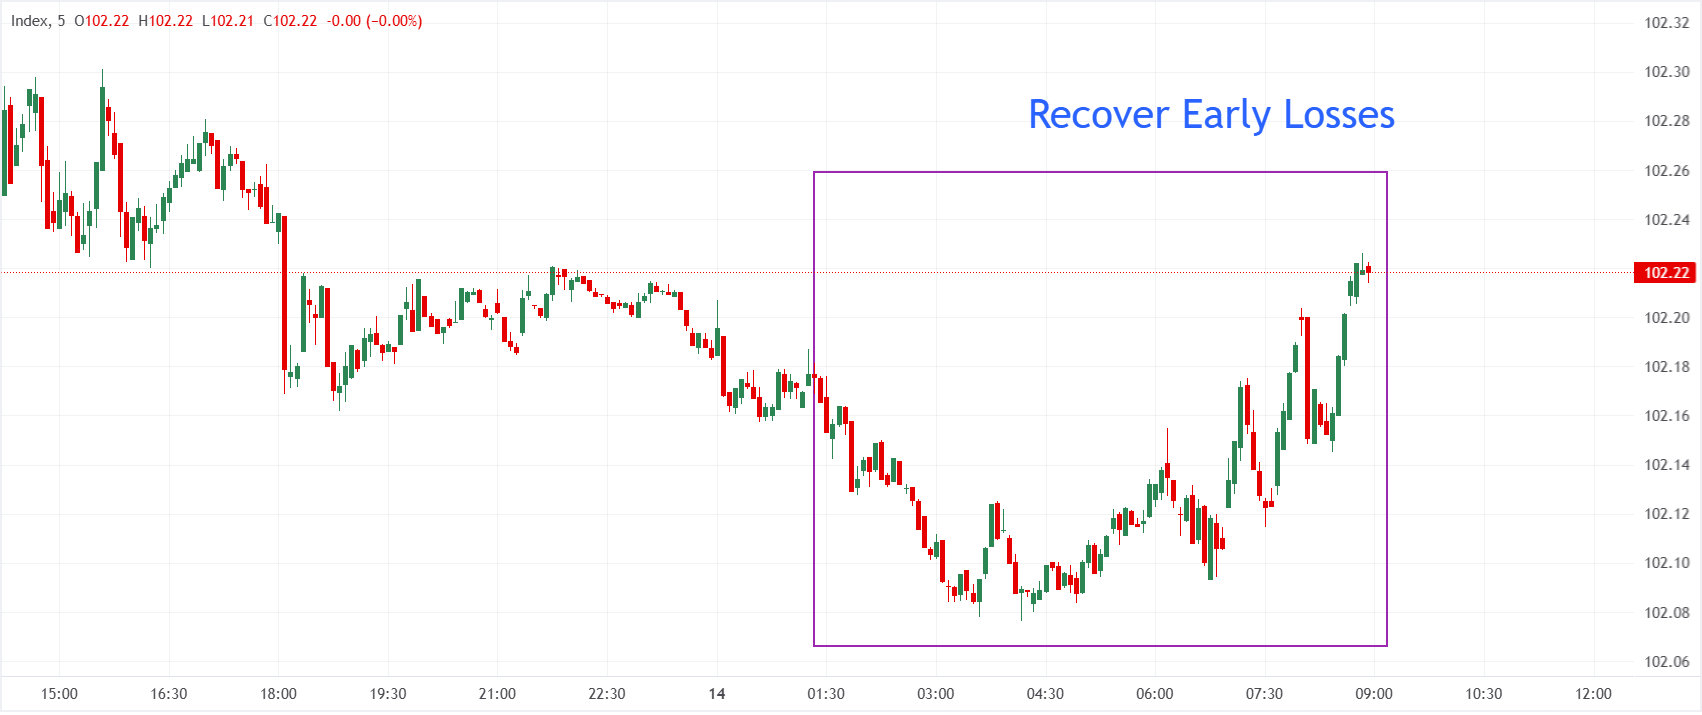
In the European trade, the US Dollar Index (DXY), which tracks the Greenback’s value against six major currencies, trades marginally higher to near 102.24.
US inflation preview highlights divergence between headline and core
Analysts at Rabobank preview the US September CPI release, noting that "headline CPI is expected to accelerate to 3.6% y/y and 0.6% m/m from 3.4% y/y and 0.4% m/m prior." In contrast, they expect underlying price pressures to ease, with "core CPI inflation expected at 2.5% y/y and 0.2% m/m from 2.45% y/y and 0.29% m/m," adding that "energy [is] likely to account for the divergence between headline and core expectations."
Investors will pay close attention to the US inflation data to get fresh cues regarding the Federal Reserve’s (Fed) interest rate outlook. Several policymakers have argued about persistent inflation risks and have indicated that both energy supply risks and Artificial Intelligence (AI)-driven demand are boosting price pressures.
Regarding the likely impact of the US CPI data on Fed’s interest rate expectations, strategists as OCBC have said in a note “If core inflation moderates as expected, markets could further trim expectations for additional Fed tightening.” OCBC added, “It would likely take a core CPI print of 0.4% m/m or higher to materially shift market pricing and strengthen the case for earlier Fed action.”
US Dollar Index Technical Analysis
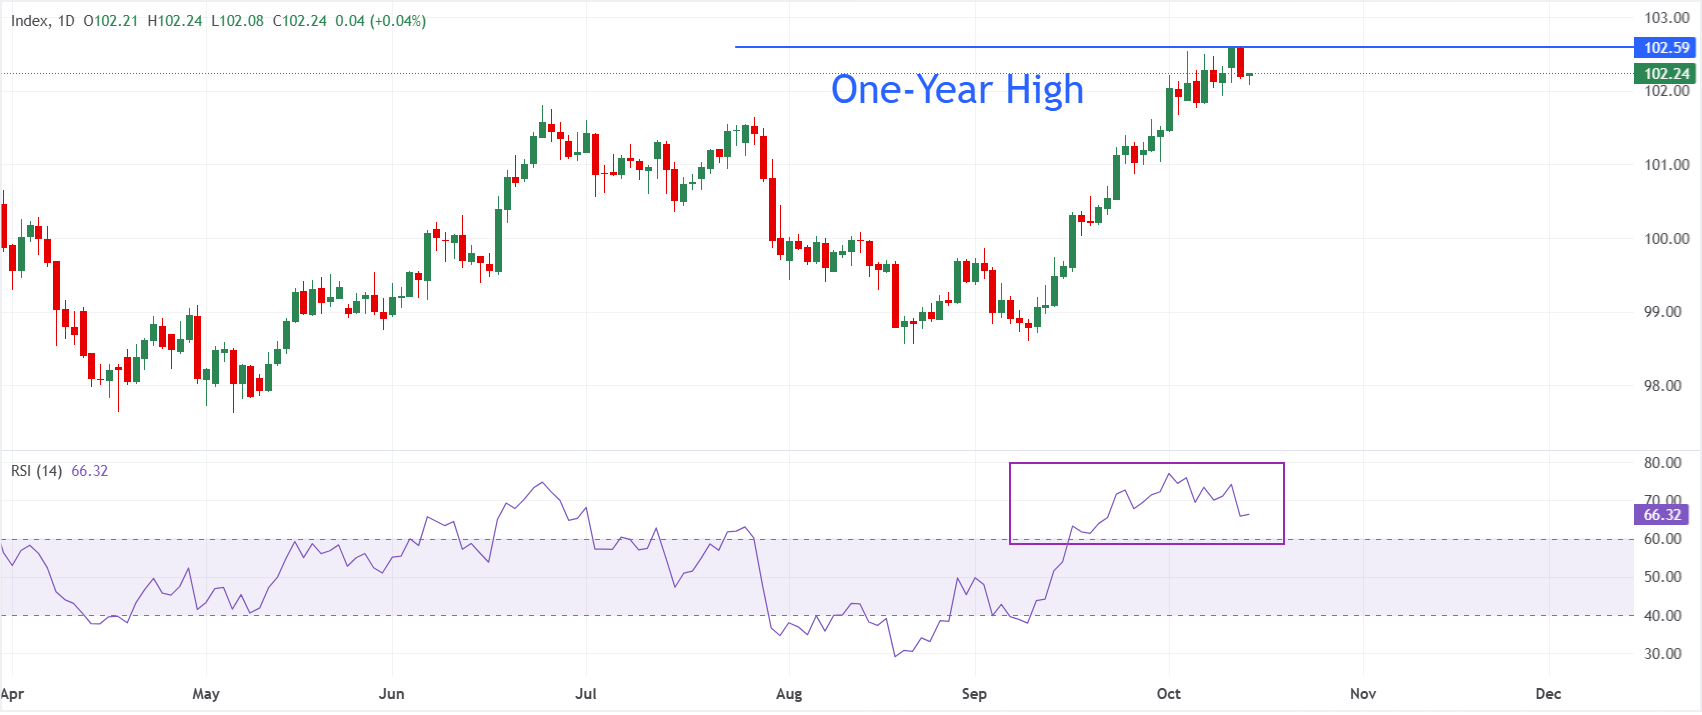
In the daily chart, Dollar Index Spot trades at 102.24, extending its advance after reclaiming the 102 handle, which keeps the near-term bias bullish. Price holds comfortably above prior consolidation levels near the upper 90s and low 100s, suggesting underlying demand remains in place, while the Relative Strength Index (14) at 66.32 hovers just below overbought territory and hints at strong but maturing upside momentum.
With no nearby moving averages or Fibonacci levels specified, the technical focus stays on price action and momentum, where the index is supported by its recent sequence of higher lows and steady grind higher. As long as the RSI holds elevated without a sharp reversal, dips are likely to attract buyers, though the proximity to overbought conditions cautions against chasing the move aggressively at current levels.
(The technical analysis of this story was written with the help of an AI tool. Know more.)
Economic Indicator
Consumer Price Index (YoY)
Inflationary or deflationary tendencies are measured by periodically summing the prices of a basket of representative goods and services and presenting the data as The Consumer Price Index (CPI). CPI data is compiled on a monthly basis and released by the US Department of Labor Statistics. The YoY reading compares the prices of goods in the reference month to the same month a year earlier.The CPI is a key indicator to measure inflation and changes in purchasing trends. Generally speaking, a high reading is seen as bullish for the US Dollar (USD), while a low reading is seen as bearish.
Read more.Next release: Wed Oct 14, 2026 12:30
Frequency: Monthly
Consensus: 3.6%
Previous: 3.4%
Source: US Bureau of Labor Statistics
The US Federal Reserve (Fed) has a dual mandate of maintaining price stability and maximum employment. According to such mandate, inflation should be at around 2% YoY and has become the weakest pillar of the central bank’s directive ever since the world suffered a pandemic, which extends to these days. Price pressures keep rising amid supply-chain issues and bottlenecks, with the Consumer Price Index (CPI) hanging at multi-decade highs. The Fed has already taken measures to tame inflation and is expected to maintain an aggressive stance in the foreseeable future.
추천 기사


