


Dow Jones Industrial Average gives back its bounce as factory output stalls
- DJIA gives back Thursday's bounce to trade near 51,500 as factory output stalls.
- Industrial production was flat in August against a forecast of 0.3%.
- Four industrial companies make up 15.7% of the index between them.
The Dow Jones Industrial Average trades near 51,500, back at the level where Wednesday's selling stopped, which means Thursday's rebound is gone. The selling ran one way down from the session high, and every level that looked like a floor turned into a step. Each of the last three sessions has made a lower high than the one before. The 10-year Treasury yield is back above 5%, and the only American data on the calendar was industrial production, which came in at zero.
No growth in the part of the economy the index is named after
Industrial production was flat in August against a 0.3% forecast, after 0.2% in July. The number counts what American factories, mines and utilities actually made, which is as close as the calendar gets to measuring the business this index was built to track. It also counts two industries the Dow owns nothing in, since there is no miner and no utility among the 30.
Four companies, and one of them is most of it
What there is: Caterpillar (CAT), Honeywell (HON), Boeing (BA) and 3M (MMM), the four members classified as industrials. Between them they hold 15.7% of the index, a little more than half of what the five financial companies hold. The average has had the word industrial in its name since 1896 and four of its members still qualify.
The four have not had the same year. Caterpillar's share price is up more than 36% in 2026, 3M's is up less than 2%, and Boeing's is down about 7%. Because weight follows the share price here, Caterpillar's 9% is worth more to the index than the other three put together.
Flat output is not falling output, and one month of it changes nothing at these companies directly. What it changes is the read on new orders, because factories that are not making more do not buy more of the machines, controls and adhesives the four of them sell. That is why Friday's durable goods number carries more for them than August's output did.
The case for another increase was never built on the factories
Kansas City Fed President Schmid, who does not vote on the committee until 2028, said he supported Wednesday's increase and that recent data puts the inflation trend above 3%. The problem is not only energy, he said, because price growth has been strong across a broad set of goods and services. The calendar scores his speeches on how far they lean toward higher rates, and it put this one at 8.0 against his usual 7.2.
The 10-year Treasury yield is back above 5% after dipping on Thursday, having reached its highest level since July 2007 earlier in the week, and the 30-year is above 5.30%. President Schmid also said the economy is performing well outside of inflation, on the day its factory output was reported at zero.
Those are the rates that aircraft financing and corporate borrowing are priced off, so they reach Boeing's customers first and the other 29 members through their own debt. The Fed's own projections put core inflation at 3.4% this year, higher than it thought in June, and do not have it back at 2% until 2029. Growth is marked at 2.3% and unemployment at 4.1%, which describes an economy the committee thinks can take another increase.
Two more looks at the factories before the October meeting
Flash purchasing surveys land Wednesday at 13:45 GMT, with manufacturing forecast at 53.6 after 53.9 and services at 56 after 56.5. A Purchasing Managers Index (PMI) above 50 means more firms reported growth than decline, so both are forecast to stay above water and to slow while they do it. Durable goods orders follow Friday at 12:30 GMT, forecast at -0.5% after 1.1% in July, and that number is the order book for Caterpillar, Boeing, Honeywell and 3M.
Jobless claims on Thursday are forecast at 202K after 196K. The Michigan survey on Friday carries sentiment, forecast at 47.8, and what households expect prices to do over the coming year, last reported at 4.6%. Home Depot (HD), McDonald's (MCD), Nike (NKE) and Amazon (AMZN) make up 9.6% of the index and sell into both numbers. The sentiment reading is forecast to confirm the earlier estimate to the decimal.
Levels and bias
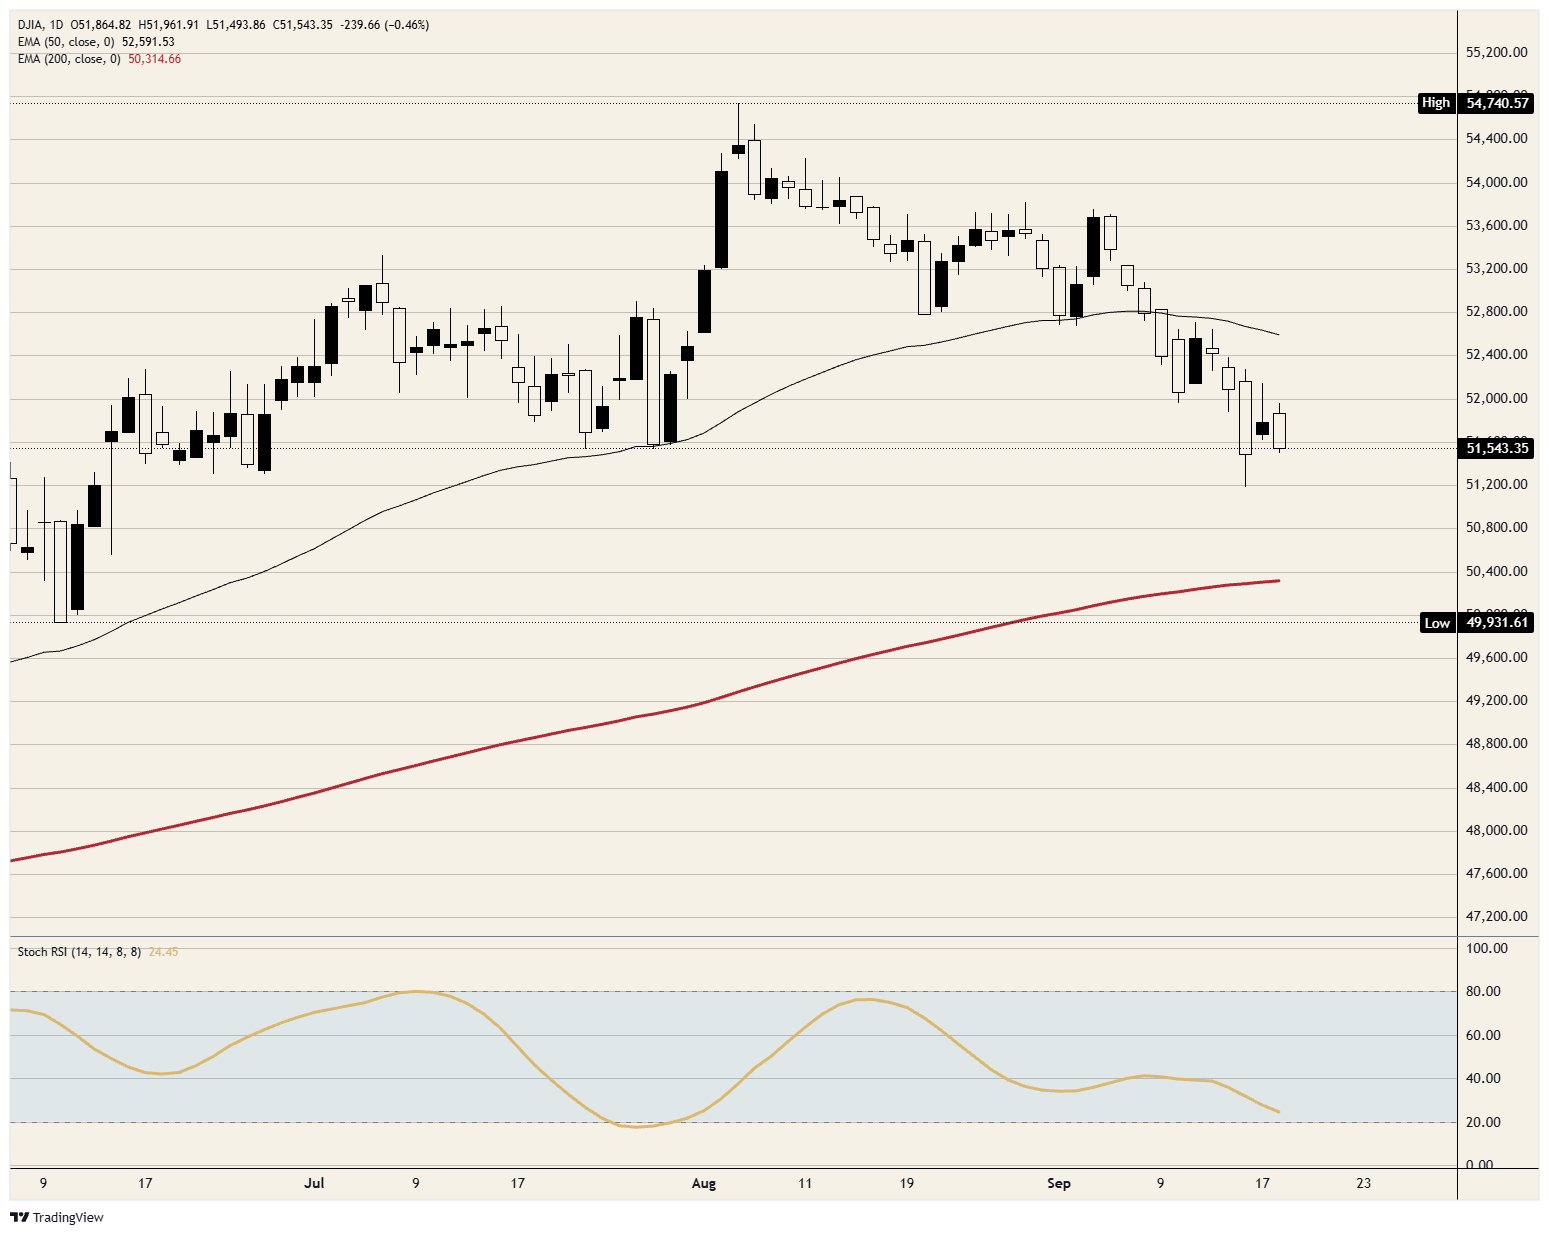
Resistance: 52,000 stopped the bounce, with the session high just short of it. Above that, the 50-day Exponential Moving Average (EMA) near 52,600 has been falling since early September and has capped every bounce since the Fed's decision.
Support: The session low just under 51,500 is the first floor. Beneath it, Wednesday's low near 51,200 is the lowest the index has traded since June, and then 51,000.
Bias: Bearish while 52,000 caps. The first objective is 51,200 and the second is 51,000. The daily Stochastic Relative Strength Index (Stoch RSI), a momentum gauge, is near 24 and still falling, which fits an index making lower highs. A daily close above 52,000 ends the bearish case.
Dow Jones daily chart
Dow Jones FAQs
The Dow Jones Industrial Average, one of the oldest stock market indices in the world, is compiled of the 30 most traded stocks in the US. The index is price-weighted rather than weighted by capitalization. It is calculated by summing the prices of the constituent stocks and dividing them by a factor, currently 0.152. The index was founded by Charles Dow, who also founded the Wall Street Journal. In later years it has been criticized for not being broadly representative enough because it only tracks 30 conglomerates, unlike broader indices such as the S&P 500.
Many different factors drive the Dow Jones Industrial Average (DJIA). The aggregate performance of the component companies revealed in quarterly company earnings reports is the main one. US and global macroeconomic data also contributes as it impacts on investor sentiment. The level of interest rates, set by the Federal Reserve (Fed), also influences the DJIA as it affects the cost of credit, on which many corporations are heavily reliant. Therefore, inflation can be a major driver as well as other metrics which impact the Fed decisions.
Dow Theory is a method for identifying the primary trend of the stock market developed by Charles Dow. A key step is to compare the direction of the Dow Jones Industrial Average (DJIA) and the Dow Jones Transportation Average (DJTA) and only follow trends where both are moving in the same direction. Volume is a confirmatory criteria. The theory uses elements of peak and trough analysis. Dow’s theory posits three trend phases: accumulation, when smart money starts buying or selling; public participation, when the wider public joins in; and distribution, when the smart money exits.
There are a number of ways to trade the DJIA. One is to use ETFs which allow investors to trade the DJIA as a single security, rather than having to buy shares in all 30 constituent companies. A leading example is the SPDR Dow Jones Industrial Average ETF (DIA). DJIA futures contracts enable traders to speculate on the future value of the index and Options provide the right, but not the obligation, to buy or sell the index at a predetermined price in the future. Mutual funds enable investors to buy a share of a diversified portfolio of DJIA stocks thus providing exposure to the overall index.
추천 기사


