


Bitcoin and Gold Outlook: BTC breaks above $80,000 as XAU climbs to one-week high
- Bitcoin reclaims $80,000 as risk-on sentiment returns in the broader crypto market.
- Bitcoin faces heavy supply toward $82,000, an area that has repeatedly capped rallies over recent weeks.
- Gold remains relatively elevated near $4,350 and above both the 50-day and 200-day EMAs.
Bitcoin (BTC) extends its recovery and rallies above $80,000 on Friday, building on support at $75,000 and growing risk-on sentiment after dust settled from regulatory headwinds of the CLARITY Act in the United States (US) Senate and the Federal Reserve’s (Fed) 25-basis-point interest rate hike.
Gold (XAU/USD), meanwhile, retains a neutral-to-bullish outlook, trading near $4,350. The metal remains relatively grounded by short and medium-term moving averages, raising the odds of a steady but gradual recovery.
CFTC files crypto rulemaking framework with White House
The Commodity Futures Trading Commission (CFTC) has filed its crypto asset rulemaking with the White House for review, lifting sentiment in the broader crypto market after the CLARITY Act flopped at the Senate on Tuesday.
The Commission filed the 'Regulation Crypto Asset Transactions and Regulation Crypto Asset Markets' with the Office of Information and Regulatory Affairs (OIRA), a division within the Office of Management and Budget tasked with reviewing regulations before publication.
Both the CFTC and the Securities and Exchange Commission (SEC) are presenting themselves as capable agencies that can regulate the crypto industry, especially after the CLARITY Act failed to advance.
On Wednesday, the SEC granted conditional exemptive relief to Tokenized Securities Venues (TSVs) to trade tokenized National Market System (NMS) stock by tapping liquidity pools. The move would see exchanges list tokenized equities for trading in the US within a regulated environment.
SEC Chair Paul Atkins said that while exemptions are temporary, “they allow TSVs to trade tokenized NMS stock in a permissioned environment today.”
Technical analysis: Bitcoin gains momentum
Bitcoin trades above $80,000, maintaining a clear bullish bias as price stays decisively above the 50-day, 100-day, and 200-day Exponential Moving Average (EMA) cluster between roughly $71,700 and $73,950, as well as the SuperTrend support around $72,788.
The Relative Strength Index (RSI) near 62 stays in constructive territory, hinting at persistent buying interest, although the negative Moving Average Convergence Divergence (MACD) histogram, with the line below the signal, suggests waning upside momentum and the risk of a corrective pause rather than an outright reversal.
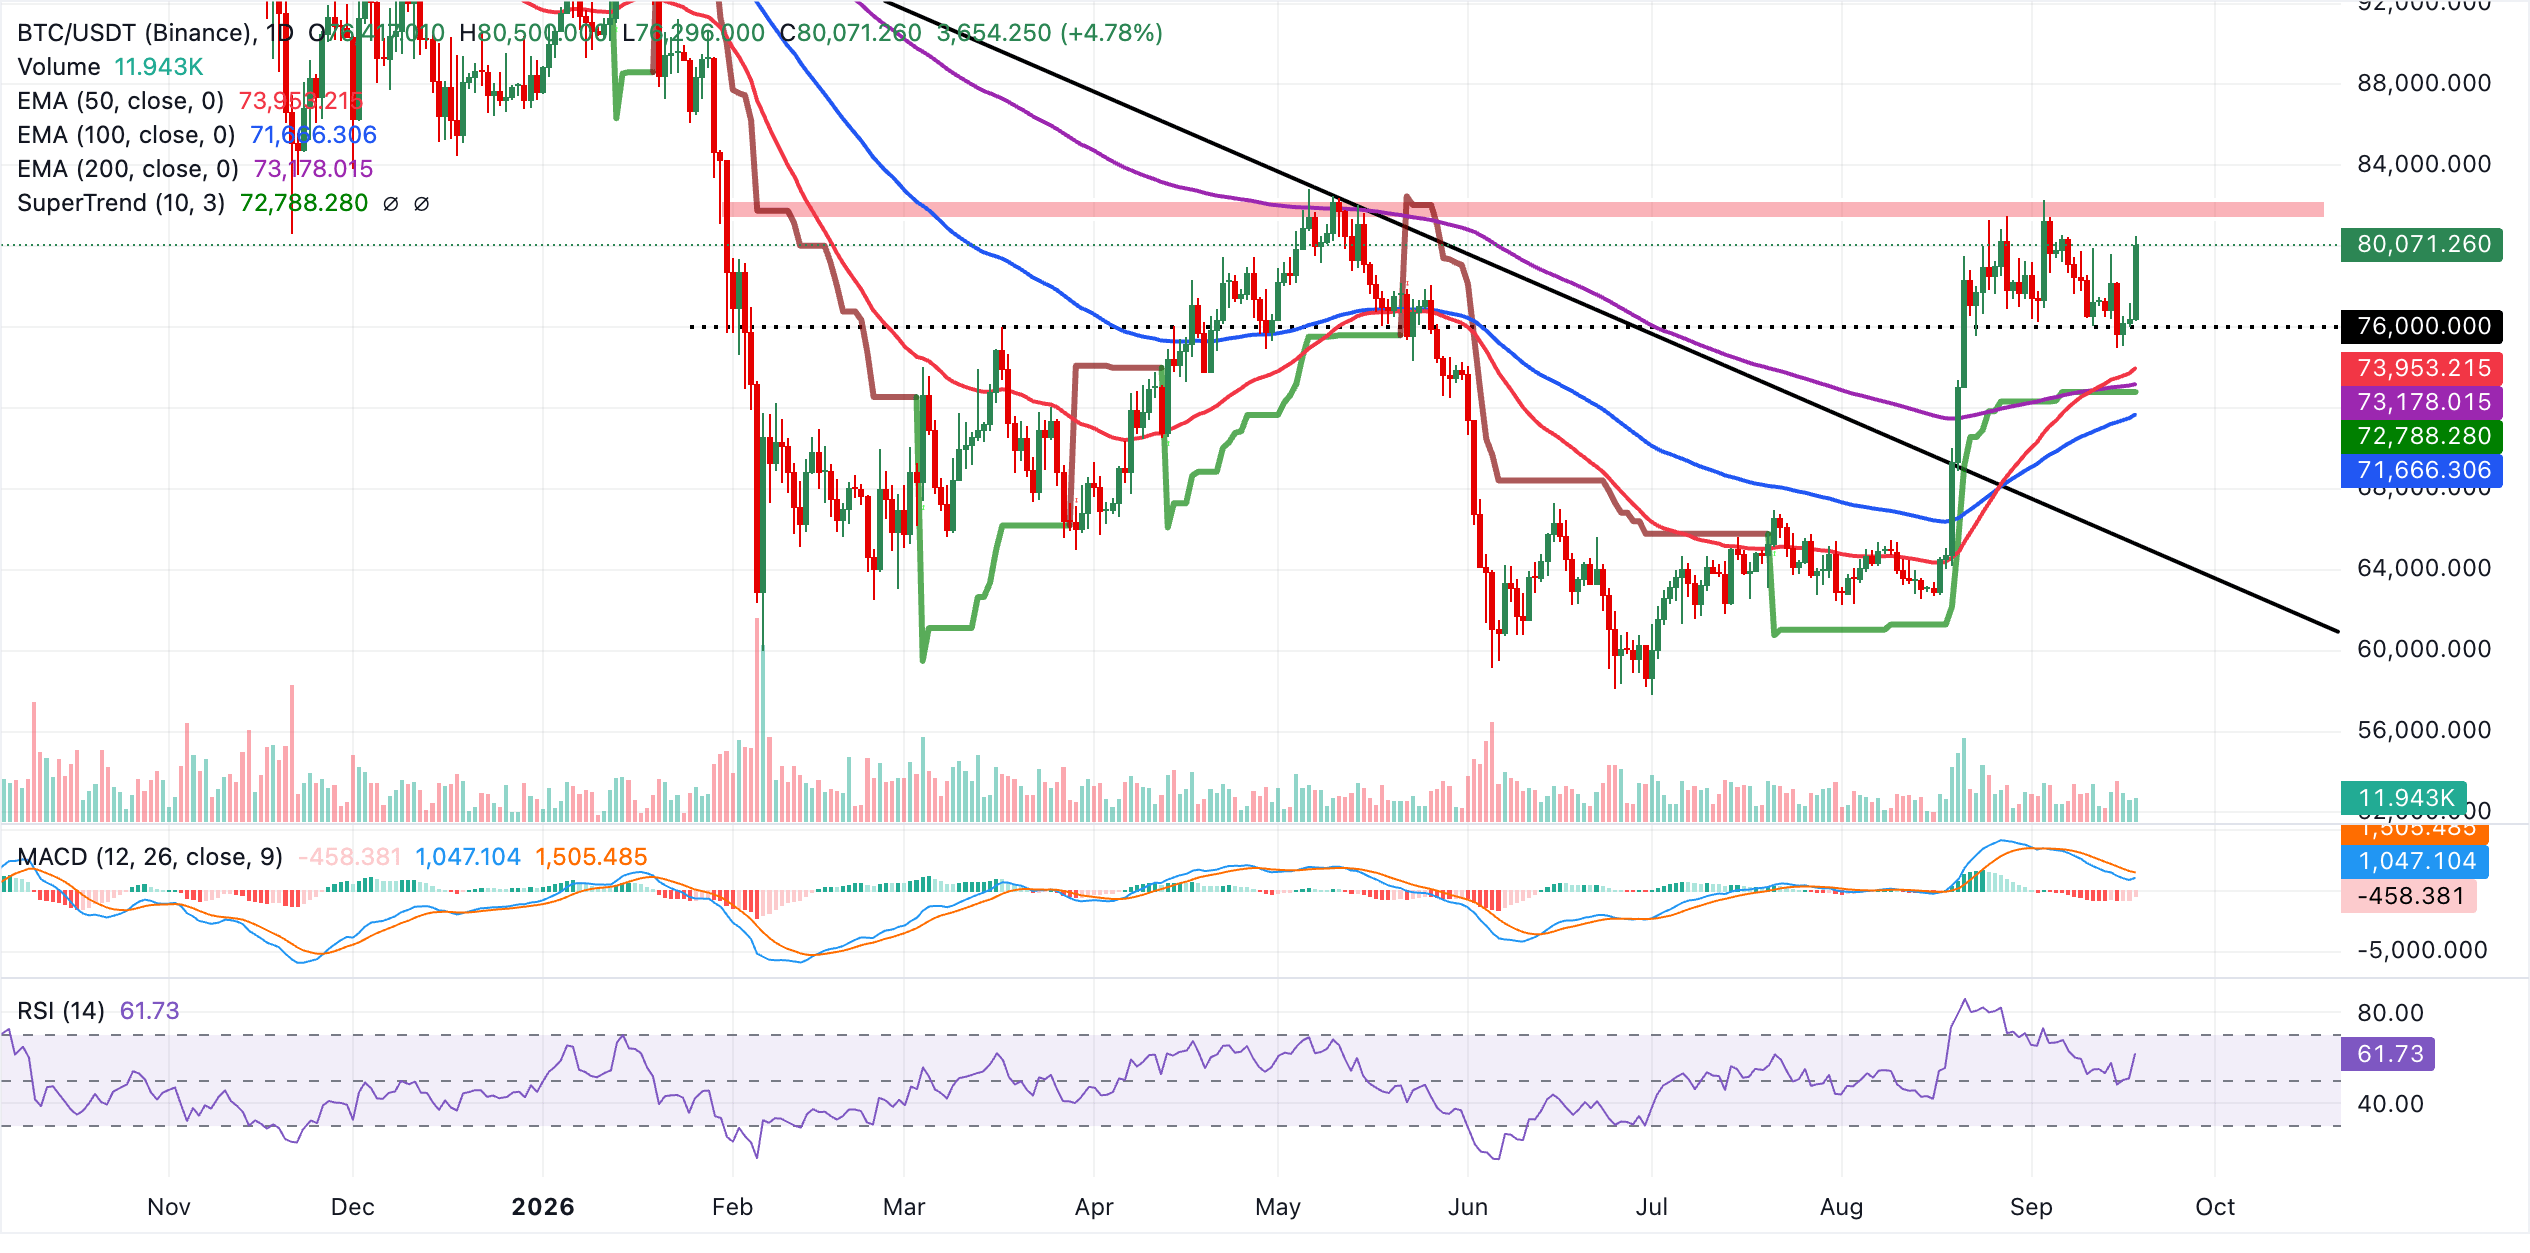
On the downside, immediate support lies at the intraday pivot around $80,000, followed by this week's primary demand area at $75,000. A deeper correction would test the 50-day EMA at $73,953 and the 200-day EMA near $73,178, which together form a dense structural floor. Meanwhile, the SuperTrend line at $72,788 and the 100-day EMA at $71,666 reinforce the broader bullish backdrop, while the prior resistance trendline break level around $65,202 stands as a deeper medium-term support in the event of a more pronounced pullback.
Gold technical analysis: Gold ticks up as bulls slowly return
Gold trades at $4,345 as bulls target higher structural support levels. The metal hovers just above the 50-day EMA at $4,343 and the 200-day EMA at $4,319, while the 100-day EMA at $4,361 caps the immediate upside, leaving the near-term bias neutral as price consolidates between these key averages.
The SuperTrend indicator at $4,591 and the downward resistance trendline’s break level near $4,513 sit well overhead, suggesting that any sustainable bullish continuation would require a decisive move through $4,400 supply first. Momentum remains subdued, with the RSI around 49 and the MACD below zero with negative readings, hinting at a lack of directional conviction rather than strong selling pressure.
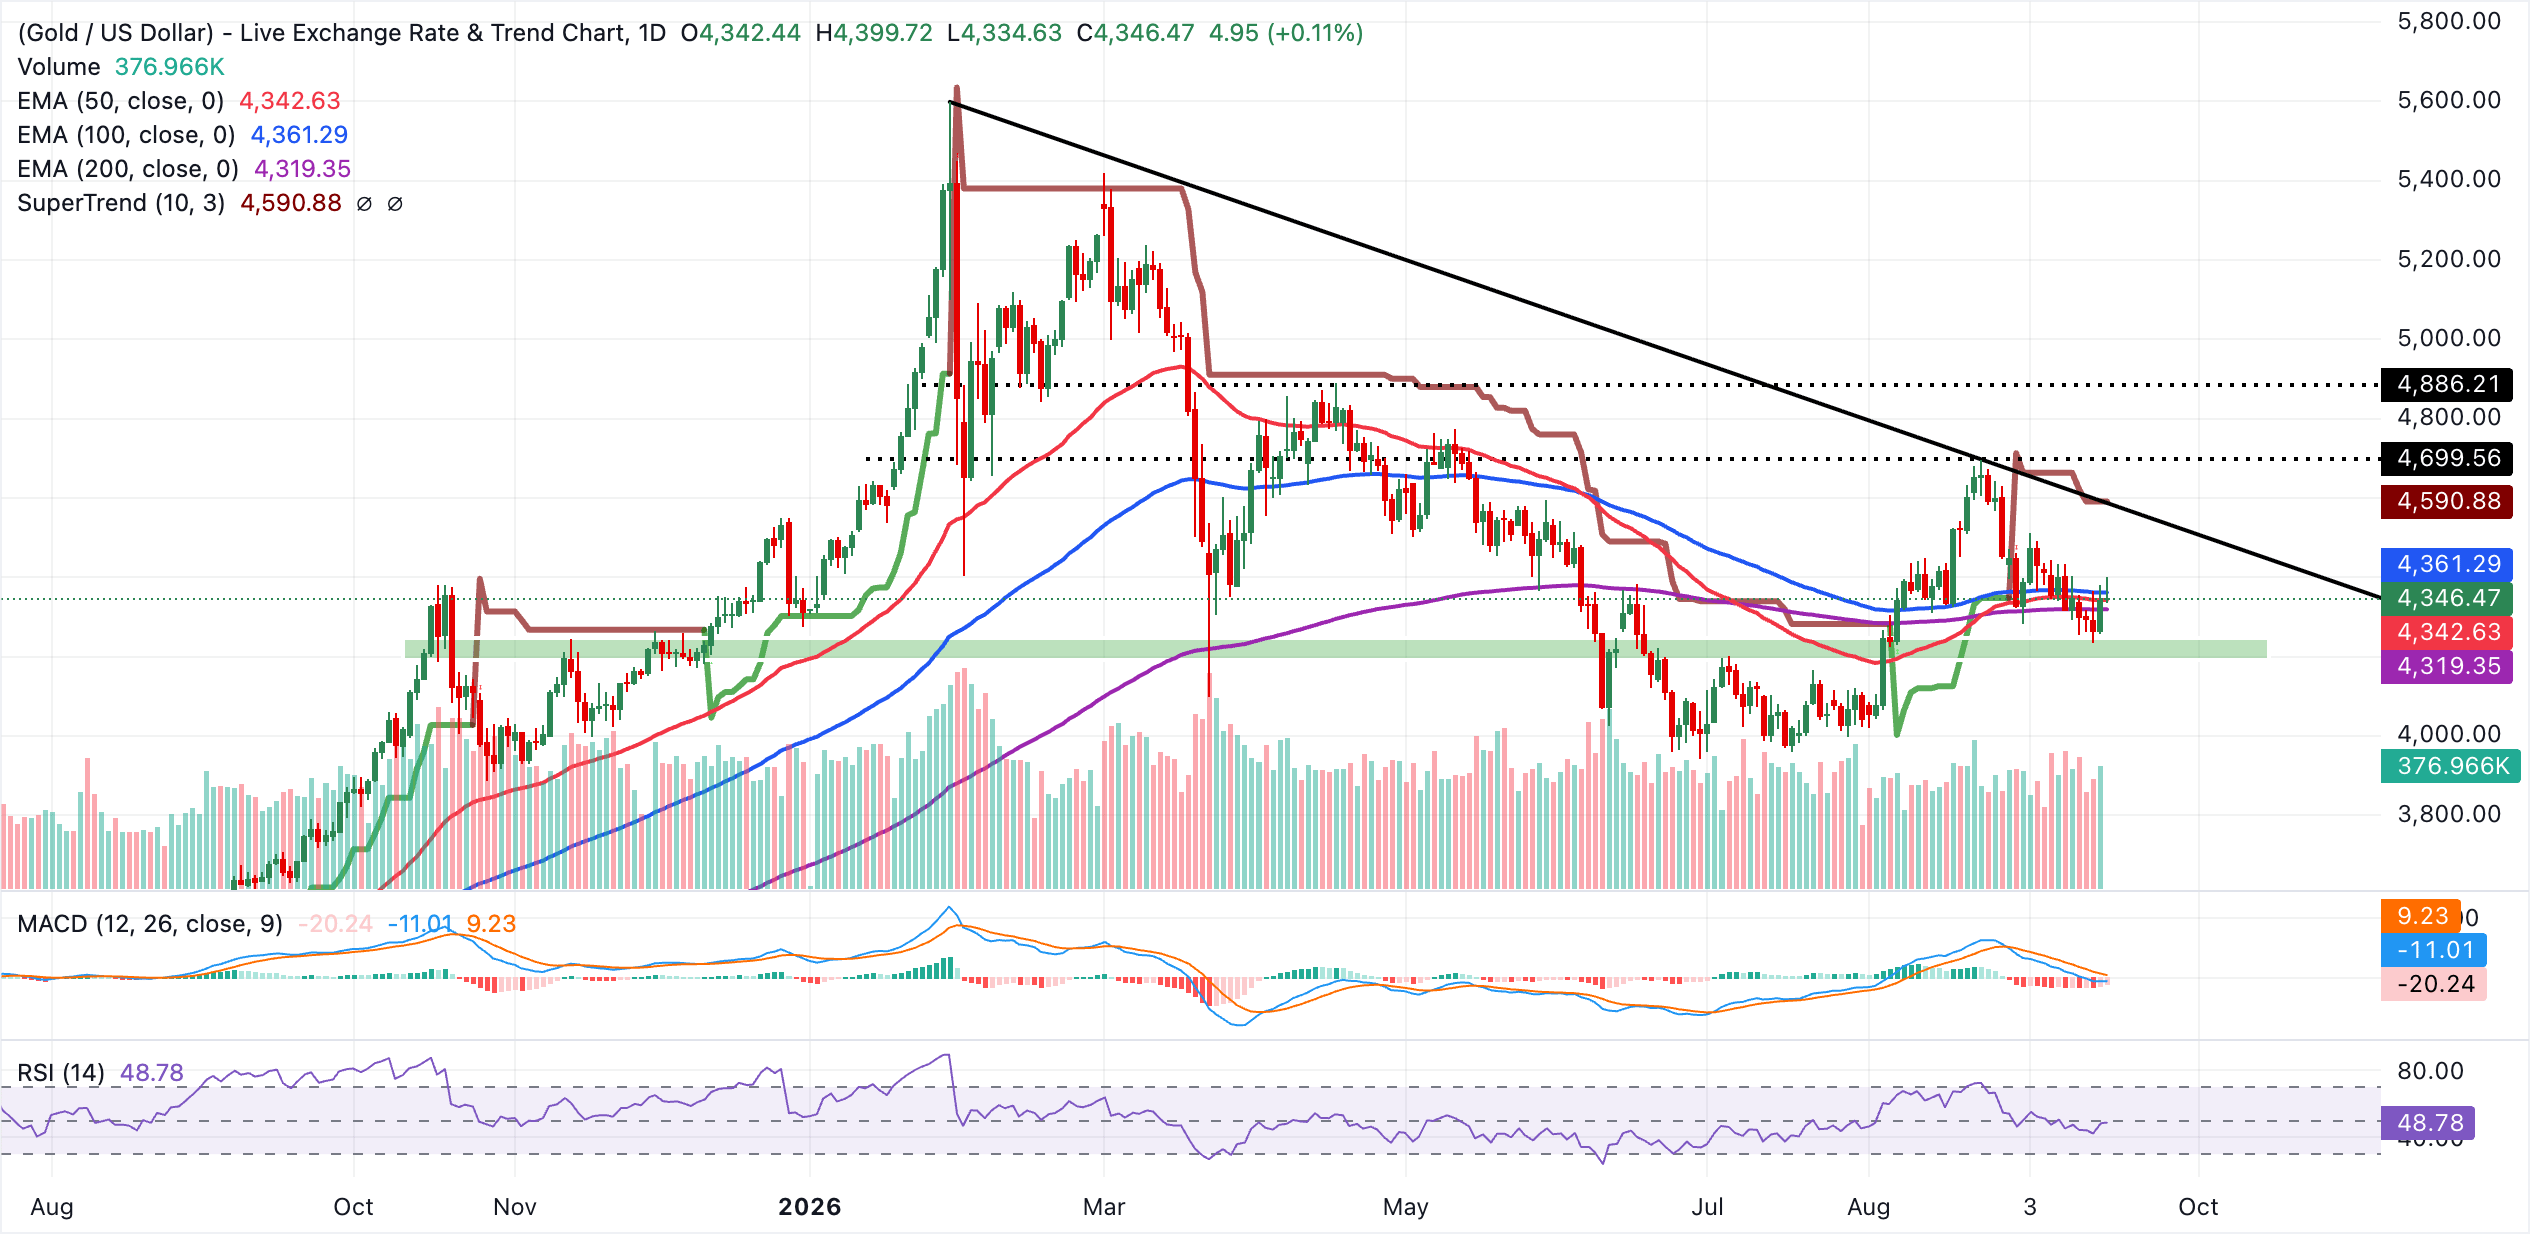
On the downside, immediate support lies at the nearby 50-day EMA at $4,343, followed by a more substantive structural floor at the 200-day EMA around $4,319.34, where buyers are likely to defend the broader uptrend. On the topside, initial resistance emerges at the 100-day EMA at $4,361. A daily close above this level would open the way toward the descending trendline break area near $4,513, ahead of a stronger barrier at the SuperTrend line clustered around $4,591.
As long as price remains trapped between the 200-day EMA and the 100-day EMA, XAU/USD is likely to stay in a range, with breakout signals only validated by a clear move beyond these nearby moving average pivots and the $4,400 supply.
(The technical analysis of this story was written with the help of an AI tool. Know more.)
Bitcoin, altcoins, stablecoins FAQs
Bitcoin is the largest cryptocurrency by market capitalization, a virtual currency designed to serve as money. This form of payment cannot be controlled by any one person, group, or entity, which eliminates the need for third-party participation during financial transactions.
Altcoins are any cryptocurrency apart from Bitcoin, but some also regard Ethereum as a non-altcoin because it is from these two cryptocurrencies that forking happens. If this is true, then Litecoin is the first altcoin, forked from the Bitcoin protocol and, therefore, an “improved” version of it.
Stablecoins are cryptocurrencies designed to have a stable price, with their value backed by a reserve of the asset it represents. To achieve this, the value of any one stablecoin is pegged to a commodity or financial instrument, such as the US Dollar (USD), with its supply regulated by an algorithm or demand. The main goal of stablecoins is to provide an on/off-ramp for investors willing to trade and invest in cryptocurrencies. Stablecoins also allow investors to store value since cryptocurrencies, in general, are subject to volatility.
Bitcoin dominance is the ratio of Bitcoin's market capitalization to the total market capitalization of all cryptocurrencies combined. It provides a clear picture of Bitcoin’s interest among investors. A high BTC dominance typically happens before and during a bull run, in which investors resort to investing in relatively stable and high market capitalization cryptocurrency like Bitcoin. A drop in BTC dominance usually means that investors are moving their capital and/or profits to altcoins in a quest for higher returns, which usually triggers an explosion of altcoin rallies.
추천 기사


