


Bitcoin Weekly Forecast: BTC shrugs off CLARITY Act setback and hawkish Fed
- Bitcoin recovers, trading above $78,000 on Friday, but the 50-week SMA near $78,760 continues to cap its upside.
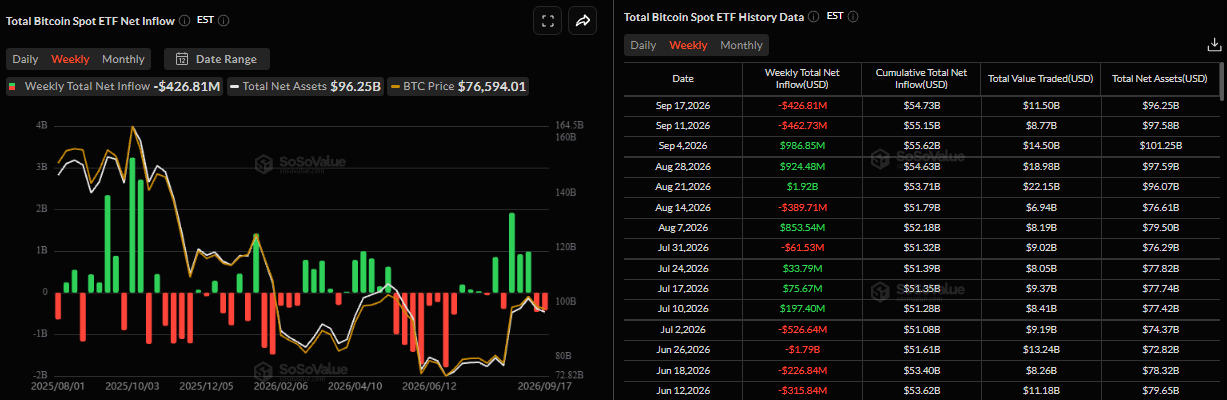
- US-listed spot ETFs are on track for a second straight week of outflows, with $426.81 million recorded through Thursday.
- A hawkish Fed outlook, escalating Middle East tensions, and the CLARITY Act's failure to advance in the US Senate could limit BTC upside.
Bitcoin (BTC) price action has remained resilient this week, trading above $78,000 at the time of writing on Friday, heading toward a key resistance zone. Institutional demand shows early signs of weakness, with spot Exchange Traded Funds (ETFs) on track for a second straight week of outflows, with over $420 million recorded through Thursday amid escalating Middle East tensions. Moreover, traders should still be cautious, as a hawkish Federal Reserve (Fed) outlook and the CLARITY Act's failure to advance in the US Senate could cap the Crypto Kings' upside potential.
Institutional demand shows cooling signs
Institutional demand shows a cautious stance among investors so far this week. SoSoValue data showed spot ETFs are on track for a second straight week of outflows, with $426.81 million recorded through Thursday. If these withdrawals continue and intensify on Friday, BTC could correct ahead.
No regulatory catalyst for crypto market
The Digital Asset Market Clarity (CLARITY) Act failed to pass in the US Senate on Tuesday, after falling short of the 60 votes needed to invoke cloture. Cloture is the formal Senate procedure used to break legislative gridlock and force a final vote on a bill.
The measure received 49 YEA and 50 NAY votes, falling short of the 60 threshold by 11 despite a series of negotiations from Republican lawmakers and a push from US President Donald Trump.
In addition, Senator Kirsten Gillibrand, who reportedly urged colleagues to support moving the bill forward, also voted no. The main issue was ethics. Democrats argued that the bill did not go far enough in addressing President Trump's financial interests in crypto, including his memecoin and links to World Liberty Financial. Republicans had added ethics language, but Democrats said the provisions were too weak and difficult to enforce.
"The outcome disappointed the industry, but it was not a major shock," reported a K33 Research analyst.
The analyst reported that the market had already spent months adjusting to the possibility that Congress would not reach a deal. Still, the failure matters because the Clarity Act was meant to solve a broader problem than any single Securities and Exchange Commission (SEC) or Commodity Futures Trading Commission (CFTC) rule can address.
Since then, attention has quickly shifted to the regulators. On Thursday, the US SEC released its long-awaited "Innovation Exemption."
The five-year measure allows certain venues to facilitate on-chain trading of tokenized US stocks without registering as exchanges, provided they meet several conditions.
The announcement granting exchanges exemptive relief to bring tokenized stocks trading in the US comes as the Senate failed to advance the crypto CLARITY Act. This move reaffirms the SEC's commitment to provide the industry with much-needed oversight within its existing authority, despite the bill's setback.
"The Clarity Act is therefore wounded, not necessarily dead. Senator Thom Tillis preserved the option of another vote, while Gillibrand and six other Democrats said Wednesday that they remain committed to passing market structure legislation. The problem is time. With the midterms approaching and the Senate calendar shrinking, the path to a deal this year is now extremely narrow," concluded the K33 Research analyst.
Fed rate hike and hawkish outlook
The US central bank voted unanimously to raise its benchmark interest rate by 25 basis points (bps) for the first time since 2023, bringing the Federal Funds target range to 3.75%-4.00%, at the conclusion of the September policy meeting on Wednesday.
The decision aligned with broader market consensus, but came with a more hawkish outlook. In fact, the so-called dot plot revealed that Fed officials expect one more interest rate increase within this year.
At the post-meeting press conference, Fed Chair Kevin Warsh said that a strengthening US economy, a lack of improvement in summer inflation trends, and geopolitics led to the decision.
On the geopolitical front, escalating tensions in the Middle East are another factor underpinning the safe-haven Greenback and damping risk appetite. Iran's Islamic Revolutionary Guard Corps (IRGC) said that it struck a Togo-flagged tanker that attempted an illegal passage through the Strait of Hormuz.
Moreover, President Trump said that he was approaching a major decision on whether to resume large-scale attacks on Iran.
Together, these developments have supported demand for the safe-haven US Dollar (USD), potentially limiting BTC upside potential.
Bitcoin technical outlook: Near key 50-week SMA resistance
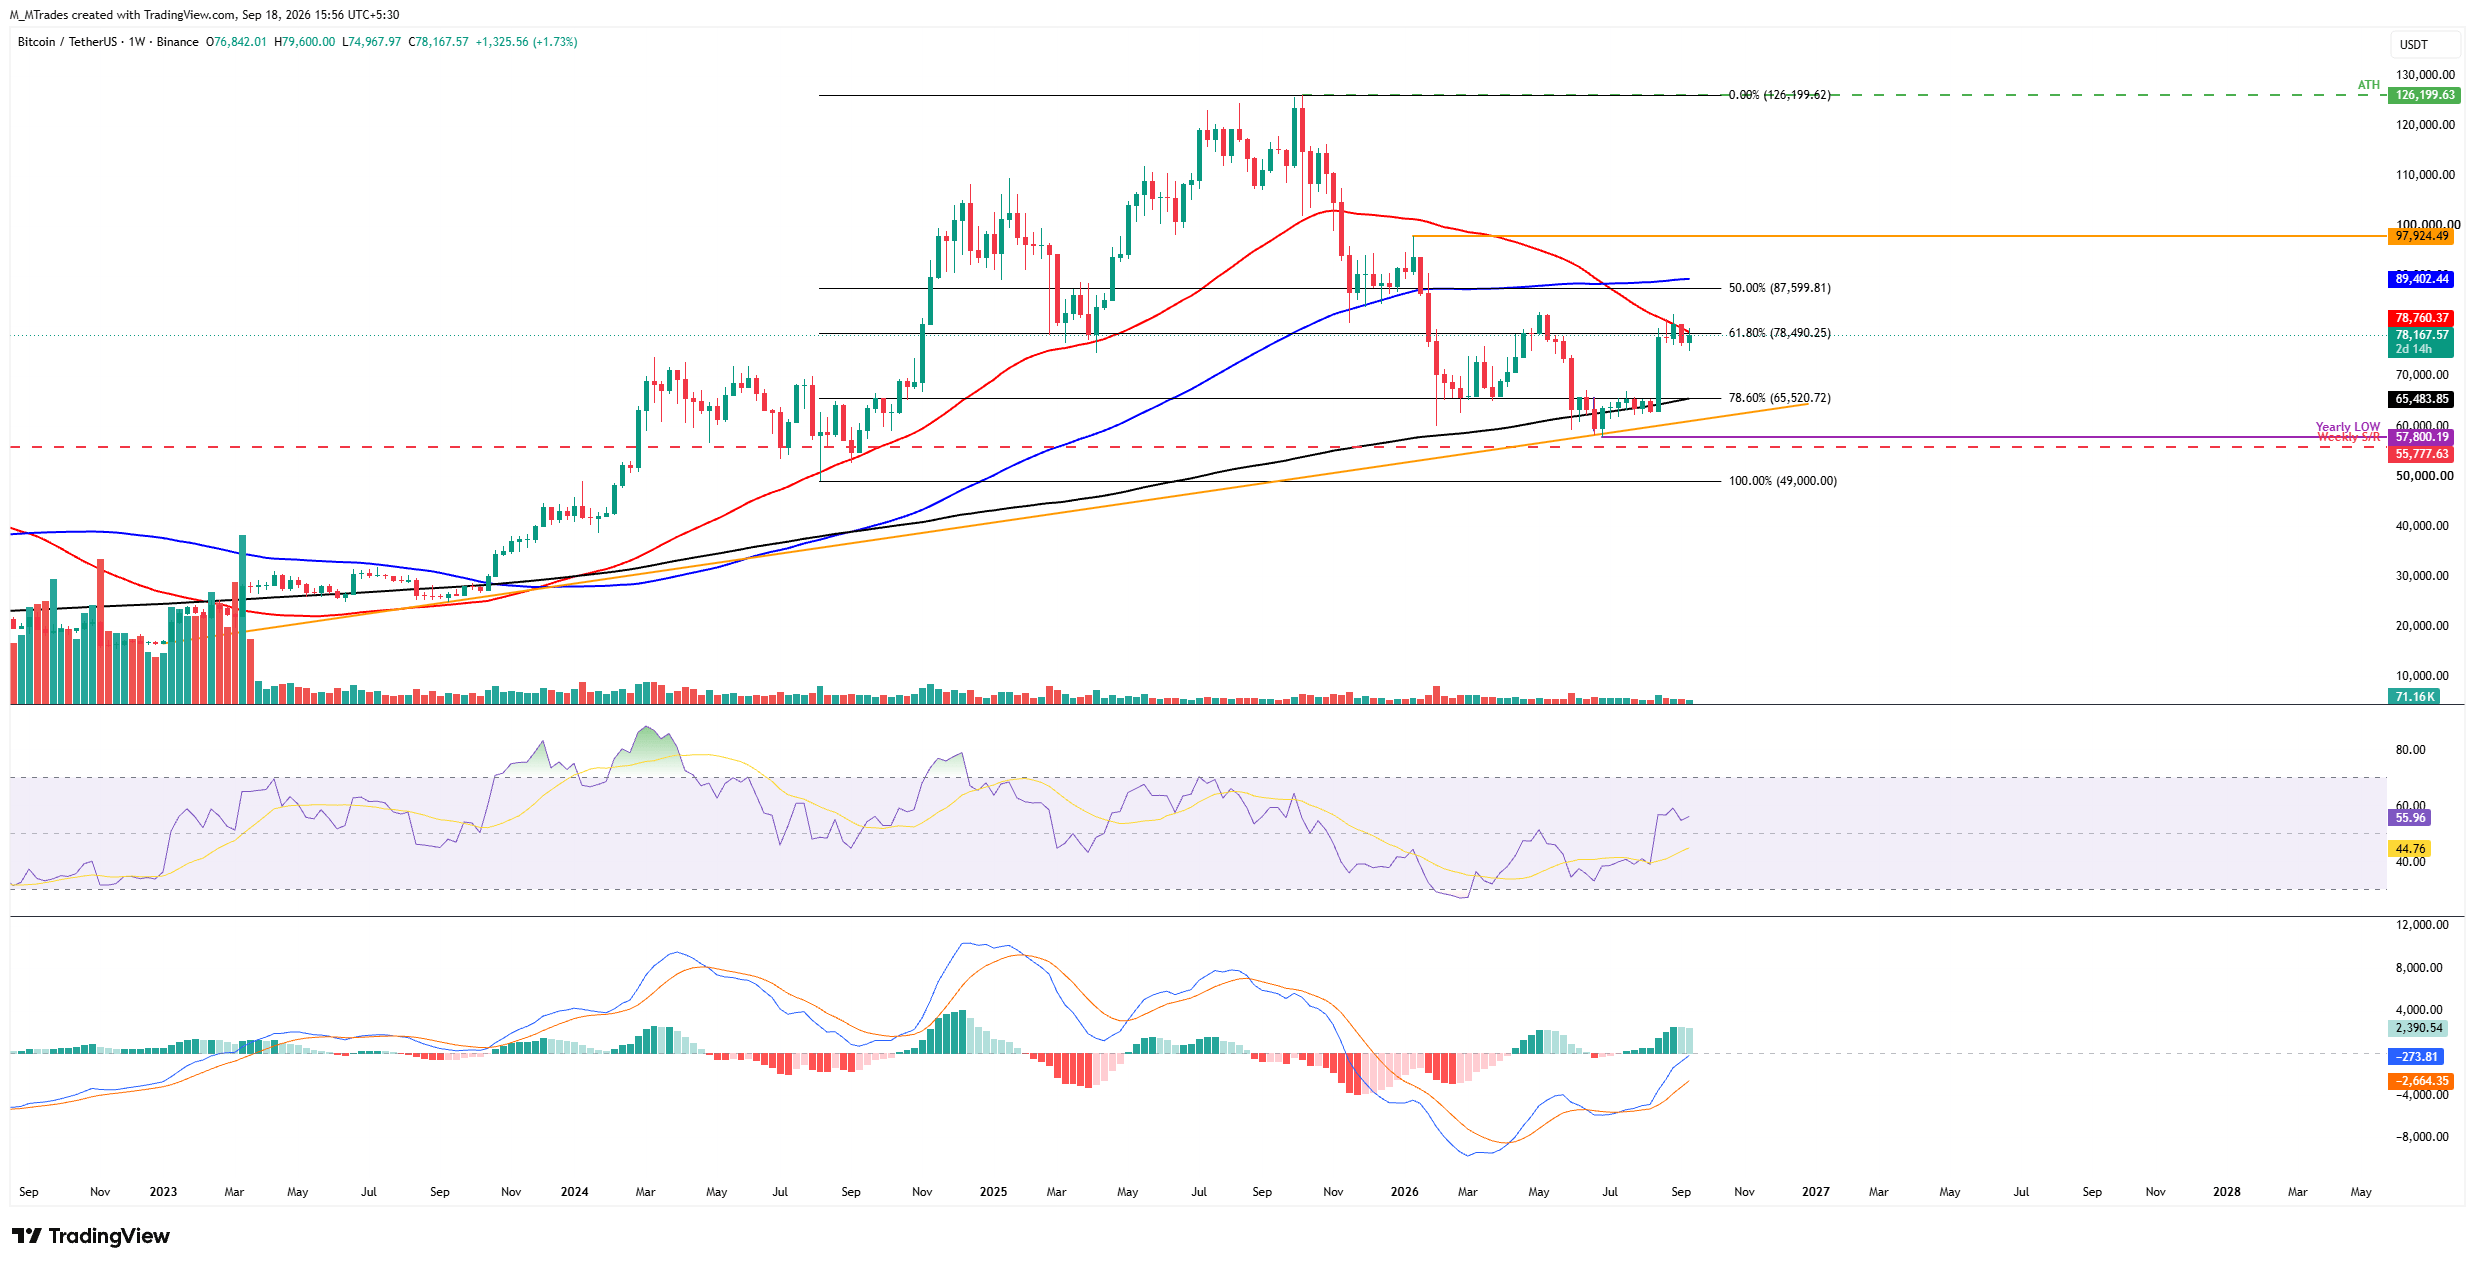
The Crypto King slightly recovers this week, trading around $78,100 at the time of writing on Friday and nearing the immediate resistance at the 50-week Simple Moving Average (SMA) at $78,760.
If BTC fails to overcome the 50-day SMA resistance and corrects, it could extend the decline toward the key psychological level of $70,000.
The Relative Strength Index (RSI) on the weekly chart around 55 shows mildly positive momentum without reaching overbought conditions. At the same time, the Moving Average Convergence Divergence (MACD) histogram remains firmly in positive territory, hinting that upside pressure persists despite nearby resistance.
If BTC recovers and closes above the 50-week SMA at $78,760 on a weekly basis, it could extend the rally toward the 50% Fibonacci retracement level at $87,599 (drawn from the August 2024 low of $49,000 to the October 2025 record high of $126,199), followed by the 100-week SMA at $89,402.
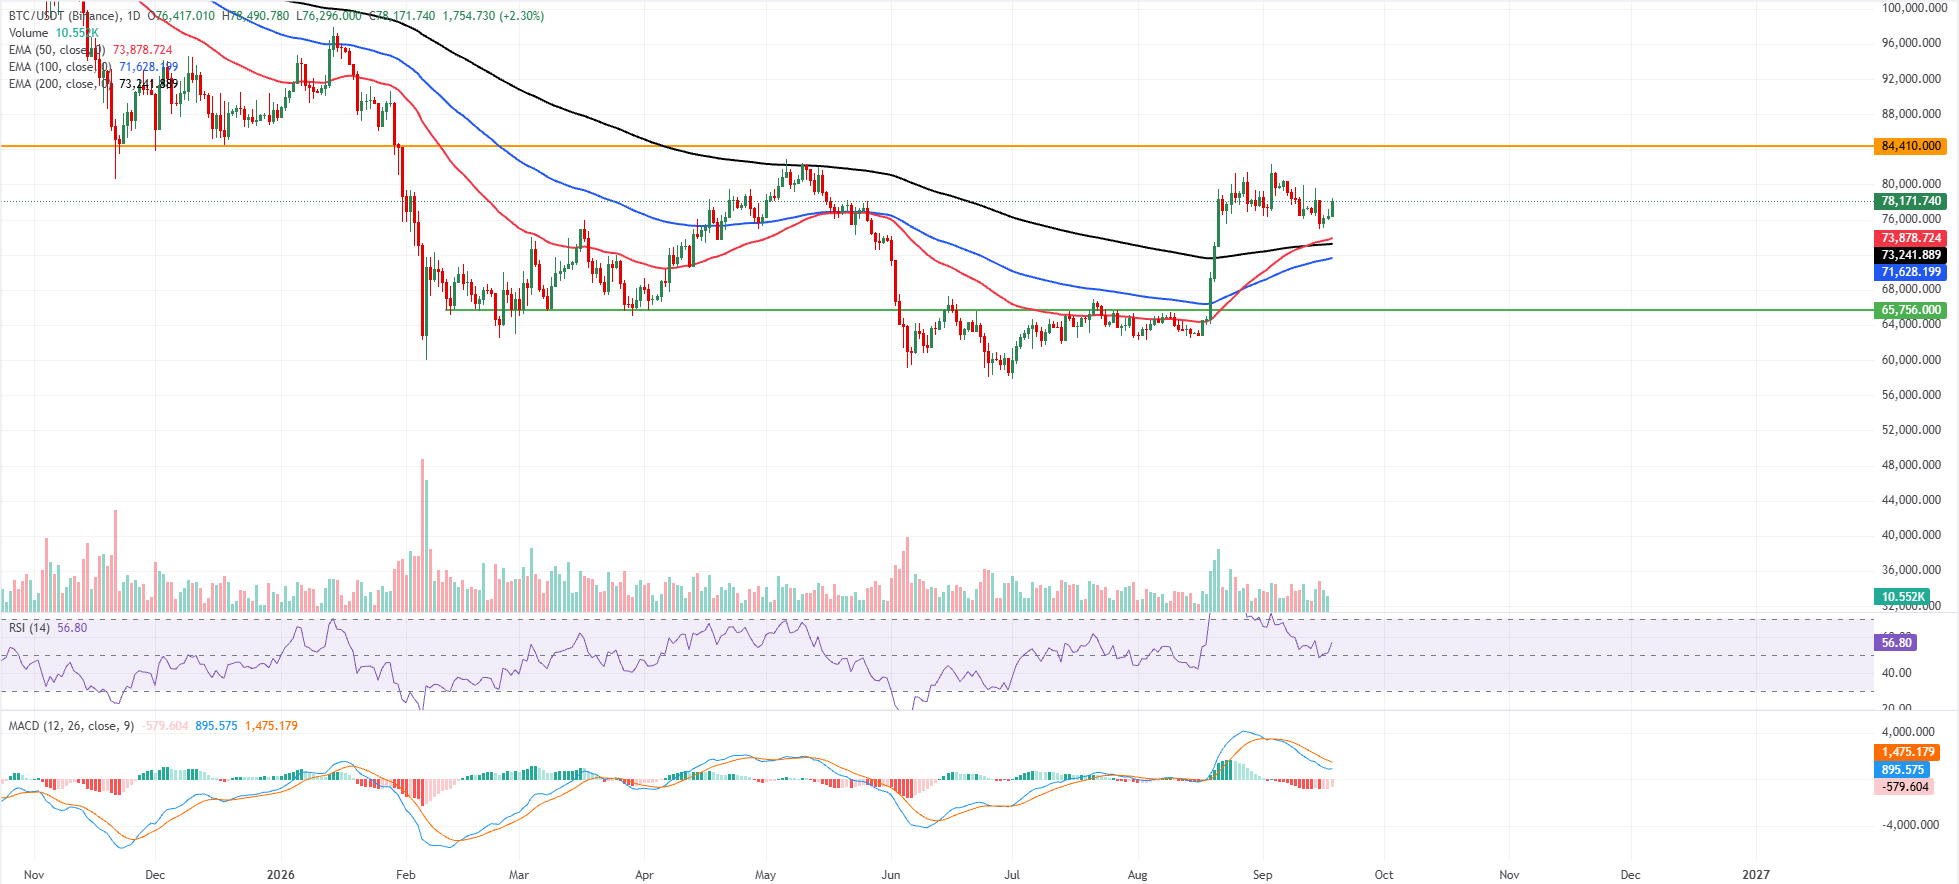
On the daily chart, BTC is holding a bullish near-term bias as price remains decisively above key Exponential Moving Averages (EMAs). The 50-day EMA at $73,878, together with the 200-day EMA at $73,241 and the 100-day EMA at $71,628, forms a broad demand band underpinning the uptrend and suggests that dips are still being absorbed.
Momentum on the daily chart is mixed but constructive, with the RSI hovering near 57 in a neutral-to-positive zone, while the MACD histogram remains below zero, hinting that bullish pressure is present but not yet aggressive.
On the downside, immediate support is seen at the 50-day EMA around $73,878, ahead of the deeper trend floor defined by the 200-day EMA near $73,241 and the 100-day EMA closer to $71,628.
On the topside, the next significant resistance is the horizontal barrier at $84,410, which caps the current bullish structure and must be overcome to open the way to fresh record highs.
(The technical analysis of this story was written with the help of an AI tool. Know more.)
Bitcoin, altcoins, stablecoins FAQs
Bitcoin is the largest cryptocurrency by market capitalization, a virtual currency designed to serve as money. This form of payment cannot be controlled by any one person, group, or entity, which eliminates the need for third-party participation during financial transactions.
Altcoins are any cryptocurrency apart from Bitcoin, but some also regard Ethereum as a non-altcoin because it is from these two cryptocurrencies that forking happens. If this is true, then Litecoin is the first altcoin, forked from the Bitcoin protocol and, therefore, an “improved” version of it.
Stablecoins are cryptocurrencies designed to have a stable price, with their value backed by a reserve of the asset it represents. To achieve this, the value of any one stablecoin is pegged to a commodity or financial instrument, such as the US Dollar (USD), with its supply regulated by an algorithm or demand. The main goal of stablecoins is to provide an on/off-ramp for investors willing to trade and invest in cryptocurrencies. Stablecoins also allow investors to store value since cryptocurrencies, in general, are subject to volatility.
Bitcoin dominance is the ratio of Bitcoin's market capitalization to the total market capitalization of all cryptocurrencies combined. It provides a clear picture of Bitcoin’s interest among investors. A high BTC dominance typically happens before and during a bull run, in which investors resort to investing in relatively stable and high market capitalization cryptocurrency like Bitcoin. A drop in BTC dominance usually means that investors are moving their capital and/or profits to altcoins in a quest for higher returns, which usually triggers an explosion of altcoin rallies.
추천 기사


