


The Dow Jones Industrial Average kept what payrolls lost
- DJIA holds near 54,000 inside a range of barely 200 points.
- Labour's share of output fell to 52.9%, the lowest since 1947.
- Crude Oil trades roughly 3% higher near $81 on Hormuz doubts.
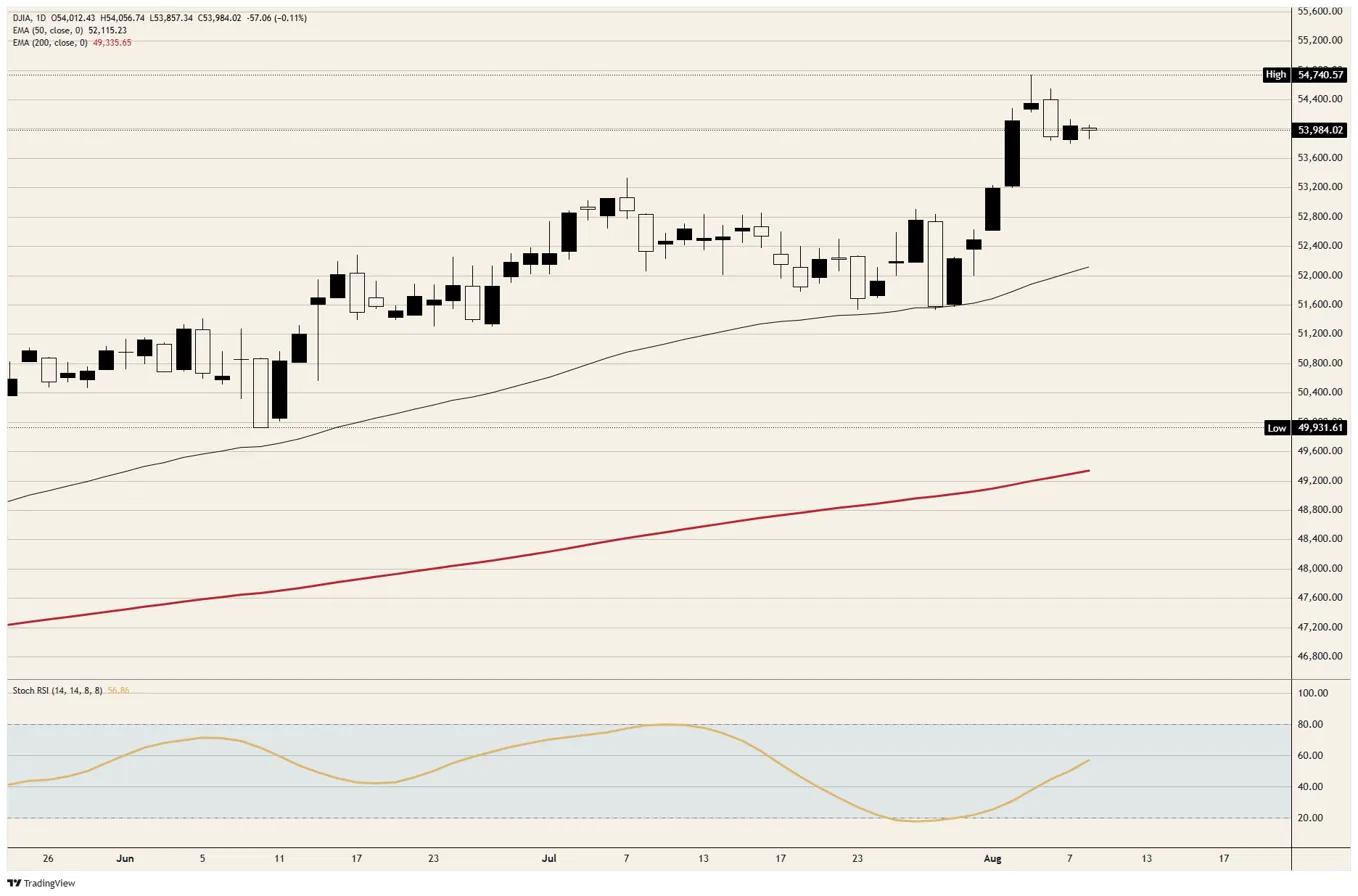
The Dow Jones Industrial Average trades near 54,000 on Monday, lower by a tenth of a percent inside a range of barely 200 points, the narrowest daily bar in weeks. Every price of the session sits inside Friday's range, and Friday's sat inside Thursday's. The index is neither extending last week's record nor handing it back. It is waiting for Wednesday.
The largest single-name move of the session belongs to a company outside the average, which is the shape most sessions have taken lately. Intel (INTC) fell 3% after saying it would sell 15 billion Dollars of common stock, and none of that reaches the index. The insulation ran the other way on Tuesday, when the day's biggest gainer contributed nothing either.
Labour's smallest share since 1947
Thursday's second-quarter productivity report carried the number of the week and almost nobody printed it. The labour share, meaning the portion of output reaching workers as compensation, fell to 52.9%, the lowest reading in a series that starts in 1947. Unit non-labour payments, the other half of the same ledger, rose 14% at an annual rate.
An index printing records while payrolls contract is not a contradiction in need of explaining away. Equity is a claim on precisely the share of output that expanded, and the workforce holds the share that shrank. Friday's payroll contraction and last week's high are one piece of arithmetic read from opposite ends, which is how the tape absorbed both inside four sessions without breaking stride.
Wages are not the inflation
The complaint in circulation, that disappointing productivity explains why workers keep losing ground, does not survive the release it is drawn from. Output per hour rose 1.4% in the quarter and 2.2% from a year earlier, and the current cycle has compounded at 2.1% a year, matching the long-run rate that has held since 1947. Hourly compensation rose 2.7% and fell 3.1% once consumer prices come out of it.
Unit labour costs rose 1.3% on the same page, which is the awkward line for a committee holding rates against an inflation it cannot trace to pay. The value-added price deflator on that release ran near 7% at an annual rate against those labour costs, leaving energy, tariffs and margin to account for the gap. Wednesday's print will be argued as a labour-market story and it is not one.
Only Crude Oil sold the peace back
West Texas Intermediate Crude Oil trades roughly 3% higher near $81 and Brent above the $86 handle, against a Dow moving a tenth of a percent. Iran's foreign minister ruled out restarting talks until Washington answers for what Tehran calls breaches of June's framework, and the president spent the weekend telling an interviewer that the United States is only half negotiating and wants Iran under economic pressure.
The pressure is administrative rather than rhetorical, and it ran through the financial system again on Friday, when Washington's sanctions office issued two fresh Iranian designations, the eighth action this year aimed at the shadow banking apparatus. The body Tehran created to charge tolls for safe passage through the Strait was itself designated in May, so an Oman-brokered reopening that leaves Iran directing traffic runs through a sanctioned counterparty. That is the half of the trade equities bought at 54,740 last week and have not sold back.
The rates market took the same headlines more seriously than the equity market did. A quarter-point increase on 16 September now prices at 49.9% against 50.1% for a hold, up from 44.1% on Friday, and 28 October has firmed to 76.5%. December still gives the current range no chance at all, and the second increase that Friday's payroll contraction was supposed to have buried is back at 24.1%, from 14.4% in a single session.
The data week
July's Consumer Price Index (CPI) lands on Wednesday at 12:30 GMT, forecast at 0.1% MoM against a 0.4% decline in June, the annual rate easing to 3.4% from 3.5%, core at 0.2% MoM and 2.5% YoY. That print measures a month already stale against a barrel 3% higher today, which is the standing problem with reading the war out of backward-looking data.
Thursday carries the Producer Price Index (PPI) at 0.2% MoM against a 0.3% decline, core at 4.2% YoY from 4.7%, and jobless claims at 201K. Two regional Federal Reserve presidents speak inside half an hour that morning, one of them among the three who dissented for a quarter-point increase in July. Friday brings retail sales at 0.2% and a Michigan sentiment reading seen falling to 54, its inflation expectations last at 4.2% one year out and 3.3% over five. Those three releases decide which side of that coin September lands on.
Levels and bias
Resistance: Just above 54,000 has stalled each of the last two sessions, with the 54,100 area capping Friday. Above them the record just short of 54,750 is the only structure left on the chart.
Support: The 53,800 area has floored three consecutive sessions and is the line the week turns on. Beneath it the tape thins toward 53,500, with nothing structural until the 50-day Exponential Moving Average (EMA) near 52,100.
Bias: Bullish while the 53,800 area holds, with the record just short of 54,750 as the objective and a daily Stochastic Relative Strength Index (Stoch RSI) near 57 carrying room above it. A daily close beneath 53,800 turns three sessions of contraction into a failed breakout and opens 53,500.
Dow Jones daily chart
Dow Jones FAQs
The Dow Jones Industrial Average, one of the oldest stock market indices in the world, is compiled of the 30 most traded stocks in the US. The index is price-weighted rather than weighted by capitalization. It is calculated by summing the prices of the constituent stocks and dividing them by a factor, currently 0.152. The index was founded by Charles Dow, who also founded the Wall Street Journal. In later years it has been criticized for not being broadly representative enough because it only tracks 30 conglomerates, unlike broader indices such as the S&P 500.
Many different factors drive the Dow Jones Industrial Average (DJIA). The aggregate performance of the component companies revealed in quarterly company earnings reports is the main one. US and global macroeconomic data also contributes as it impacts on investor sentiment. The level of interest rates, set by the Federal Reserve (Fed), also influences the DJIA as it affects the cost of credit, on which many corporations are heavily reliant. Therefore, inflation can be a major driver as well as other metrics which impact the Fed decisions.
Dow Theory is a method for identifying the primary trend of the stock market developed by Charles Dow. A key step is to compare the direction of the Dow Jones Industrial Average (DJIA) and the Dow Jones Transportation Average (DJTA) and only follow trends where both are moving in the same direction. Volume is a confirmatory criteria. The theory uses elements of peak and trough analysis. Dow’s theory posits three trend phases: accumulation, when smart money starts buying or selling; public participation, when the wider public joins in; and distribution, when the smart money exits.
There are a number of ways to trade the DJIA. One is to use ETFs which allow investors to trade the DJIA as a single security, rather than having to buy shares in all 30 constituent companies. A leading example is the SPDR Dow Jones Industrial Average ETF (DIA). DJIA futures contracts enable traders to speculate on the future value of the index and Options provide the right, but not the obligation, to buy or sell the index at a predetermined price in the future. Mutual funds enable investors to buy a share of a diversified portfolio of DJIA stocks thus providing exposure to the overall index.
추천 기사


