


Crypto Today: Bitcoin, Ethereum, XRP rally slows amid rising ETF inflows
- Bitcoin holds above $85,000 as the broader cryptocurrency market moderates after early-week spikes.
- Ethereum remains in bullish hands despite a minor correction from its monthly high around $2,800.
- XRP bulls defend higher support as they build on a strong technical structure with uptrending moving averages.
The cryptocurrency market remains elevated on Tuesday, with Bitcoin (BTC) trading around $85,798, nearly 49% above the year low of $57,756. Ethereum (ETH) and Ripple (XRP) trade within a robust bullish outlook above $2,700 and $1.51, respectively. A minor correction followed Monday's gains, suggesting increased profit-taking ahead of a potential continuation of the uptrend.
Market sentiment improves as Bitcoin and Ethereum ETFs post inflows
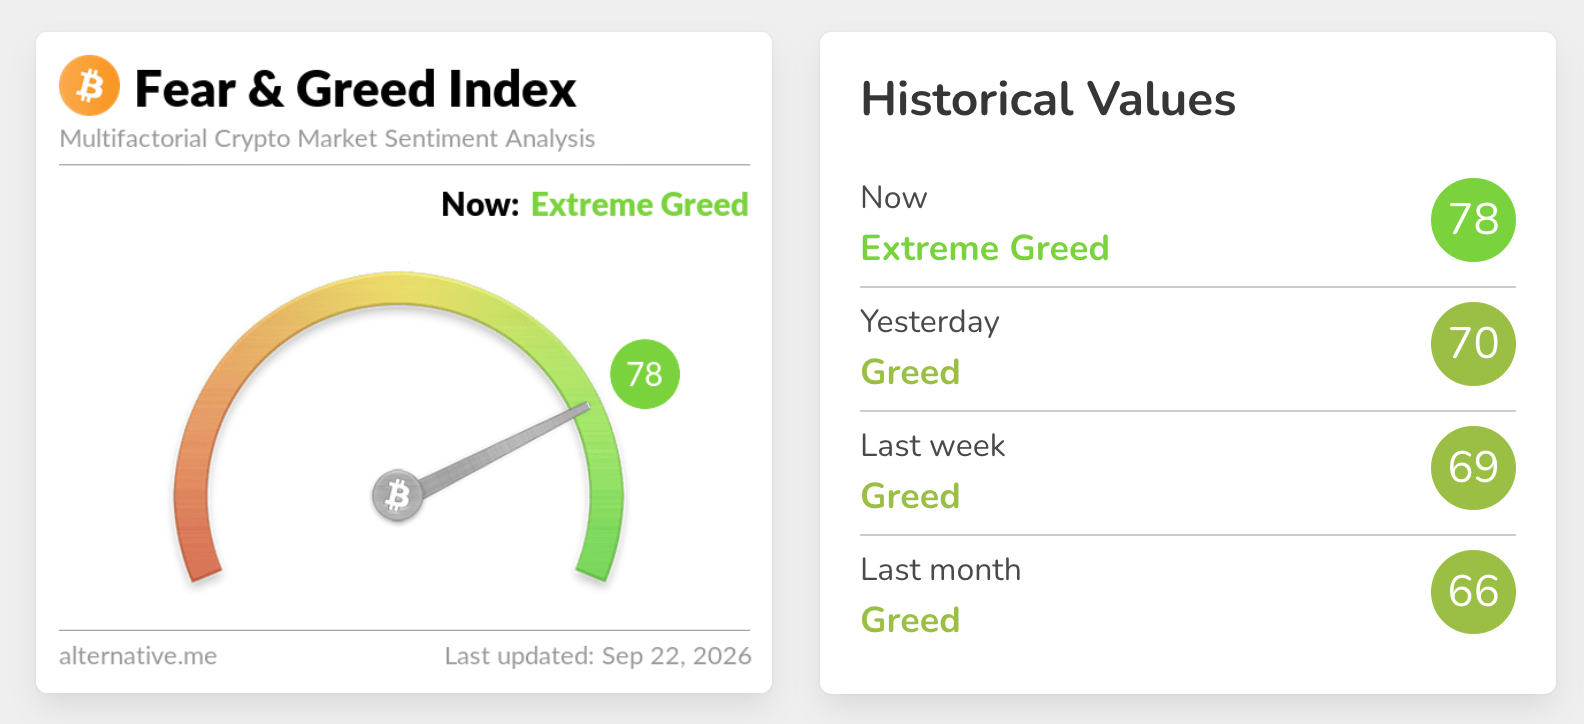
The crypto Fear & Greed Index edged higher to 78 on Monday, up from 70 the previous day and 66 the day before. This setup reinforces the bullish outlook, as market sentiment strengthens. Still, Extreme Greed territory suggests the crypto market’s uptrend is overextended, and a correction could be nigh. Therefore, investors should tread with caution as profit-taking may trigger a pullback before the next major leg up.
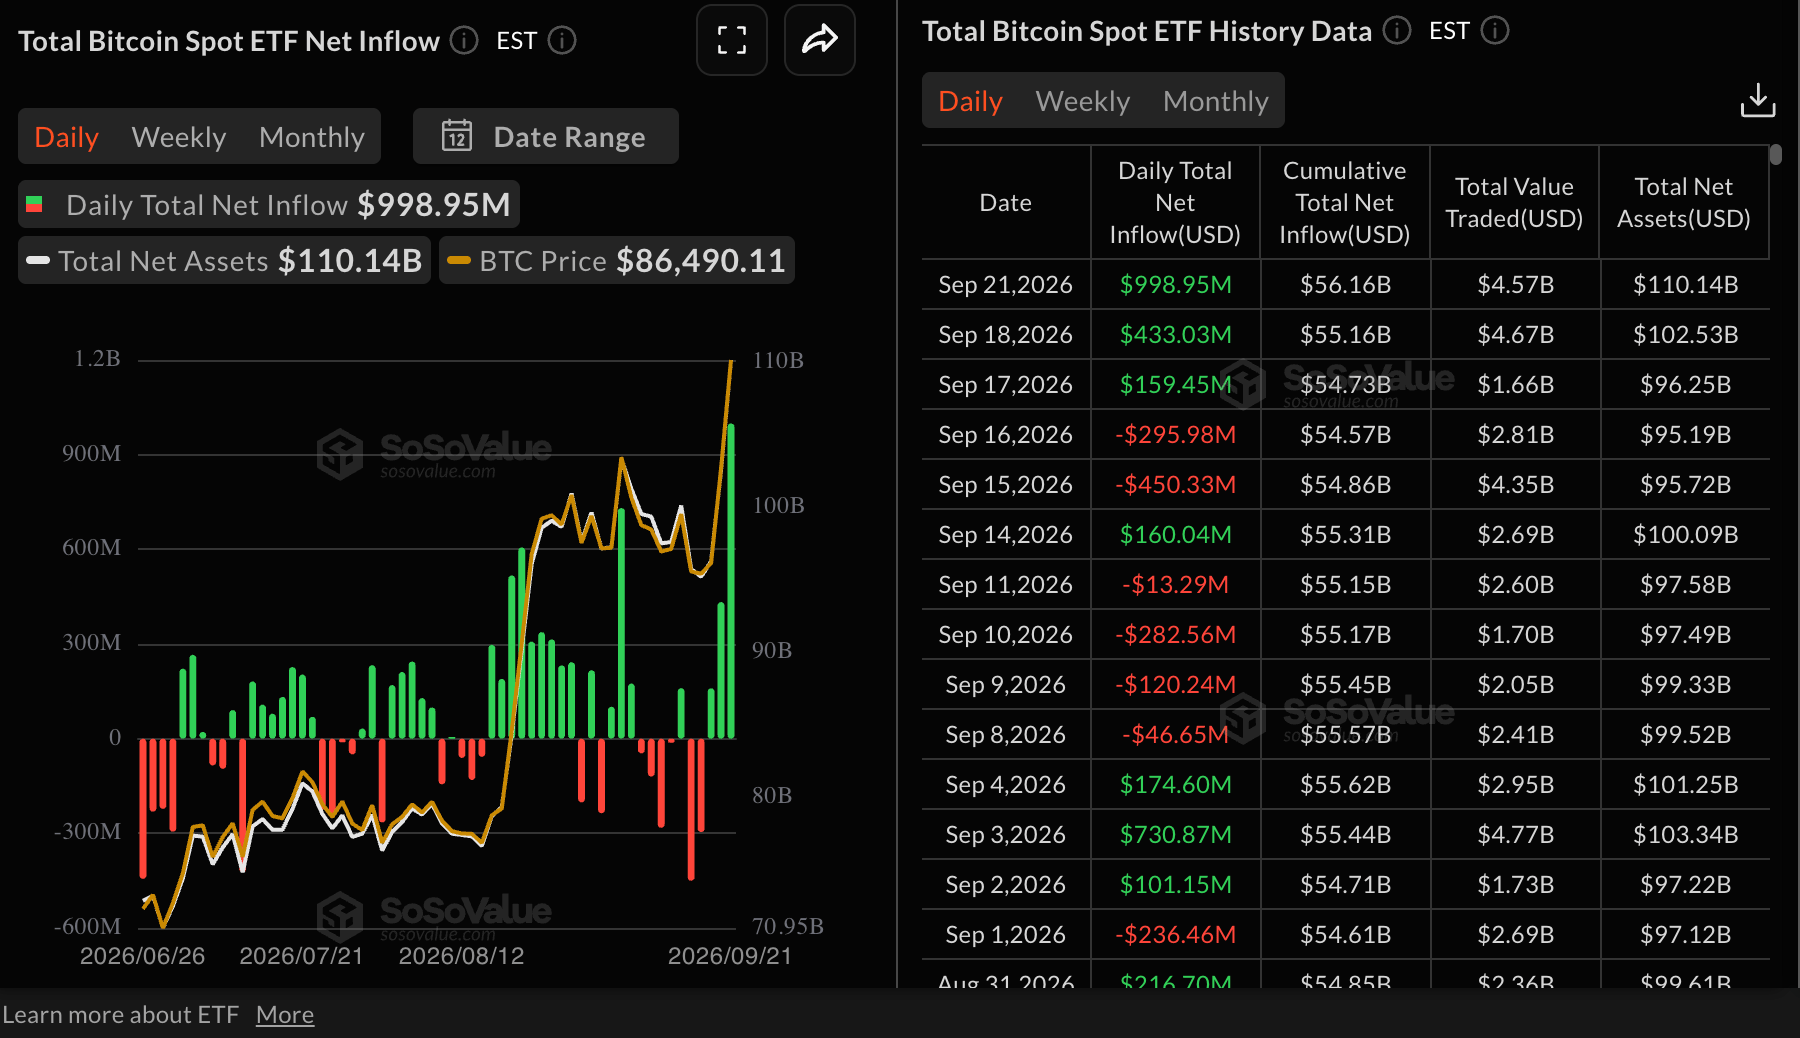
Institutional interest in Bitcoin extended on Monday, with spot Exchange-Traded Funds (ETFs) recording $999 million in inflows, up from $433 million last Friday. Cumulative inflows currently stand at approximately $56 billion, while net assets under management average $110 billion, according to SoSoValue.
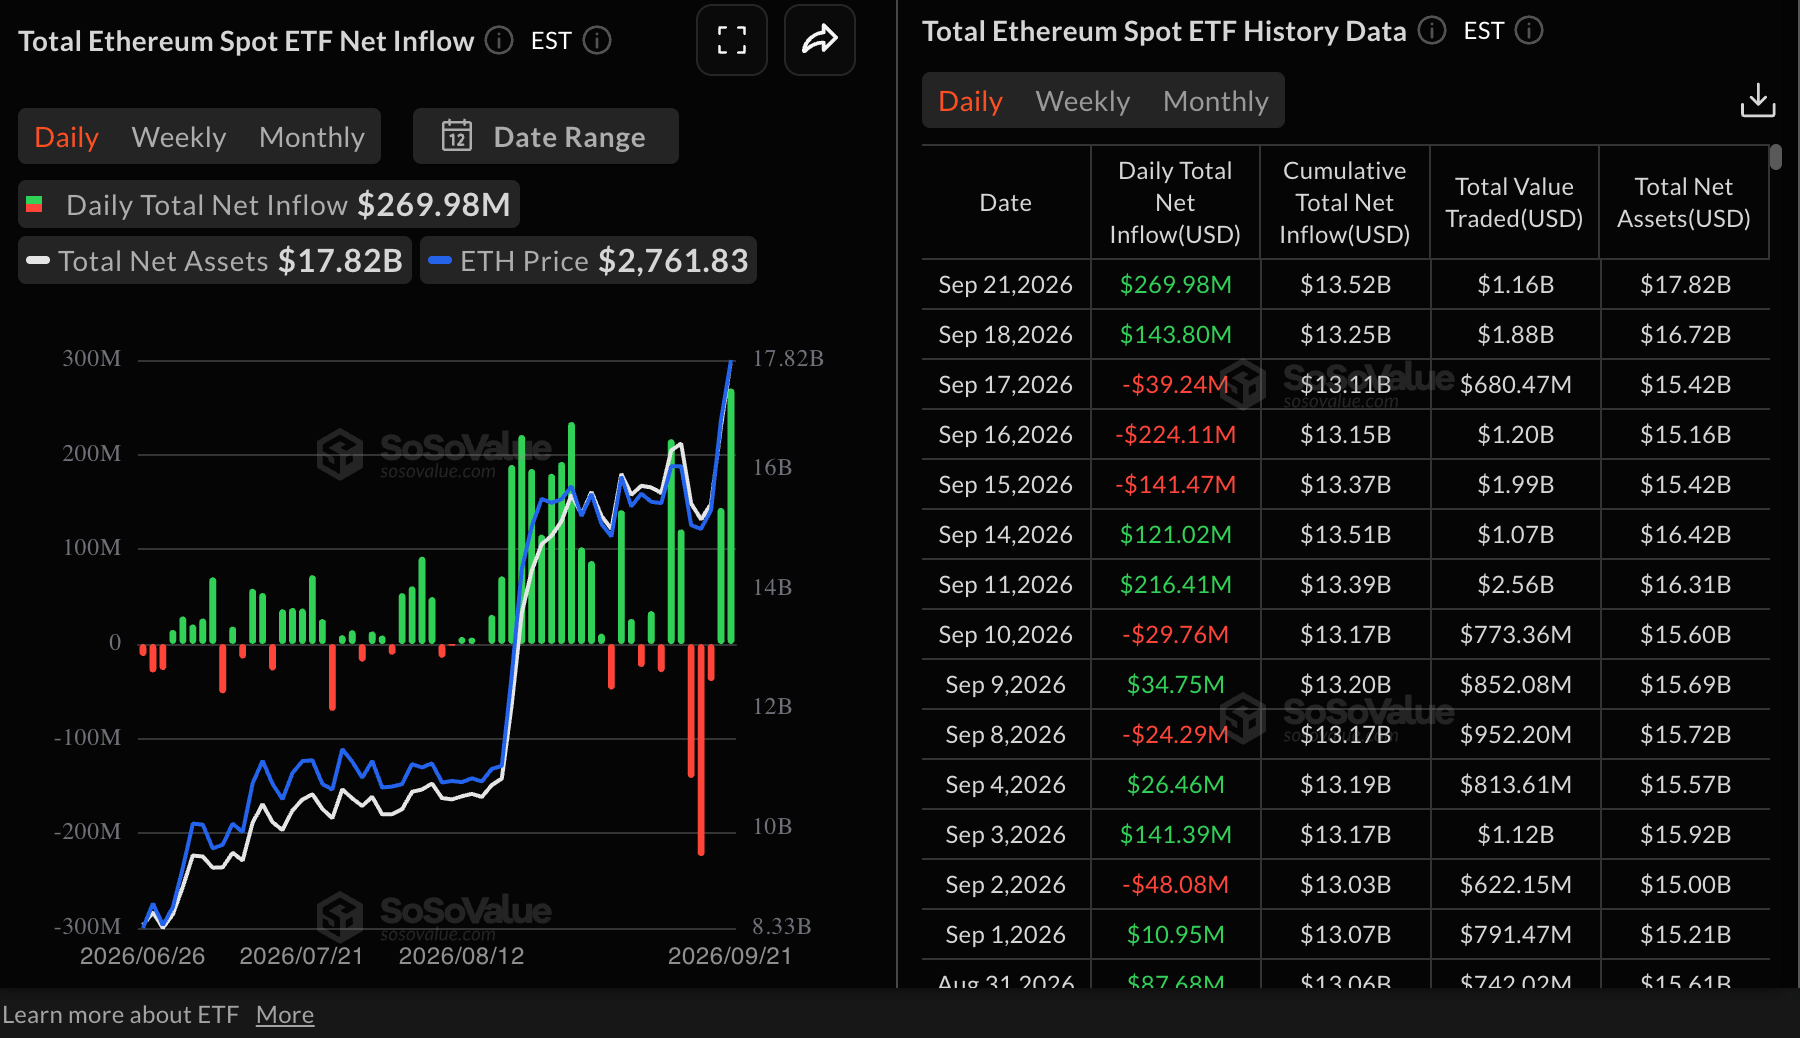
Ethereum spot ETFs similarly attracted $270 million in inflows on Monday, up from $144 million last Friday. SoSoValue data shows the nearest $14 billion in cumulative inflows, while net assets under management hold at roughly $18 billion.
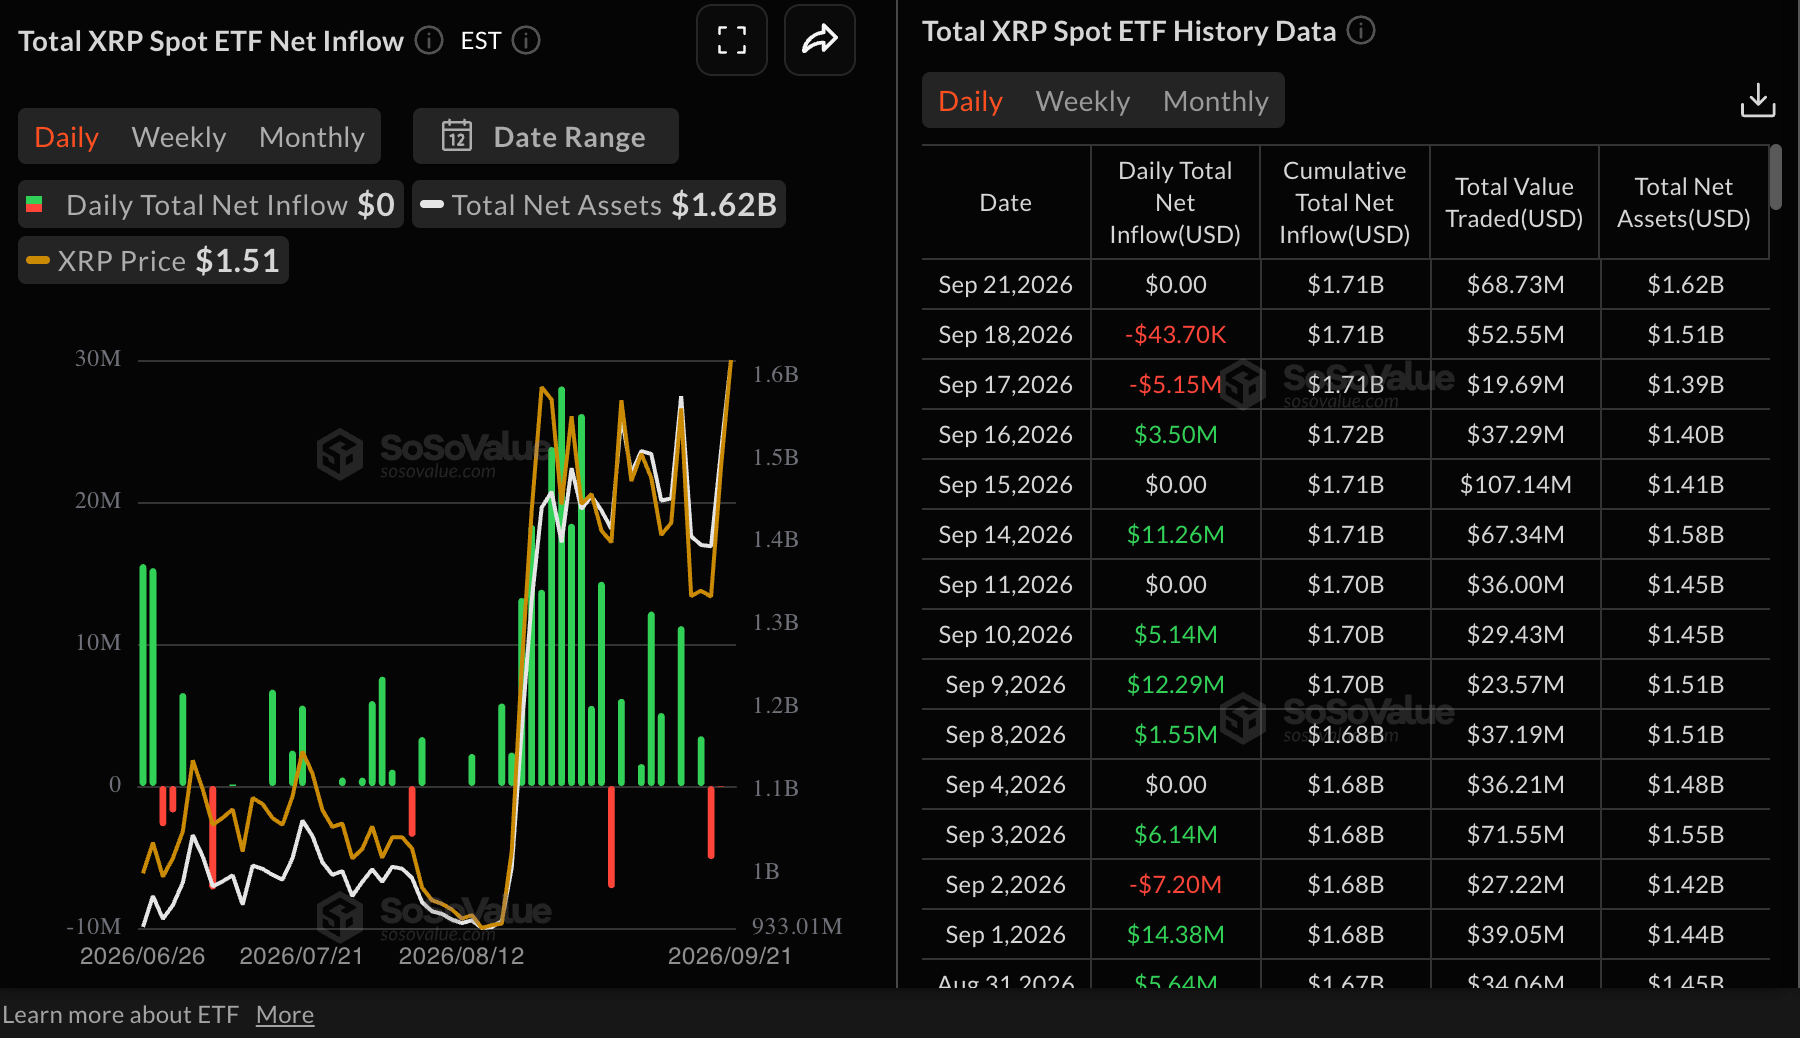
As for XRP, US-listed spot ETFs saw no activity on Monday after mild withdrawals of $44,000 last Friday. Despite low appetite for the remittance token in the past few days, institutions have collectively deposited $1.7 billion in spot XRP ETFs, with net assets averaging $1.62 billion.
Technical analysis: Bitcoin holds higher support
Bitcoin trades at $85,546, maintaining a clear bullish bias as price holds above the reclaimed downward resistance trendline around $80,873 and a rising SuperTrend support near $78,333. The advance is further underpinned by a constructive alignment of Exponential Moving Averages (EMAs) all sitting well below spot, suggesting a firmly supported uptrend, while the Moving Average Convergence Divergence (MACD) histogram remains positive and the Relative Strength Index (RSI) hovers just below overbought territory, hinting that bullish momentum is strong but becoming stretched.
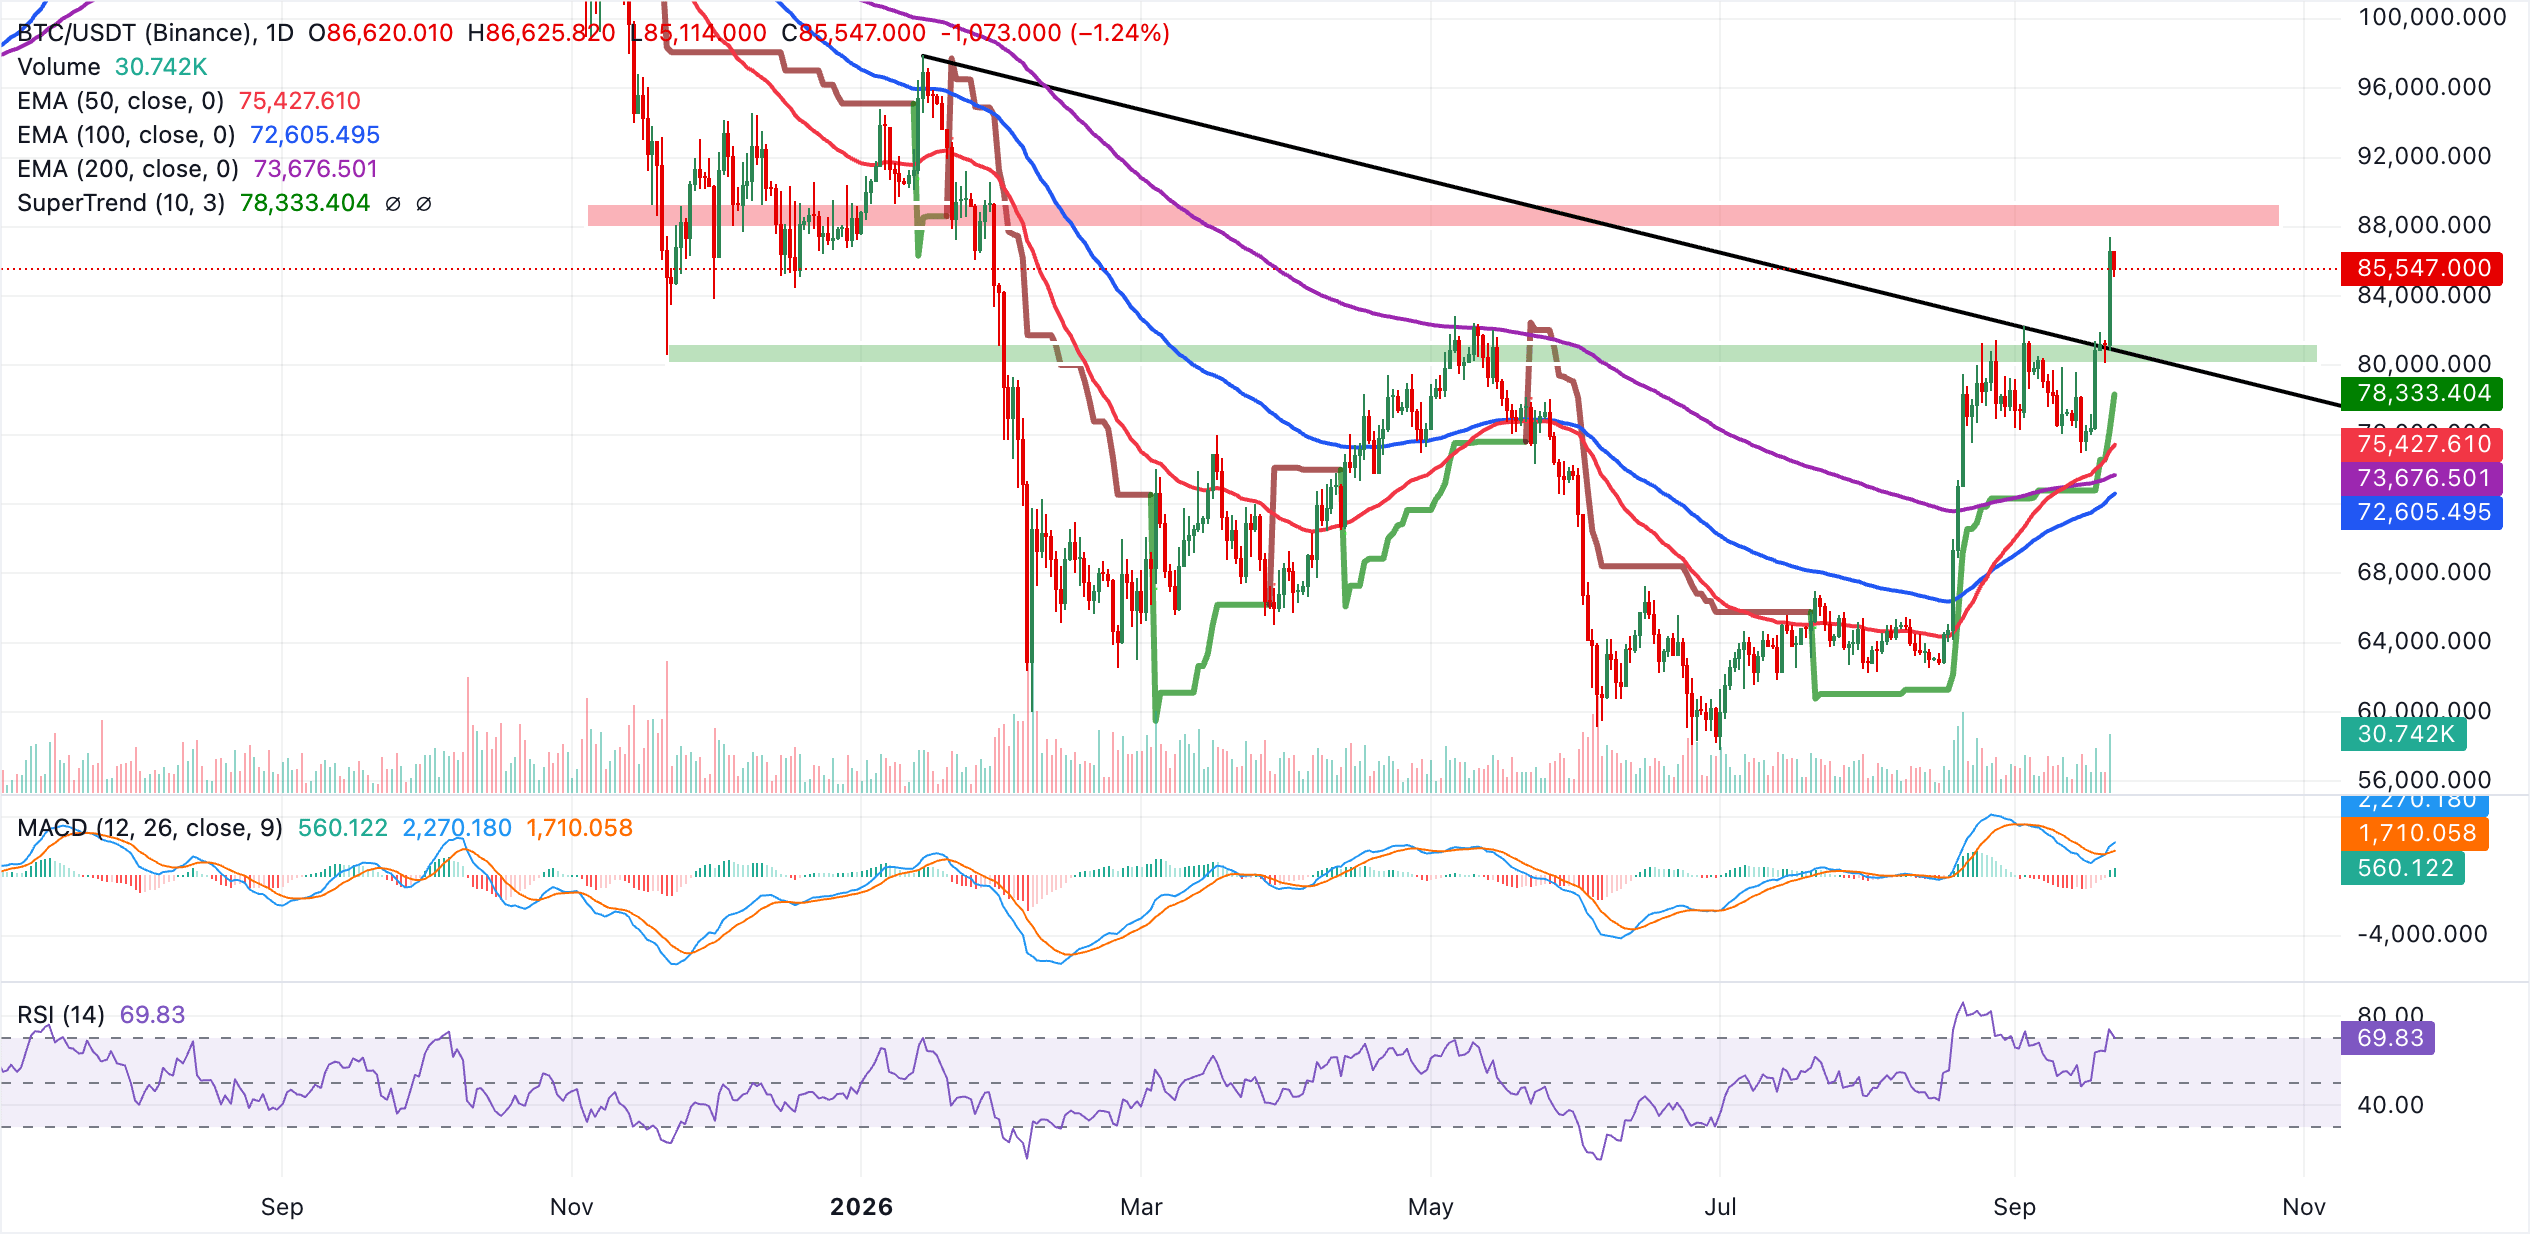
Initial support lies at the former trendline break level around $80,873, followed by the SuperTrend base at $78,333, with deeper cushions provided by the 50-day EMA at $75,428 and the 200-day EMA at $73,677 before the 100-day EMA at $72,605.
As long as BTC holds above this stacked support cluster, the near-term technical tone stays constructive, though the elevated RSI warns that any push higher from current levels could trigger profit-taking rather than a clean continuation.
Altcoins technical analysis: Ethereum and XRP recovery cools
Ethereum trades at $2,733, extending its advance well above the main moving averages and sustaining a bullish near-term bias. Price holds comfortably above the 50-day EMA near $2,355, the 100-day EMA at $2,211, and the 200-day EMA around $2,234, suggesting a well-supported uptrend.
The SuperTrend line, now rising from roughly $2,434, sits below spot and reinforces the constructive structure. Momentum indicators back this tone, with the RSI hovering near 68 in a strong-but-not-yet-extreme region, while the MACD remains positive with the line above its signal and a growing positive histogram, hinting at persistent buying pressure.
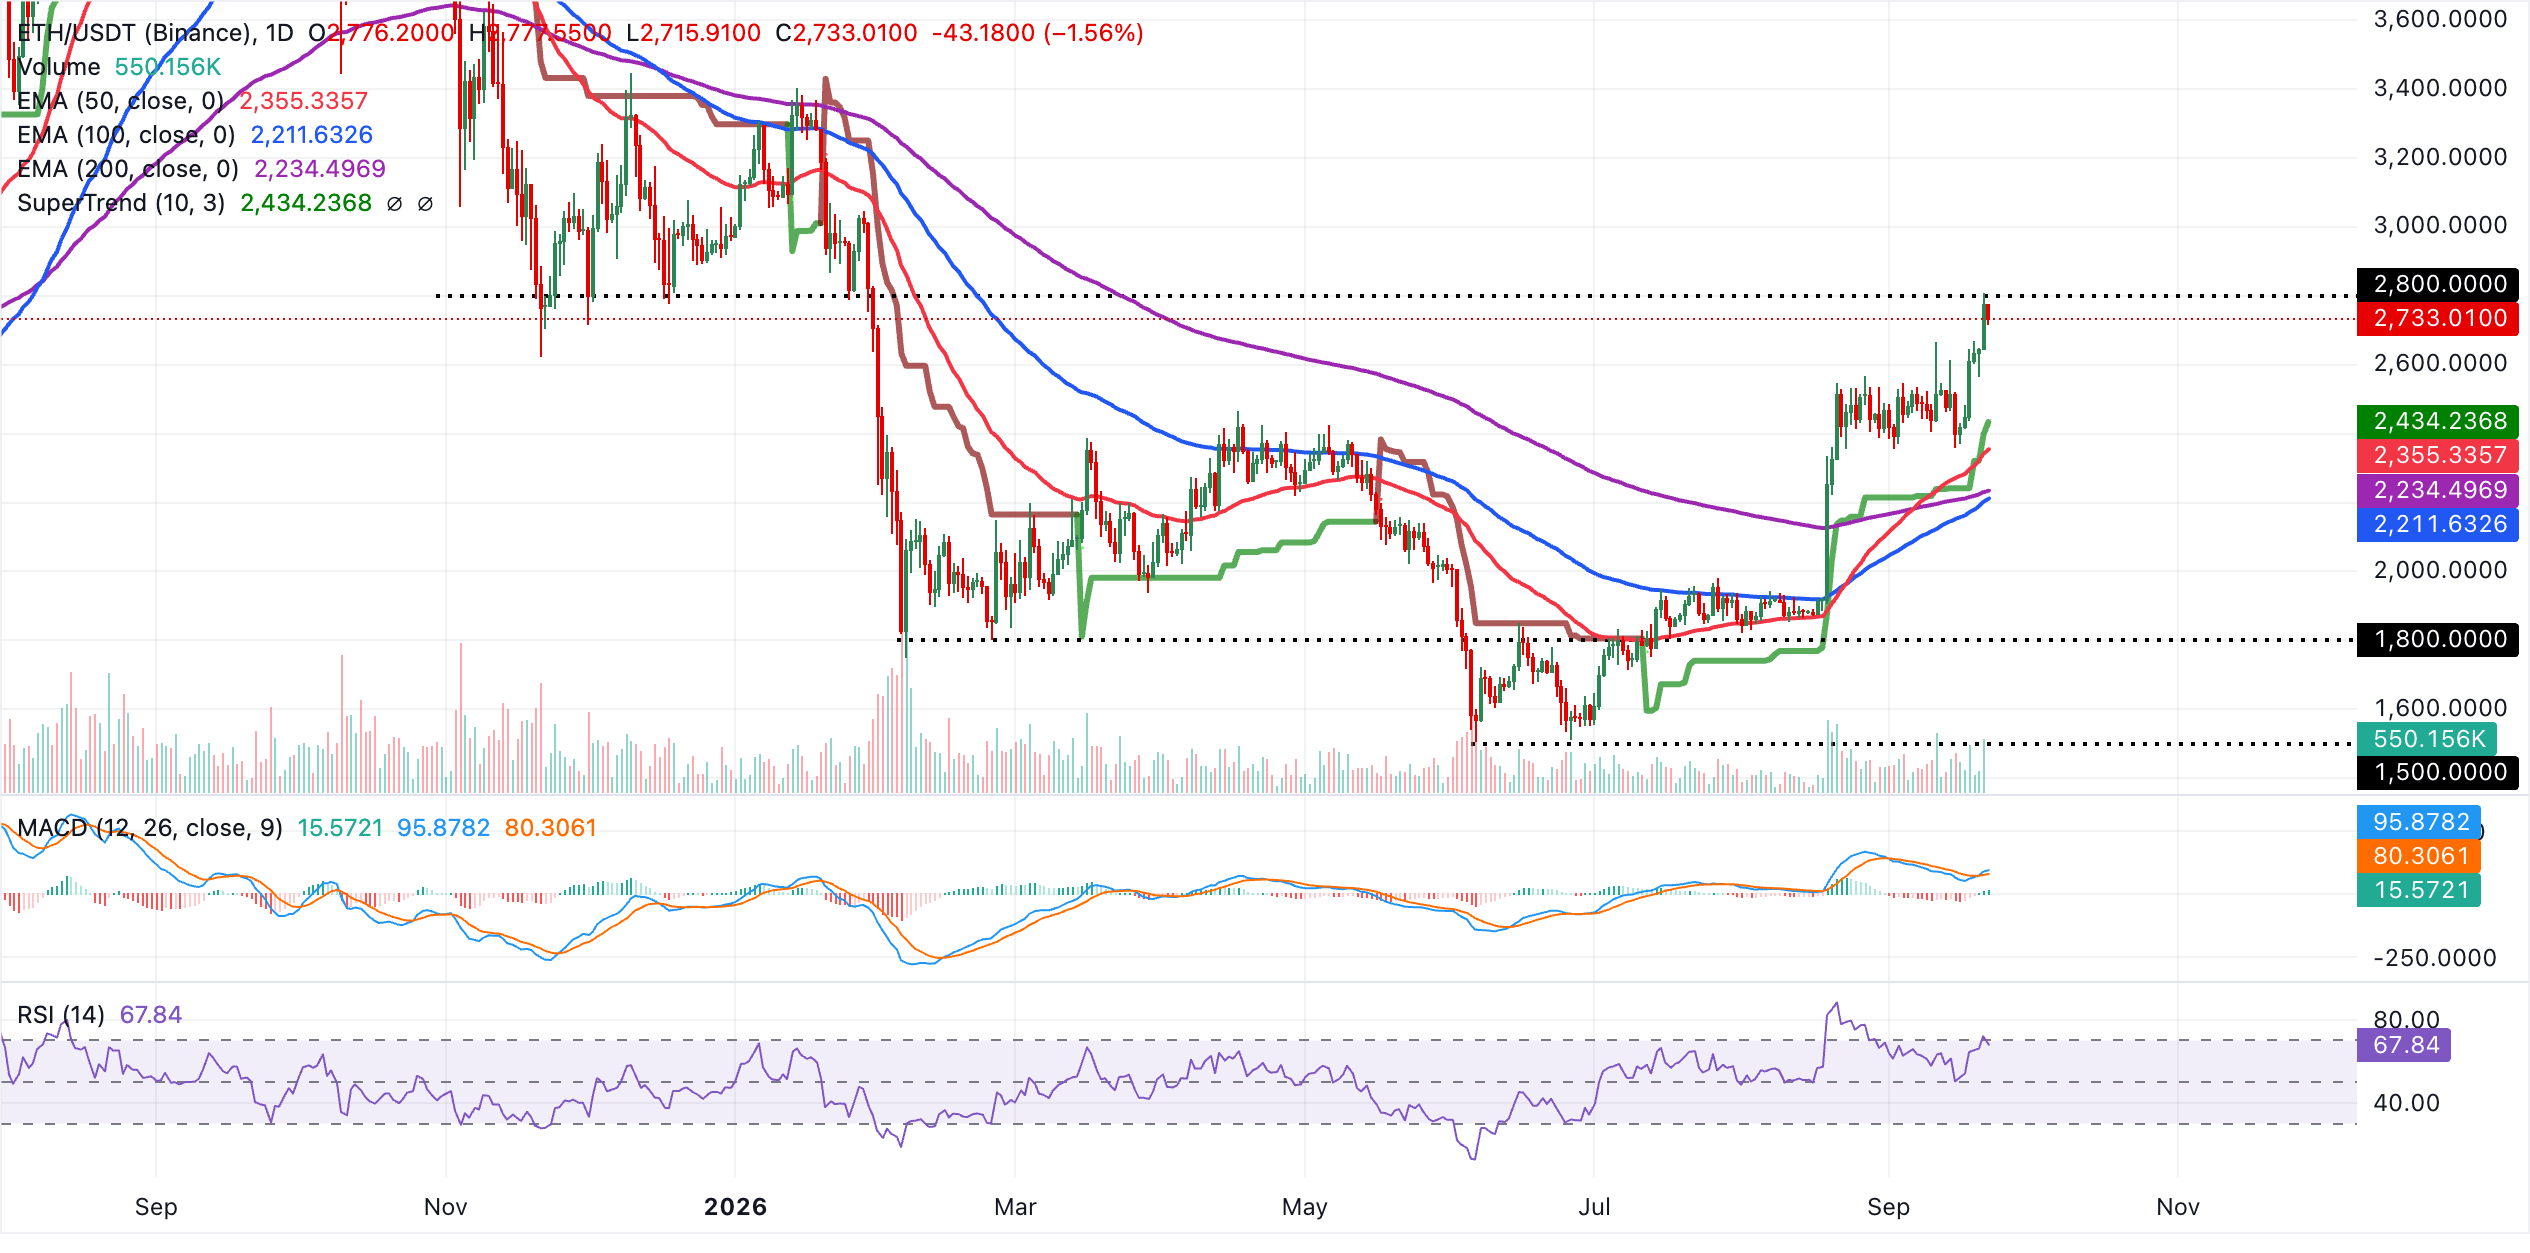
On the downside, initial support lies at the recent pivot area around $2,733, followed by a more technical floor at the SuperTrend level near $2,434. Below that, the 50-day EMA at approximately $2,355 offers additional demand, while deeper setbacks would likely target the 200-day EMA around $2,234 and the 100-day EMA at $2,211 as more strategic medium-term support. With no clear overhead reference from the daily chart, the pair’s topside remains open, and the market would need a decisive break back below the clustered moving averages to challenge the prevailing bullish structure.
XRP, meanwhile, trades at $1.53, extending its advance well above the key moving averages, which keeps the near-term bias bullish. The 50-day, 100-day, and 200-day EMAs sit comfortably below spot, suggesting a broadly supportive trend backdrop.
The SuperTrend line at $1.26 further reinforces the underlying demand, while the RSI at 65 shows firm positive momentum, edging toward overbought territory. The MACD histogram is positive, suggesting bullish pressure remains.
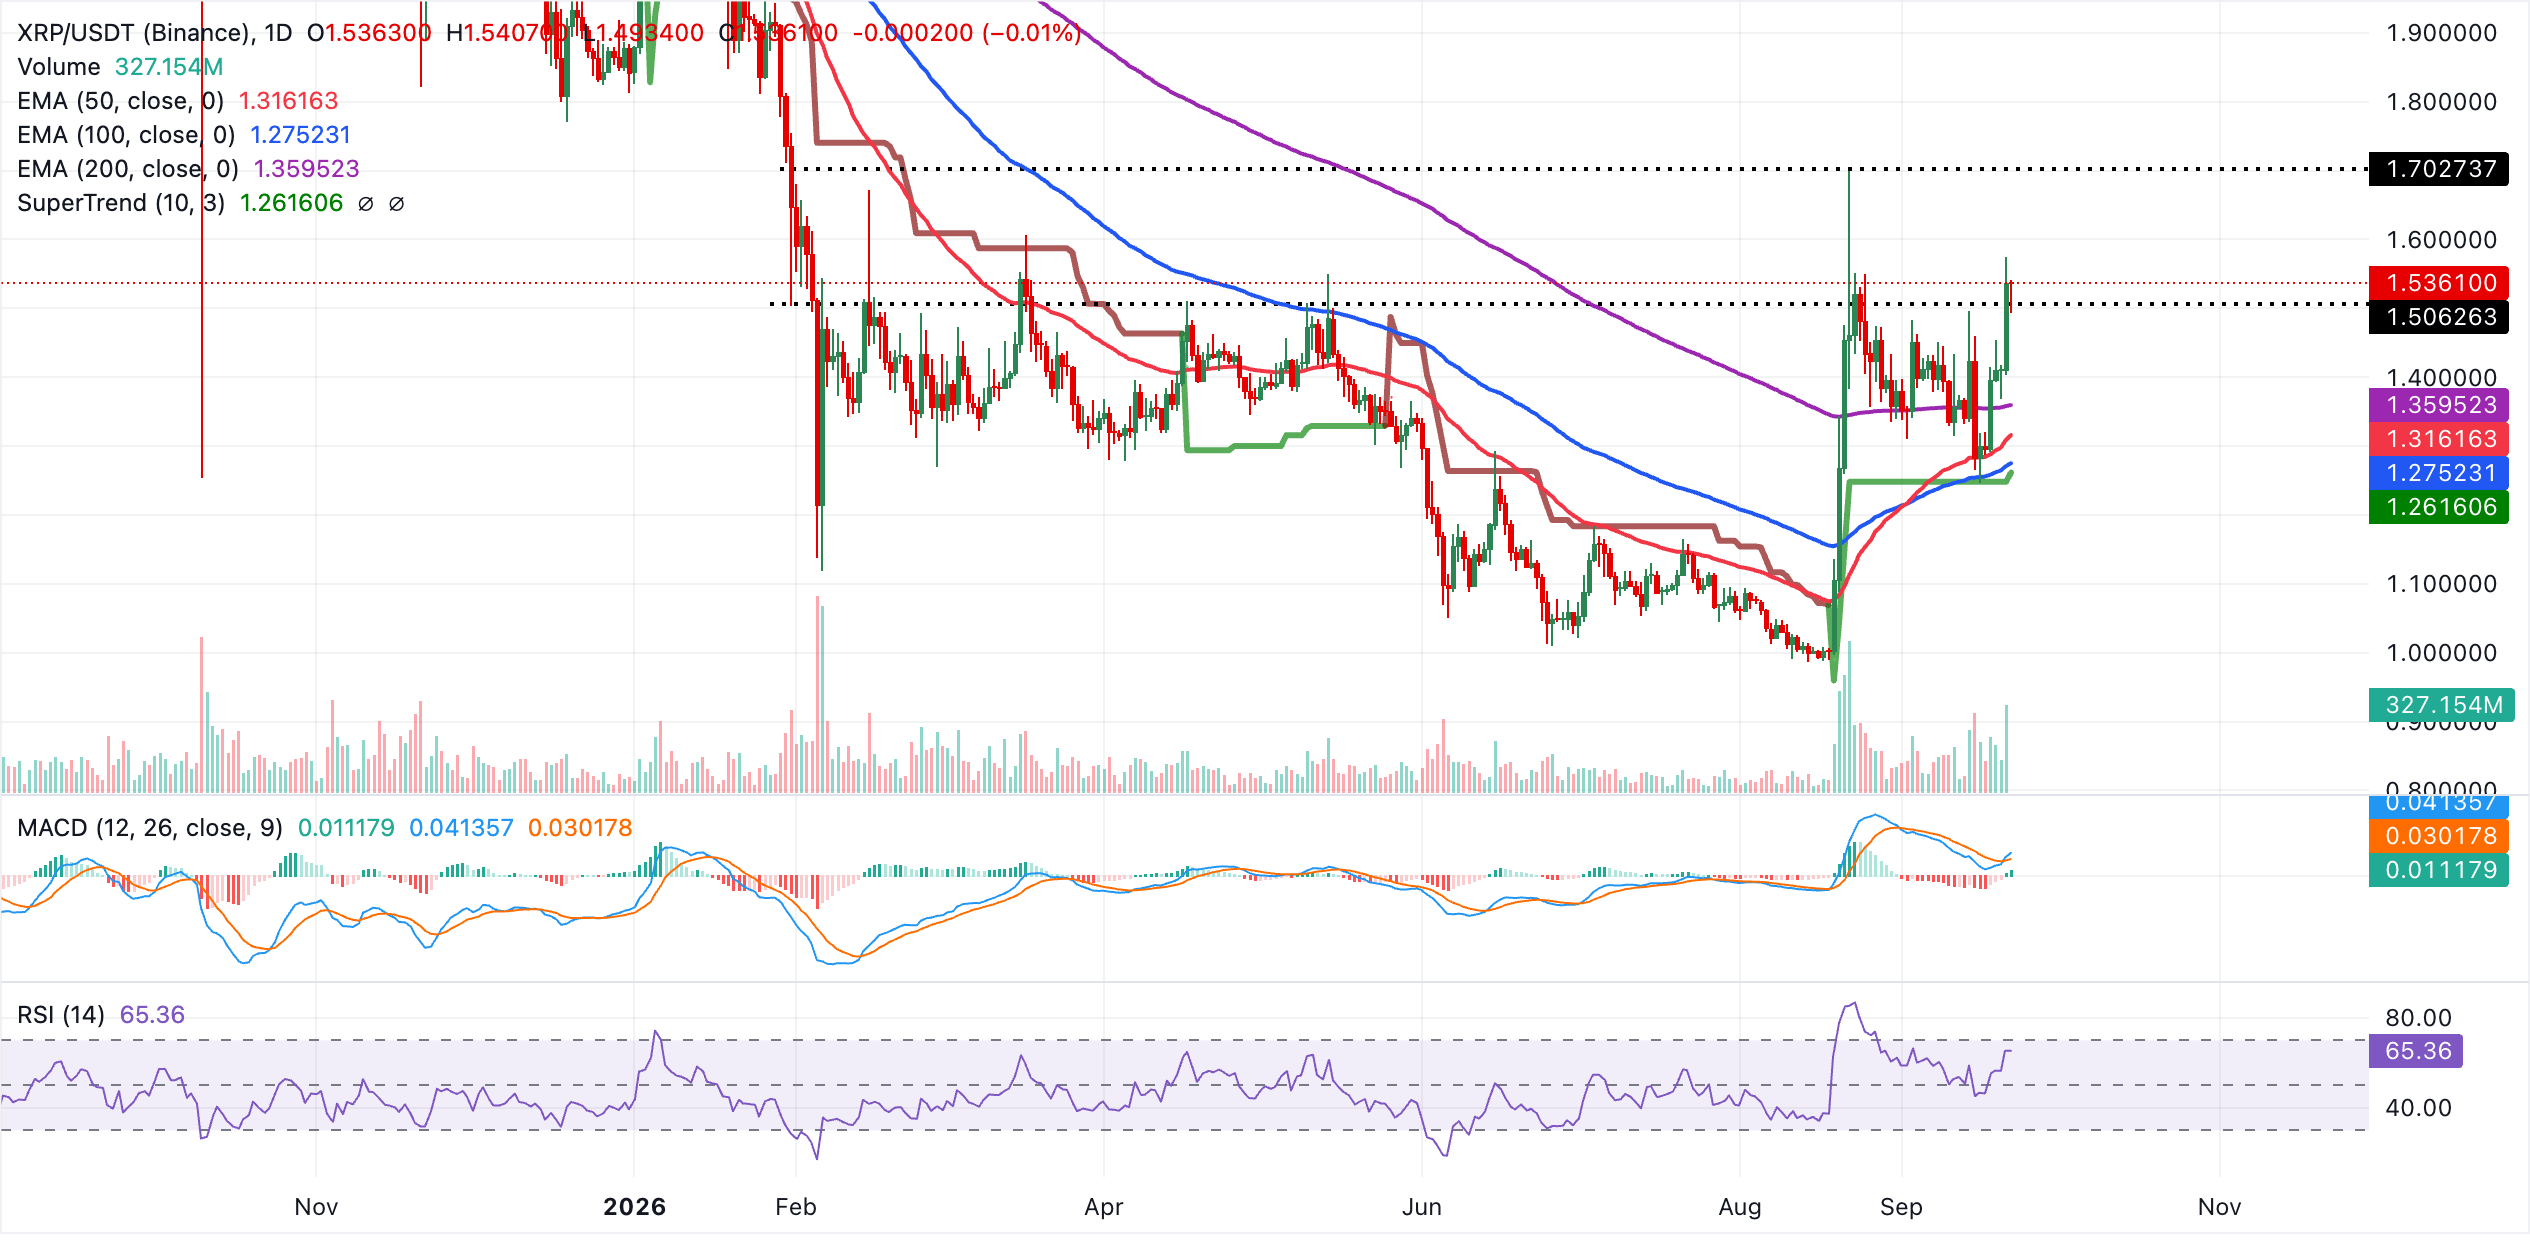
On the downside, initial support is at the 200-day EMA near $1.36, followed by the 50-day EMA around $1.32, where buyers could defend the broader uptrend on any pullback. Deeper losses would expose the 100-day EMA at about $1.28 and the SuperTrend level at $1.26 as the next structural cushions. With no immediate overhead resistance from the provided indicators on the daily chart, XRP's ability to hold above this clustered support band will likely determine whether the current bullish phase extends or slips into broader consolidation.
(The technical analysis of this story was written with the help of an AI tool. Know more.)
Bitcoin, altcoins, stablecoins FAQs
Bitcoin is the largest cryptocurrency by market capitalization, a virtual currency designed to serve as money. This form of payment cannot be controlled by any one person, group, or entity, which eliminates the need for third-party participation during financial transactions.
Altcoins are any cryptocurrency apart from Bitcoin, but some also regard Ethereum as a non-altcoin because it is from these two cryptocurrencies that forking happens. If this is true, then Litecoin is the first altcoin, forked from the Bitcoin protocol and, therefore, an “improved” version of it.
Stablecoins are cryptocurrencies designed to have a stable price, with their value backed by a reserve of the asset it represents. To achieve this, the value of any one stablecoin is pegged to a commodity or financial instrument, such as the US Dollar (USD), with its supply regulated by an algorithm or demand. The main goal of stablecoins is to provide an on/off-ramp for investors willing to trade and invest in cryptocurrencies. Stablecoins also allow investors to store value since cryptocurrencies, in general, are subject to volatility.
Bitcoin dominance is the ratio of Bitcoin's market capitalization to the total market capitalization of all cryptocurrencies combined. It provides a clear picture of Bitcoin’s interest among investors. A high BTC dominance typically happens before and during a bull run, in which investors resort to investing in relatively stable and high market capitalization cryptocurrency like Bitcoin. A drop in BTC dominance usually means that investors are moving their capital and/or profits to altcoins in a quest for higher returns, which usually triggers an explosion of altcoin rallies.
추천 기사


