


Bitcoin Price Forecast: BTC pauses rally as profit-taking reaches yearly high
- Bitcoin pulls back, trading below $85,500 on Tuesday after surging 6.7% and reaching $87,395 the previous day.
- US-listed spot Bitcoin ETFs recorded nearly $1 billion in inflows on Monday, while Strategy added 950 BTC to its treasury holdings.
- BTC’s NPL metric spiked to a one-year high, signaling increased profit-taking activity following the sharp price rally.
Bitcoin (BTC) takes a breather, facing a pullback, trading below $85,500 at the time of writing on Tuesday after surging 6.7% the previous day. Strong institutional demand supports the bullish price action, with spot Bitcoin Exchange Traded Funds (ETFs) recording nearly $1 billion in inflows on Monday and Strategy (MSTR) adding 950 BTC to its treasury. However, a sharp rise in BTC’s Network Realized Profit/Loss (NPL) metric to a one-year high points to increased profit-taking following the Crypto King’s latest price surge, potentially adding near-term pressure.
Profit booking activity pauses BTC gains
Santiment’s Network Realized Profit/Loss (NPL) metric indicates Bitcoin holders are booking profits as the Crypto King price surges to its highest level since the end of January, hitting $87,395 on Monday.
As shown in the chart below, the metric spiked sharply on Monday, reaching its highest level since December 12, 2025. This spike indicates that holders are, on average, selling their bags at a significant profit, thereby increasing the selling pressure.
 [10-1790058698124.33.18, 22 Sep, 2026].png)
Institutional demand remains strong
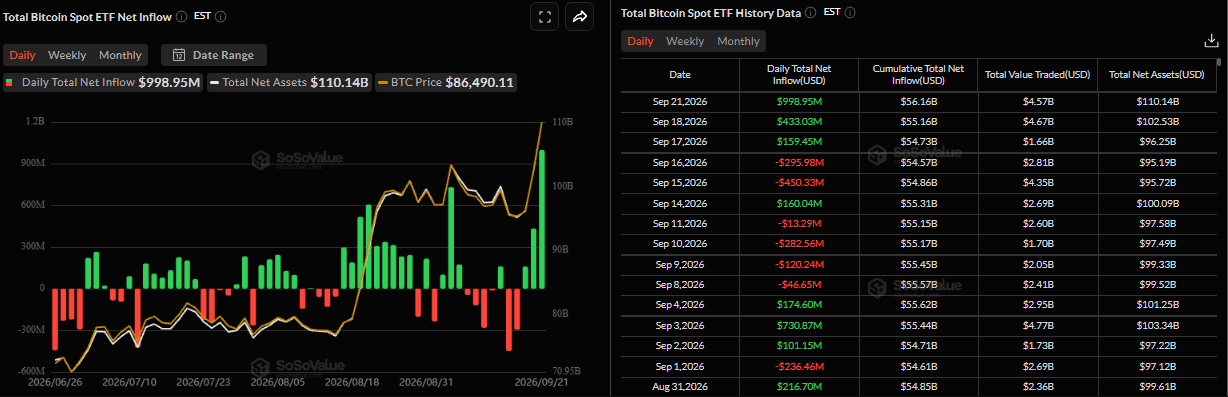
Despite sharp profit-taking, institutional demand for BTC continues to strengthen. SoSoValue data showed spot Bitcoin ETFs recorded an inflow of $998.95 million on Monday, marking the third consecutive day of inflows since last week. Moreover, Monday’s inflows were the highest single-day positive flows since $875.61 million on October 7, 2025, the day after BTC reached a record high of $126,199. If these inflows continue and intensify through the week, BTC could extend the ongoing rally.
On the corporate side, Michael Saylor announced on Monday that his firm, Strategy, acquired 950 BTC, bringing total holdings to 846,000 BTC. In addition, the company repurchased $174 million of Stretch (STRC), bringing total reserves to $6.09 billion in USD Assets.
The move suggests Saylor’s company may be returning to its familiar approach of aggressively accumulating BTC after spending much of the summer strengthening its liquidity position, supporting a bullish outlook for BTC.

Bitcoin technical outlook: BTC holds a bullish structure
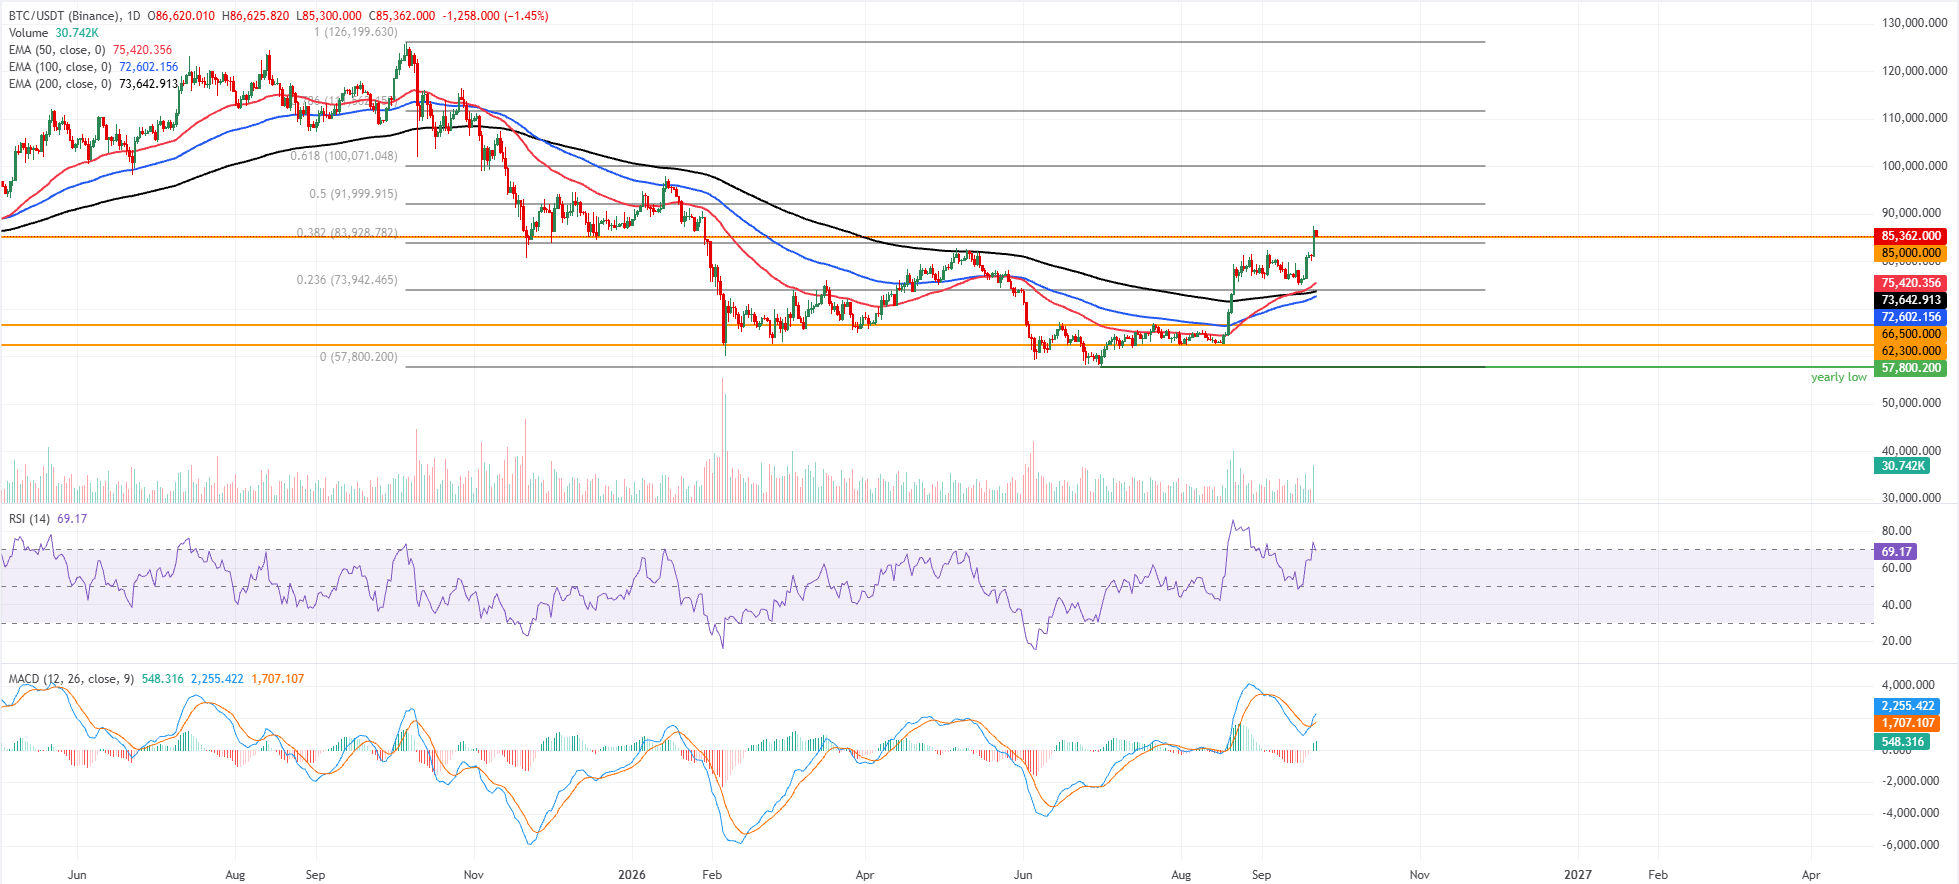
Bitcoin price trades at $85,363 on Tuesday, after surging over 6% the previous day. The Crypto King maintains a bullish bias as price holds well above the 50-day, 100-day, and 200-day Exponential Moving Averages (EMAs) clustered between roughly $72,600 and $75,400.
BTC is also trading over the 38.2% Fibonacci retracement of the $57,800–$126,199 leg at $83,928, keeping the recent breakout supported.
The Relative Strength Index (RSI) around 69 suggests strong but not yet extreme upside momentum. At the same time, the Moving Average Convergence Divergence (MACD) remains positive, with the line above zero and recent gains hinting at sustained bullish pressure.
On the topside, initial resistance emerges at the 50% Fibonacci retracement at $91,999, followed by the 61.8% retracement at $100,071 and then the 78.6% retracement level at $111,562, ahead of the all-time high at $126,199.
On the downside, immediate support is seen at the nearby horizontal level at $85,000 and the 38.2% Fibonacci retracement at $83,928. Deeper support comes from the EMA cluster and the 23.6% Fibonacci retracement around $73,942, with stronger structural floors at $66,500 and $62,300 guarding the broader uptrend.
(The technical analysis of this story was written with the help of an AI tool. Know more.)
추천 기사


