

Dow Jones Industrial Average green by default as chips crater
- DJIA edged higher even as a global memory-chip selloff dragged the Nasdaq and S&P 500 lower.
- The gain reflects defensive rotation within the index, not broad risk appetite.
- Hot flash PMIs reinforce the hawkish Fed hold, with Thursday's core PCE the week's main test.
The Dow Jones Industrial Average (DJIA) held in the green through Tuesday even as the rest of the equity board bled. On the surface that reads as strength; underneath, it is anything but. The index held up for the least flattering reason on offer, namely its composition. A global rout in memory-chip names hammered the Nasdaq and dragged the S&P 500 lower, while the Dow's tilt toward staples, healthcare, and old-guard value let it sidestep the worst of the damage.
The chip rout did the Dow a favour
The selling began overnight in Asia, where memory-chip leaders were dumped without ceremony; South Korea's chip-heavy benchmark shed close to 10% in a single session before the damage rolled into European technology and US semiconductors. Within the Dow, that pain was concentrated in a few names, while the rotating money found a home in defensive megacaps across consumer staples and healthcare. IBM added a further lift, popping on a broker upgrade and handing the index a green anchor it would not otherwise have had. The cleaner way to read the session is as a flush of crowded, momentum-driven positioning rather than the start of something darker. That distinction flatters the Dow specifically, because the index was never carrying the speculative premium the chip trade had built up in the first place.
PMIs reload the hawkish case
The day's data did the bulls no favours either. S&P Global's flash Purchasing Managers Index (PMI) readings came in hot across the board, with manufacturing jumping to 55.7 against expectations near 54.8, services holding in expansion at 51.3, and the composite firming to 52.2. None of that fits the soft-landing-into-rate-cuts story equity bulls would prefer; it lands instead as confirmation that the economy is still running warm. That is precisely the backdrop the Federal Reserve (Fed) leaned on when it held at 3.75% on June 17 alongside a dot plot that tilted hawkish. Chair Warsh has shown no appetite for easing into firm activity data; Tuesday's prints only harden that stance.
Core PCE is the week's real test
The week's actual hinge is not Tuesday's tape but Thursday's inflation read. Core Personal Consumption Expenditures Price Index (PCE), the Fed's preferred inflation gauge, lands at 12:30 GMT on Thursday. The consensus already points the wrong way for the doves. Core PCE is seen accelerating to 3.4% YoY from 3.3%, with the headline measure ticking up to 4% YoY from 3.8%. A print at or above that pace would validate the hawkish hold outright and push the first rate cut further down the calendar, a clear headwind for equities including the Dow. With Fed speakers Williams and Goolsbee scattered across Thursday and Friday, the tone will still come from the data rather than the soundbites.
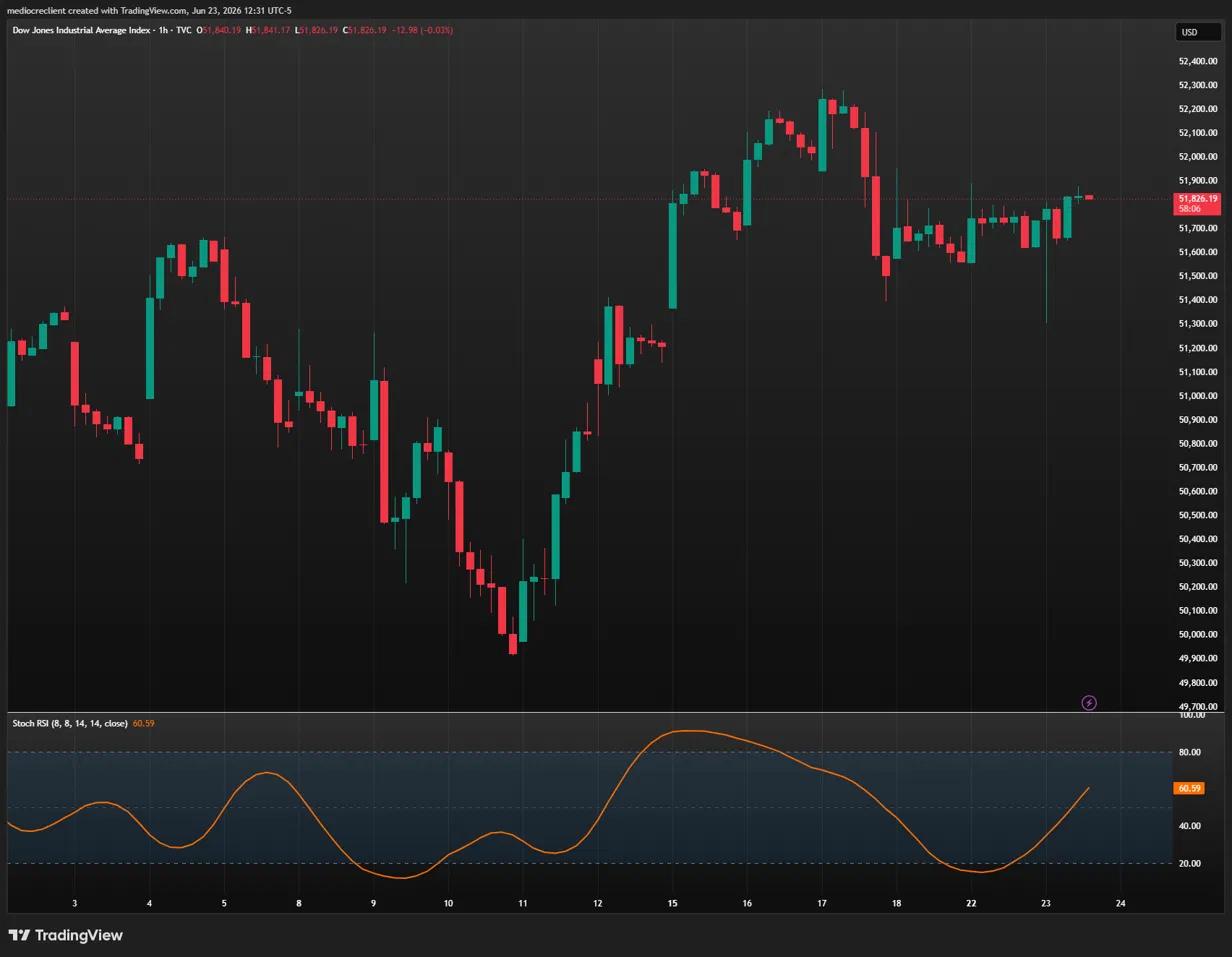
Resistance: The 52,000 handle is the immediate ceiling and the level the index must reclaim to look anything other than corrective; above it, the June high near 52,300 is the next objective. With price stalled close to 51,800, the burden of proof sits squarely with the bulls.
Support: The 51,500 region has anchored the floor of the recent range and stands as the first line of defence. A clean break below it exposes 51,000; beneath that, the structural shelf sits near the June low around 50,000.
Bias: Modestly bullish while 51,500 holds, with a push at 52,000 the path of least resistance near term. The Stochastic Relative Strength Index (Stoch RSI), turning up from oversold near 20 to about 60, backs that near-term grind, though the move reads as a range bounce rather than a fresh trend. A daily close back above 52,000 reopens the June high; a sustained break under 51,500, most plausibly on a hot core PCE Thursday, flips the call lower toward 51,000 and then 50,000.
Dow Jones hourly chart
Dow Jones FAQs
The Dow Jones Industrial Average, one of the oldest stock market indices in the world, is compiled of the 30 most traded stocks in the US. The index is price-weighted rather than weighted by capitalization. It is calculated by summing the prices of the constituent stocks and dividing them by a factor, currently 0.152. The index was founded by Charles Dow, who also founded the Wall Street Journal. In later years it has been criticized for not being broadly representative enough because it only tracks 30 conglomerates, unlike broader indices such as the S&P 500.
Many different factors drive the Dow Jones Industrial Average (DJIA). The aggregate performance of the component companies revealed in quarterly company earnings reports is the main one. US and global macroeconomic data also contributes as it impacts on investor sentiment. The level of interest rates, set by the Federal Reserve (Fed), also influences the DJIA as it affects the cost of credit, on which many corporations are heavily reliant. Therefore, inflation can be a major driver as well as other metrics which impact the Fed decisions.
Dow Theory is a method for identifying the primary trend of the stock market developed by Charles Dow. A key step is to compare the direction of the Dow Jones Industrial Average (DJIA) and the Dow Jones Transportation Average (DJTA) and only follow trends where both are moving in the same direction. Volume is a confirmatory criteria. The theory uses elements of peak and trough analysis. Dow’s theory posits three trend phases: accumulation, when smart money starts buying or selling; public participation, when the wider public joins in; and distribution, when the smart money exits.
There are a number of ways to trade the DJIA. One is to use ETFs which allow investors to trade the DJIA as a single security, rather than having to buy shares in all 30 constituent companies. A leading example is the SPDR Dow Jones Industrial Average ETF (DIA). DJIA futures contracts enable traders to speculate on the future value of the index and Options provide the right, but not the obligation, to buy or sell the index at a predetermined price in the future. Mutual funds enable investors to buy a share of a diversified portfolio of DJIA stocks thus providing exposure to the overall index.
추천 기사


