

Dow Jones Industrial Average fades early gains as software rout offsets strong NFP
- Nonfarm payrolls surged 130,000 in January, more than double the 55,000 consensus, while the unemployment rate dipped to 4.3%.
- Final benchmark revisions erased 898,000 jobs from the prior-year tally, confirming that the US economy added just 181,000 jobs in all of 2025.
- Software stocks extended their historic selloff, with Salesforce, ServiceNow, and Intuit each falling more than 5% on AI displacement fears.
- Kansas City Fed President Jeff Schmid struck a hawkish tone following the jobs data, keeping rate cut expectations anchored to July at the earliest.
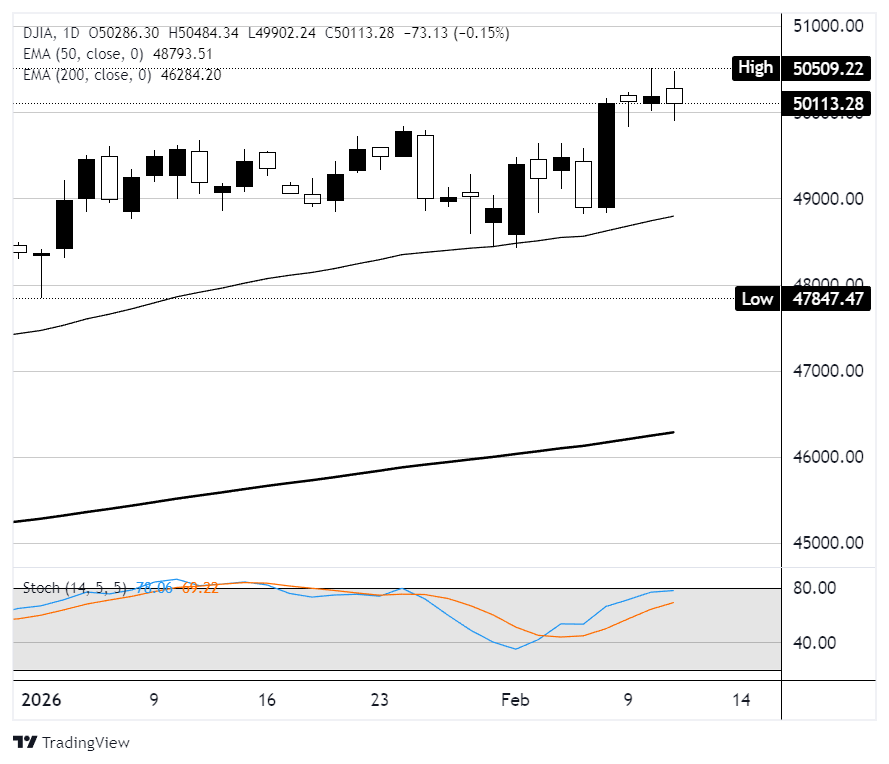
The Dow Jones Industrial Average (DJIA) gave back early gains on Wednesday, shedding around 120 points to close down roughly 0.2% near 50,010 after briefly reclaiming the 50,000 handle in early trading. The S&P 500 slipped 0.2% while the Nasdaq Composite fell 0.5%, dragged lower by another wave of selling in enterprise software names. Markets initially rallied on a much stronger-than-expected January Nonfarm Payrolls (NFP) report, but the enthusiasm faded as investors digested hawkish Federal Reserve (Fed) commentary and renewed concerns that artificial intelligence tools are eating into traditional software business models.
January jobs data blows past expectations
The Bureau of Labor Statistics (BLS) reported that the US economy added 130K jobs in January, easily surpassing the Dow Jones consensus estimate of 55< and marking the strongest month for payroll growth since December 2024. The unemployment rate edged lower to 4.3% from 4.4%, while the broader U6 underemployment rate fell to 8.0%. Average hourly earnings rose 0.4% month-over-month, one-tenth above expectations, and 3.7% year-over-year. Health care led the gains with 82K new positions, followed by social assistance at 42K and construction at 33K. Federal government employment declined by 34K as deferred resignations from last year's Department of Government Efficiency cuts hit the payroll count. The labor force participation rate ticked up to 62.5%, and the household survey was even stronger, showing a gain of 528K workers.
Benchmark revisions confirm 2025 as a near-zero hiring year
Alongside the January data, the BLS released its final benchmark revisions for the period from April 2024 to March 2025, which slashed the prior job count by 898K on a seasonally adjusted basis. That figure landed slightly below the preliminary estimate of 911K issued last September but broadly in line with Wall Street expectations. The revision reduced total 2025 job creation from an initially reported 584K to just 181K confirming last year as one of the weakest periods for hiring outside of a formal recession. Every month of 2025 saw downward revisions, and the average monthly payroll gain for the year now sits below 40K after adjustments. Fed Chair Jerome Powell had previously flagged the overstatement, estimating in December that payrolls were being inflated by roughly 60K per month.
Fed's Schmid keeps hawkish pressure on rate cut timeline
Kansas City Fed President Jeff Schmid, who dissented against the December rate cut in favor of holding rates steady, delivered remarks shortly after the NFP release that reinforced his hawkish stance. Schmid's comments underscored his preference for keeping monetary policy modestly restrictive while inflation pressures persist. His tone aligned with concerns that the stronger-than-expected jobs data gives the Fed little reason to rush further cuts, particularly with wage growth accelerating. Money markets moved to price the next rate cut no earlier than July, pushed back from June previously. The CME FedWatch Tool still shows roughly a 33% probability of cumulative 50 basis points of cuts by year-end, with the fed funds rate sitting at 3.50% to 3.75% following three consecutive quarter-point reductions in the second half of 2025.
Software stocks extend historic selloff on AI disruption fears
The initial post-NFP rally was overwhelmed by a fresh leg lower in enterprise software names. Salesforce Inc. (CRM) fell nearly 4%, ServiceNow Inc. (NOW) dropped over 6%, and Intuit Inc. (INTU) declined more than 5%. Oracle Corporation (ORCL) and Palantir Technologies Inc. (PLTR) each shed over 2%. The iShares Expanded Tech-Software Sector ETF dropped 3.5%, extending a rout that has wiped more than $1 trillion in market value from the sector since late January. The selloff, dubbed "software-mageddon" by traders, has been fueled by rapid advances in AI tools from companies like Anthropic that threaten to automate workflows historically handled by enterprise software platforms. Wedbush analyst Dan Ives called the structural selloff the worst he has seen in 25 years, though he argued the declines are overdone.
AI infrastructure and cyclicals buck the trend
While software names cratered, stocks tied to the physical buildout of AI data centers surged. Vertiv Holdings Co. (VRT) rocketed 17% after posting a fourth-quarter earnings beat and issuing a strong 2026 outlook. Caterpillar Inc. (CAT) climbed 4%, leading the Dow, while Eaton Corporation plc (ETN) gained 4% and GE Vernova Inc. (GEV) added 1%. The divergence highlighted the ongoing rotation from software into infrastructure and cyclical plays. Elsewhere, T-Mobile US Inc. (TMUS) sank 5% after reporting weaker-than-expected subscriber growth, Robinhood Markets Inc. (HOOD) dropped 10% on a revenue miss, and Mattel Inc. (MAT) plunged 30% following disappointing holiday sales and a weak 2026 outlook.\
Dow Jones daily chart
Dow Jones FAQs
The Dow Jones Industrial Average, one of the oldest stock market indices in the world, is compiled of the 30 most traded stocks in the US. The index is price-weighted rather than weighted by capitalization. It is calculated by summing the prices of the constituent stocks and dividing them by a factor, currently 0.152. The index was founded by Charles Dow, who also founded the Wall Street Journal. In later years it has been criticized for not being broadly representative enough because it only tracks 30 conglomerates, unlike broader indices such as the S&P 500.
Many different factors drive the Dow Jones Industrial Average (DJIA). The aggregate performance of the component companies revealed in quarterly company earnings reports is the main one. US and global macroeconomic data also contributes as it impacts on investor sentiment. The level of interest rates, set by the Federal Reserve (Fed), also influences the DJIA as it affects the cost of credit, on which many corporations are heavily reliant. Therefore, inflation can be a major driver as well as other metrics which impact the Fed decisions.
Dow Theory is a method for identifying the primary trend of the stock market developed by Charles Dow. A key step is to compare the direction of the Dow Jones Industrial Average (DJIA) and the Dow Jones Transportation Average (DJTA) and only follow trends where both are moving in the same direction. Volume is a confirmatory criteria. The theory uses elements of peak and trough analysis. Dow’s theory posits three trend phases: accumulation, when smart money starts buying or selling; public participation, when the wider public joins in; and distribution, when the smart money exits.
There are a number of ways to trade the DJIA. One is to use ETFs which allow investors to trade the DJIA as a single security, rather than having to buy shares in all 30 constituent companies. A leading example is the SPDR Dow Jones Industrial Average ETF (DIA). DJIA futures contracts enable traders to speculate on the future value of the index and Options provide the right, but not the obligation, to buy or sell the index at a predetermined price in the future. Mutual funds enable investors to buy a share of a diversified portfolio of DJIA stocks thus providing exposure to the overall index.
추천 기사


