
US Dollar Index Price Forecast: Rally pauses above 100.00 despite Fed dovish bets ease further
- The US Dollar faces selling pressure on historically longest US government shutdown.
- Fed dovish speculation recedes further after upbeat US data releases.
- The USD Index could rise further towards 102.00.
The US Dollar Index (DXY), which tracks the Greenback’s value against six major currencies, trades 0.18% lower to near 100.00 during the European trading session on Thursday. The US Dollar (USD) faces slight selling pressure as the ongoing United States (US) federal shutdown has become the longest in history.
Financial market participants expect that the government shutdown could slow down the pace of public spending and the execution of federal projects, a scenario that is unfavorable for the economic outlook.
Meanwhile, Federal Reserve (Fed) dovish expectations for the December meeting have receded further after the release of the upbeat ADP Employment Change and the ISM Services PMI data for October on Wednesday.
The CME FedWatch tool shows that the probability of the Fed cutting interest rates by 25 basis points (bps) to 3.50%-3.75% in the December meeting has eased to 62.5% from 68.6% seen on Tuesday.
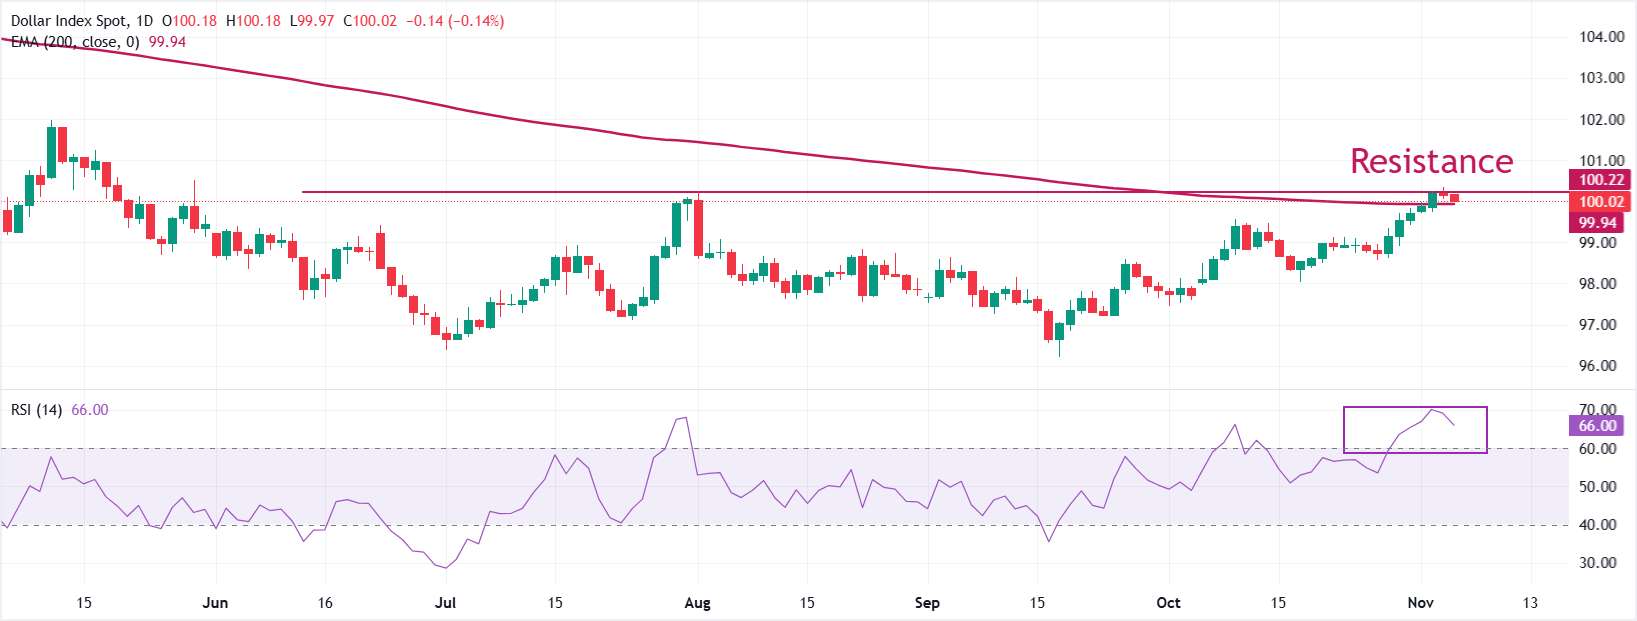
The USD Index struggles to extend its rally after posting a fresh five-month high of 100.36 posted on Thursday. The asset strives to stabilize above the 200-day Exponential Moving Average (EMA), which trades around 99.94.
The 14-day Relative Strength Index (RSI) pulls back after turning slightly overbought after reaching near 70.00. The overall momentum would remain bullish until the RSI (14) holds above 60.00.
Going forward, the USD Index would rise further towards the May 29 high of 100.53 and the May 12 high around 102.00, if it manages to break above Thursday’s high of 100.36.
On the contrary, a downside move by the US currency index below Tuesday’s low of 99.74 would lead to further correction towards the October 21 high of 99.10, followed by the October 28 low of 98.57.
US Dollar Index daily chart
US Dollar FAQs
The US Dollar (USD) is the official currency of the United States of America, and the ‘de facto’ currency of a significant number of other countries where it is found in circulation alongside local notes. It is the most heavily traded currency in the world, accounting for over 88% of all global foreign exchange turnover, or an average of $6.6 trillion in transactions per day, according to data from 2022. Following the second world war, the USD took over from the British Pound as the world’s reserve currency. For most of its history, the US Dollar was backed by Gold, until the Bretton Woods Agreement in 1971 when the Gold Standard went away.
The most important single factor impacting on the value of the US Dollar is monetary policy, which is shaped by the Federal Reserve (Fed). The Fed has two mandates: to achieve price stability (control inflation) and foster full employment. Its primary tool to achieve these two goals is by adjusting interest rates. When prices are rising too quickly and inflation is above the Fed’s 2% target, the Fed will raise rates, which helps the USD value. When inflation falls below 2% or the Unemployment Rate is too high, the Fed may lower interest rates, which weighs on the Greenback.
In extreme situations, the Federal Reserve can also print more Dollars and enact quantitative easing (QE). QE is the process by which the Fed substantially increases the flow of credit in a stuck financial system. It is a non-standard policy measure used when credit has dried up because banks will not lend to each other (out of the fear of counterparty default). It is a last resort when simply lowering interest rates is unlikely to achieve the necessary result. It was the Fed’s weapon of choice to combat the credit crunch that occurred during the Great Financial Crisis in 2008. It involves the Fed printing more Dollars and using them to buy US government bonds predominantly from financial institutions. QE usually leads to a weaker US Dollar.
Quantitative tightening (QT) is the reverse process whereby the Federal Reserve stops buying bonds from financial institutions and does not reinvest the principal from the bonds it holds maturing in new purchases. It is usually positive for the US Dollar.
추천 기사


