
Dow Jones Industrial Average tumbles as Trump reignites tariff talk
- The Dow Jones fell on Friday as investors fled to safety.
- President Trump has returned to the China tariff trough, promising even steeper import taxes.
- Trump also pulled out of an upcoming meeting with Chinese President Xi Jinping.
The Dow Jones Industrial Average (DJIA) soured sharply on Friday, plummeting to its lowest bids in nearly three weeks and declining over 900 points top-to-bottom after US President Donald Trump pulled out of trade talks with Chinese President Xi Jinping and vowed to sharply increase import tariffs on all Chinese goods. According to Trump, China is holding the rest of the world hostage with its protectionist rare earth materials policies.
Market-wide expectations of a potential tariff-easing trade deal between the US and China were demolished by Trump’s fresh tariff proclamation, sending investors scurrying into safe havens to cap off an already wobbly week in equities.
Here we go again
China tightened its trade policies around critical minerals earlier this week, slapping a new licensing requirement on any foreign business that exports rare minerals from China. The move came at a time when trade talks between the US and China had hit a lull, but now Trump is once again accelerating his punishing tariff announcements via a social media proclamation, a repeat of the market-destabilizing trade war rhetoric that struck markets earlier in the year.
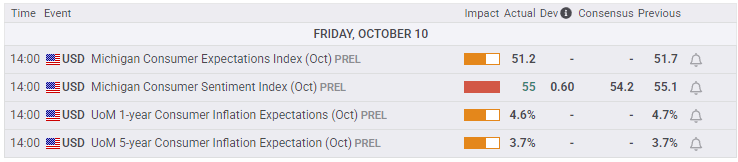
The Consumer Sentiment Index from the University of Michigan (UoM) fell less than expected for the month of October, providing a slim boost for investors who were bracing for a much worse outcome. UoM 1-year Consumer Inflation Expectations also ticked down to 4.6% from 4.7%, however, the 5-year component remains elevated at 3.7%.
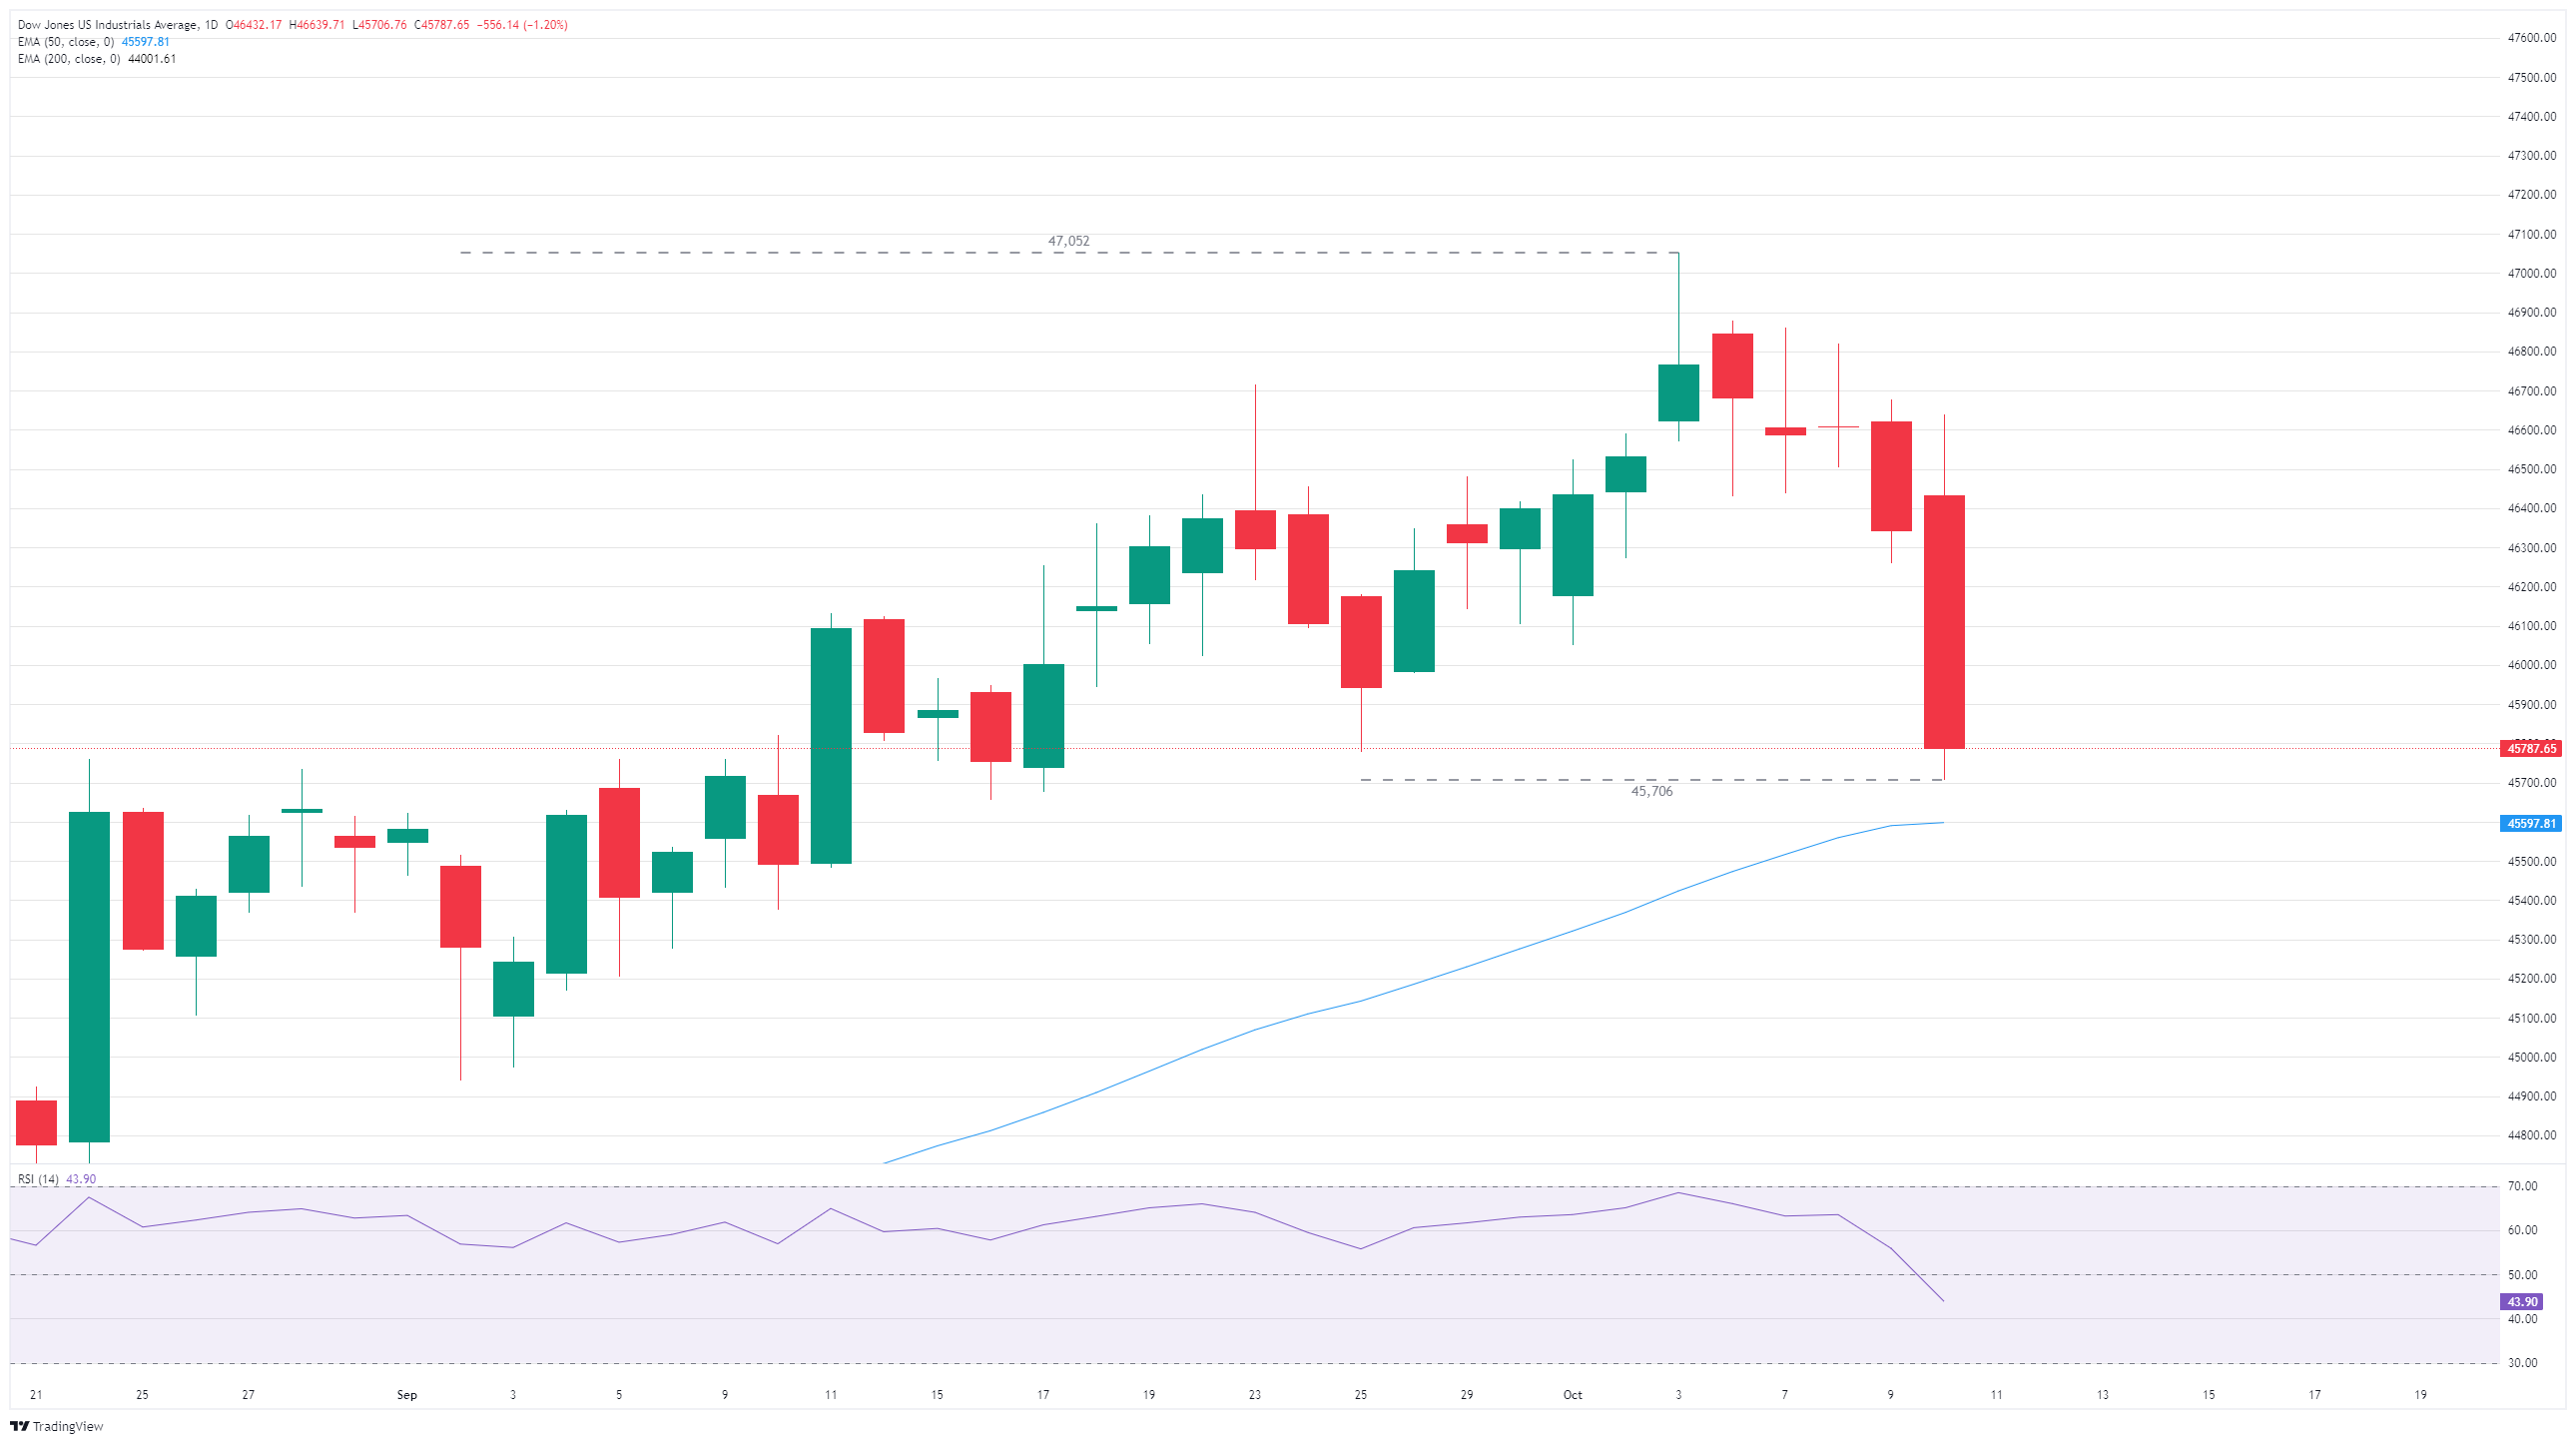
Dow Jones daily chart
Dow Jones FAQs
The Dow Jones Industrial Average, one of the oldest stock market indices in the world, is compiled of the 30 most traded stocks in the US. The index is price-weighted rather than weighted by capitalization. It is calculated by summing the prices of the constituent stocks and dividing them by a factor, currently 0.152. The index was founded by Charles Dow, who also founded the Wall Street Journal. In later years it has been criticized for not being broadly representative enough because it only tracks 30 conglomerates, unlike broader indices such as the S&P 500.
Many different factors drive the Dow Jones Industrial Average (DJIA). The aggregate performance of the component companies revealed in quarterly company earnings reports is the main one. US and global macroeconomic data also contributes as it impacts on investor sentiment. The level of interest rates, set by the Federal Reserve (Fed), also influences the DJIA as it affects the cost of credit, on which many corporations are heavily reliant. Therefore, inflation can be a major driver as well as other metrics which impact the Fed decisions.
Dow Theory is a method for identifying the primary trend of the stock market developed by Charles Dow. A key step is to compare the direction of the Dow Jones Industrial Average (DJIA) and the Dow Jones Transportation Average (DJTA) and only follow trends where both are moving in the same direction. Volume is a confirmatory criteria. The theory uses elements of peak and trough analysis. Dow’s theory posits three trend phases: accumulation, when smart money starts buying or selling; public participation, when the wider public joins in; and distribution, when the smart money exits.
There are a number of ways to trade the DJIA. One is to use ETFs which allow investors to trade the DJIA as a single security, rather than having to buy shares in all 30 constituent companies. A leading example is the SPDR Dow Jones Industrial Average ETF (DIA). DJIA futures contracts enable traders to speculate on the future value of the index and Options provide the right, but not the obligation, to buy or sell the index at a predetermined price in the future. Mutual funds enable investors to buy a share of a diversified portfolio of DJIA stocks thus providing exposure to the overall index.
추천 기사


