
Dow Jones Industrial Average left behind as tech stocks rise
- The Dow Jones continued to grapple with the 45,000 handle on Wednesday.
- Tech stocks gained ground after Google “won” an antitrust case that lets it keep its Chrome division.
- JOLTS Job Openings gave some investors cause for pause after an unexpected dip.
The Dow Jones Industrial Average (DJIA) missed the bullish bus on Wednesday, lagging its index peers and slumping over 250 points. The Dow is struggling to hold above the 45,000 price handle as economic data concerns crimp “real economy” stocks, while tech stocks see fresh highs on a not-worst-case ruling on Google’s antitrust lawsuit that threatened to carve off the company’s Chrome browser and Android mobile operating system divisions.
JOLTS Job Openings fell to 7.181M in July, the lowest pace of job availability since September of 2024, reigniting economic growth concerns. Firms continue to hammer down on their pace of hiring in the face of ongoing trade tariff turmoil, placing even further pressure on Friday’s upcoming Nonfarm Payrolls (NFP) report.
It's a Google world, and we're all just living in it
Google parent Alphabet (GOOGL) rallied hard on Wednesday, dragging other tech stocks higher alongside it after a US federal judge ruled partly in Alphabet’s favor in a high-profile antitrust case that alleges that Alphabet’s planet-wide internet platforms represent a market-controlling monopoly. Alphabet promised courts that its complete and utter domination of consumer internet access through its Chrome browser platform would not constrain consumer choice. Alphabet will also be allowed to continue handing out billions of dollars to remain the default browser in Apple (AAPL) iPhones. Alphabet will also maintain ownership and control of its Android mobile operating system that exists on functionally every smartphone that isn’t an Apple product.
NFP net job gains will dominate this week’s general market water supply. The Federal Reserve (Fed) is poised to cut interest rates on September 17, driven by its dual mandate to both stimulate job creation and control inflation. A recent bout of softening US labor figures has investor hopes riding high that the Fed will brush off a recent uptick in inflation pressure and deliver a rate cut in a few weeks to prop up US employment numbers that took a sharp downward turn heading into the middle of the year.
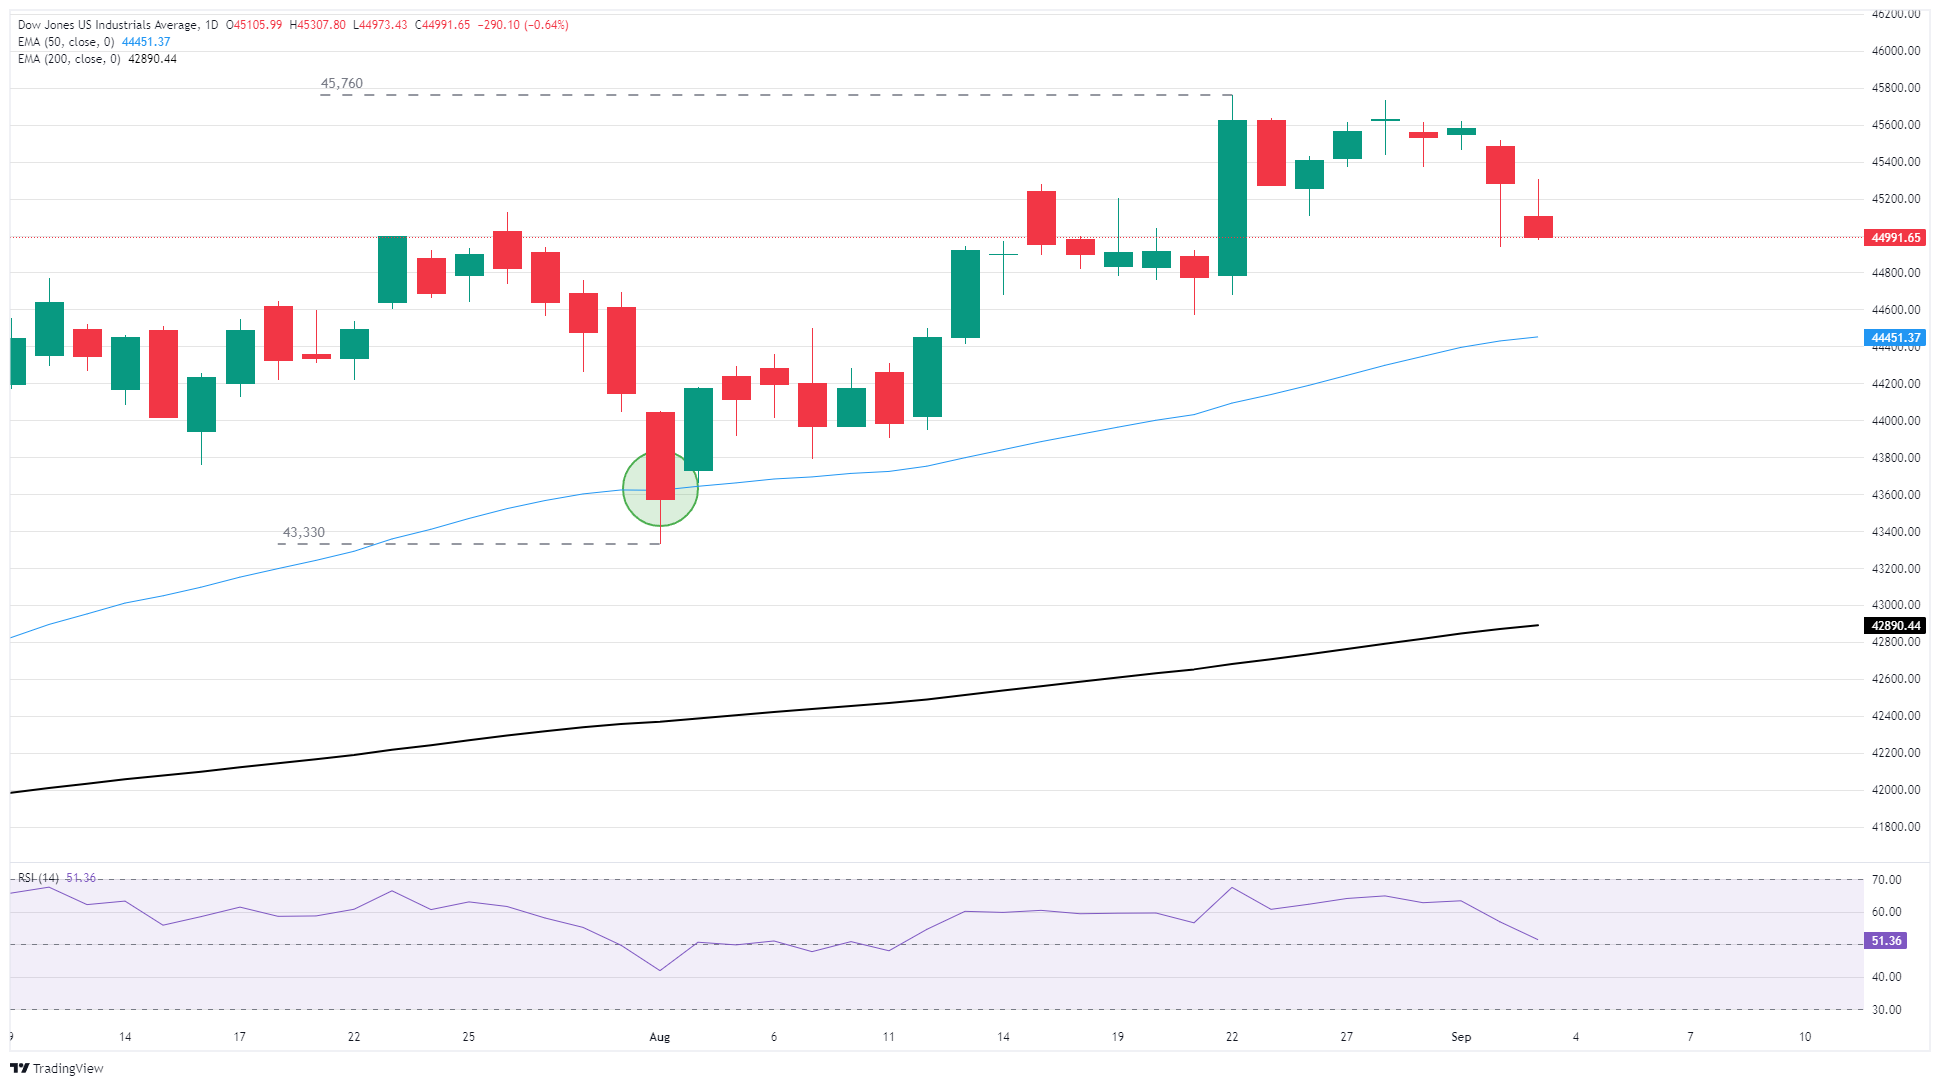
Dow Jones daily chart
Dow Jones FAQs
The Dow Jones Industrial Average, one of the oldest stock market indices in the world, is compiled of the 30 most traded stocks in the US. The index is price-weighted rather than weighted by capitalization. It is calculated by summing the prices of the constituent stocks and dividing them by a factor, currently 0.152. The index was founded by Charles Dow, who also founded the Wall Street Journal. In later years it has been criticized for not being broadly representative enough because it only tracks 30 conglomerates, unlike broader indices such as the S&P 500.
Many different factors drive the Dow Jones Industrial Average (DJIA). The aggregate performance of the component companies revealed in quarterly company earnings reports is the main one. US and global macroeconomic data also contributes as it impacts on investor sentiment. The level of interest rates, set by the Federal Reserve (Fed), also influences the DJIA as it affects the cost of credit, on which many corporations are heavily reliant. Therefore, inflation can be a major driver as well as other metrics which impact the Fed decisions.
Dow Theory is a method for identifying the primary trend of the stock market developed by Charles Dow. A key step is to compare the direction of the Dow Jones Industrial Average (DJIA) and the Dow Jones Transportation Average (DJTA) and only follow trends where both are moving in the same direction. Volume is a confirmatory criteria. The theory uses elements of peak and trough analysis. Dow’s theory posits three trend phases: accumulation, when smart money starts buying or selling; public participation, when the wider public joins in; and distribution, when the smart money exits.
There are a number of ways to trade the DJIA. One is to use ETFs which allow investors to trade the DJIA as a single security, rather than having to buy shares in all 30 constituent companies. A leading example is the SPDR Dow Jones Industrial Average ETF (DIA). DJIA futures contracts enable traders to speculate on the future value of the index and Options provide the right, but not the obligation, to buy or sell the index at a predetermined price in the future. Mutual funds enable investors to buy a share of a diversified portfolio of DJIA stocks thus providing exposure to the overall index.
추천 기사


