
Gold extends rally above $3,550 as weak US JOLTS data lifts Fed cut bets
- XAU/USD surges, although overbought signals hint at a possible short-term consolidation.
- JOLTS vacancies drop sharply while factory orders improve slightly, reinforcing signs of a slowing US economy.
- Fed officials strike mixed tones, with Kashkari, Bostic and Musalem focusing on inflation concerns.
Gold price extended its gains on Wednesday and is up more than 1%, poised to register record highs during the day, after clearing the mid-point of the $3,500-$3,600 range as economic data from the United States showed the labor market is weakening.
Bullion gains over 1%, eyes fresh record highs as increasing labor market weakness fuels Fed’s September rate cut
The yellow metal is poised to continue trending in uncharted territory, though readings of technical oscillators turning overbought could pave the way for profit-taking and some consolidation before the uptrend resumes.
Data from the United States (US) had increased the chances of a Fed interest rate cut at the September meeting. The Job Openings and Labor Turnover Survey (JOLTS) decreased sharply, while Factory Orders, despite improving, show the ongoing economic slowdown.
Traders’ eyes shift to the August Nonfarm Payroll figures on Friday. Before that, Initial Jobless Claims on Thursday and the ADP National Employment Change could be a prelude to what’s coming in the labor market.
Meanwhile, some Federal Reserve (Fed) officials crossed the wires, led by Minneapolis Fed Neel Kashkari and Atlanta’s Fed Raphael Bostic, with both being slightly hawkish, prioritizing price stability. Nonetheless, they acknowledged that the labor market is cooling, with Bostic expecting a single 25 basis point rate cut this year.
Earlier, St. Louis Fed Alberto Musalem was also hawkish, saying that the Fed remains focused on its mandate, adding that current restrictive monetary policy stance is in the right place. Meanwhile, Fed Governor Christopher Waller continued his campaign to reduce rates at the September meeting.
Daily digest market movers: Gold skyrockets as Dollar tumbles
- Gold price advancement continued, as the Greenback slides. The US Dollar Index (DXY), which tracks the performance of the buck against a basket of six currencies, is down 0.20% at 98.11.
- US Treasury yields are falling as well, with the 10-year Treasury note down over five basis points (bps) to 4.211%. US real yields—calculated by subtracting inflation expectations from the nominal yield—have decreased five and a half basis points to 1.803% at the time of writing.
- The latest JOLTS report showed vacancies fell to 7.181 million in July from 7.357 million in June, according to the Bureau of Labor Statistics (BLS). Hiring rose by 41,000, while layoffs increased by 12,000. Economists pointed to tariffs imposed by President Donald Trump as a key factor behind the labor market slowdown.
- Data from the US Census Bureau revealed Factory Orders declined 1.3% month-over-month in July, slightly better than the expected 1.4% drop. Despite this, the print reinforced concerns of persistent weakness in the manufacturing sector.
- The contraction of the ISM Manufacturing PMI for the sixth straight month indicates that the economic growth could take a hit. The employment sub-component revealed that hiring remained subdued, while industrial production continues to dwindle.
- Gold ETF inflows are reinforcing the rally, with SPDR Gold Trust saying that its holdings rose 1.01% last Friday to 977.68 tons, the highest since August 2022.
- Fed September rate cut odds are at 94% according to Prime Market Terminal interest rate probabilities tool.
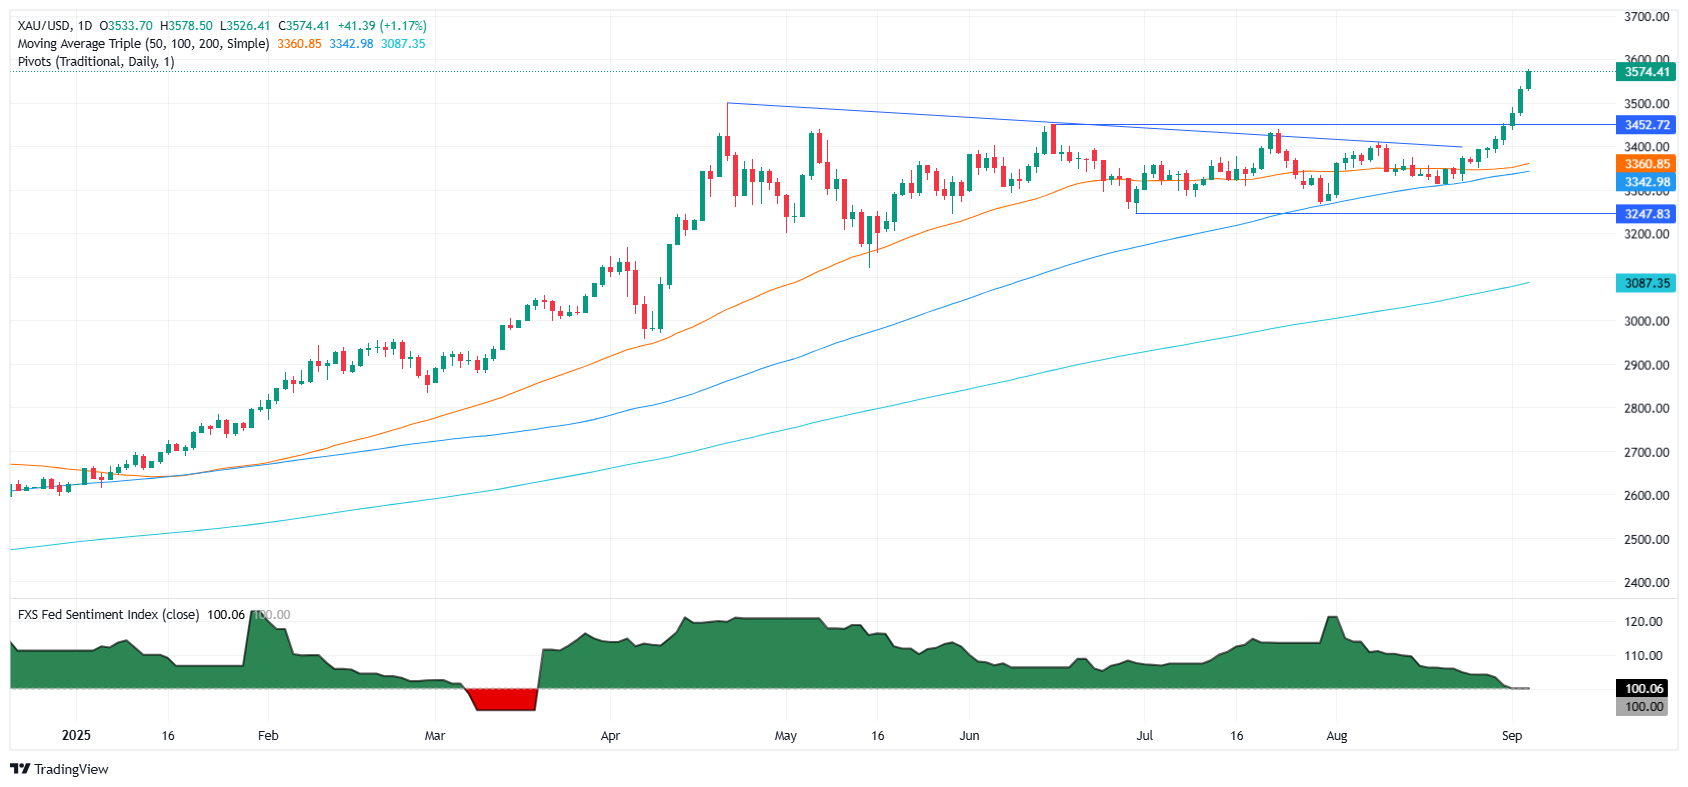
Technical outlook: Gold price poised to challenge $3,600 in the near term
The Gold uptrend might continue if traders push XAU/USD past the $3,600 figure. However, the Relative Strength Index (RSI) turning overbought, closing into the 80 extreme reading, suggests that XAU/USD might consolidate in the near term.
Once XAU/USD clears $3,550, then traders can challenge the all-time high of $3,578. If surpassed, the next ceiling level would be $3,600. Conversely, a drop below $3,550 will expose $3,500, followed by the August 29 high of $3,454, before sliding to $3,400.
Gold FAQs
Gold has played a key role in human’s history as it has been widely used as a store of value and medium of exchange. Currently, apart from its shine and usage for jewelry, the precious metal is widely seen as a safe-haven asset, meaning that it is considered a good investment during turbulent times. Gold is also widely seen as a hedge against inflation and against depreciating currencies as it doesn’t rely on any specific issuer or government.
Central banks are the biggest Gold holders. In their aim to support their currencies in turbulent times, central banks tend to diversify their reserves and buy Gold to improve the perceived strength of the economy and the currency. High Gold reserves can be a source of trust for a country’s solvency. Central banks added 1,136 tonnes of Gold worth around $70 billion to their reserves in 2022, according to data from the World Gold Council. This is the highest yearly purchase since records began. Central banks from emerging economies such as China, India and Turkey are quickly increasing their Gold reserves.
Gold has an inverse correlation with the US Dollar and US Treasuries, which are both major reserve and safe-haven assets. When the Dollar depreciates, Gold tends to rise, enabling investors and central banks to diversify their assets in turbulent times. Gold is also inversely correlated with risk assets. A rally in the stock market tends to weaken Gold price, while sell-offs in riskier markets tend to favor the precious metal.
The price can move due to a wide range of factors. Geopolitical instability or fears of a deep recession can quickly make Gold price escalate due to its safe-haven status. As a yield-less asset, Gold tends to rise with lower interest rates, while higher cost of money usually weighs down on the yellow metal. Still, most moves depend on how the US Dollar (USD) behaves as the asset is priced in dollars (XAU/USD). A strong Dollar tends to keep the price of Gold controlled, whereas a weaker Dollar is likely to push Gold prices up.
추천 기사


