


Dow Jones Industrial Average dribbles lower after PCE inflation accelerates again
- The Dow Jones explored the bearish side on Thursday, testing below 44,500.
- The Dow is missing out on another bullish push in large tech stocks.
- US PCE inflation and consumer income data ticked higher in June.
The Dow Jones Industrial Average (DJIA) tested the low end on Thursday, chalking in a fourth straight bearish session as equities grapple with a stubborn Federal Reserve (Fed), which is increasingly unlikely to deliver rate cuts in the third, or any quarter, if the US doesn’t get a firmer handle on inflationary pressure that continues to throw up caution flags.
United States (US) economic data remains far more robust than many market watchers and policymakers had feared when the Trump administration kicked off a never-ending cycle of tariff threats and subsequent walk backs. Global reciprocal tariffs have routinely been announced, delayed, and re-announced, but key double-digit tariffs on core industries like steel and aluminum imports, as well as foreign cars, are already beginning to bite around the edges of key inflation metrics.
Inflation ticks higher following Fed rate hold on inflation concerns
Core US Personal Consumption Expenditure Price Index (PCE) inflation ticked higher in June, rising 0.3% MoM as many market participants had expected. On an annualized basis, PCE inflation accelerated to 2.6% YoY, outrunning the expected hold at 2.5%. US Consumer Income also rebounded 0.3% in June, and rising wage pressures will add further inflationary forces further down the line.
US Nonfarm Payrolls (NFP) remain on the data docket for this Friday, promising to close out the trading week with a tense release. US jobs and inflation data have taken on additional importance for the Fed following this week’s decision to hold interest rates steady for another meeting period. Annualized headline PCE inflation, a key inflation metric for the Fed’s rate-setting policymakers, has remained above the Fed’s 2% target band for almost four and a half years.
US President Donald Trump announced yet another delay in widespread tariffs, this time for only one country: Mexico. Trump declared early Thursday that Mexico has agreed to drop its “non-tariff barriers” that have prevented US companies from accessing Mexican consumer markets. However, there may be another miscommunication issue plaguing the Trump team’s efforts to secure trade deals: According to a statement from Mexico’s President Claudia Sheinbaum, the current between-tariffs deal does not imply further action on Mexico’s part.
Trump team reiterates well-known statements
According to White House Press Secretary Karoline Leavitt, the looming deadline for countries to deliver desirable trade deals to the Trump team’s desk or face stiff “reciprocal” tariffs remains Friday, August 1. To date, this is the fourth time Press Secretary Leavitt has announced that reciprocal-plus tariffs will for sure be going into effect on a particular date since Donald Trump took office in January, frequently just hours before President Trump himself announces a delay, or temporary suspension, or impending trade deal that has yet to be finalized.
US Treasury Secretary Scott Bessent reiterated on Thursday that the US and China have “the makings of a deal” to avert stiff import tariffs in both directions, which are set to automatically kick in if the two sides don’t reach a meaningful agreement by August 12. Bessent provided no details and has been teasing a potential final breakthrough in US-China trade talks for months.
Dow Jones price forecast
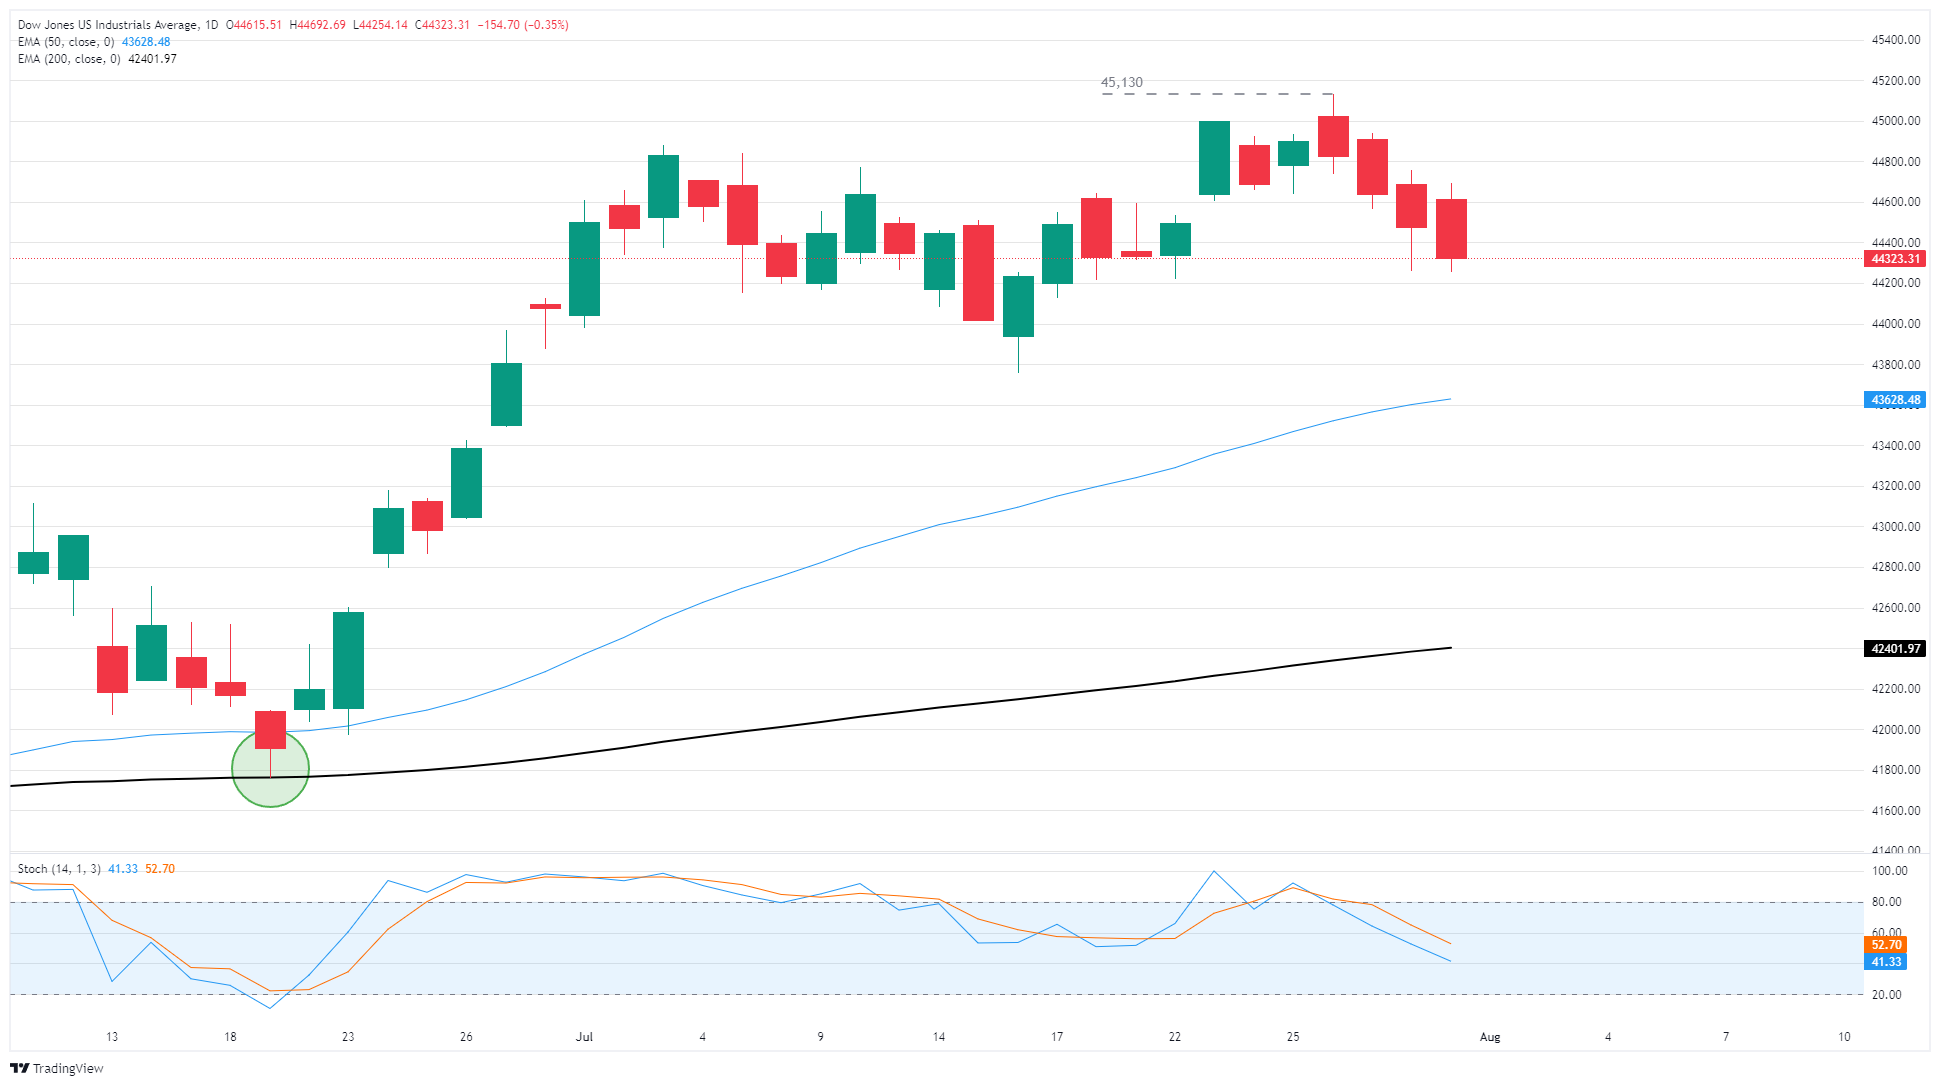
The Dow Jones is testing back below the 44,400 level for the second time this week, slumping into a fourth straight bearish session as equities run out of bullish momentum. The Dow briefly ticked into a new all-time high at the intraday level earlier this week, but the major equity index is now down almost 2% from Monday’s record high bid of 45,130.
The Dow Jones is still planted firmly in bullish territory, with firm technical support priced in at the 44,000 handle. Price action could fall another 1.4% and still be trading on the north side of the 50-day Exponential Moving Average (EMA) near 43,625.
Dow Jones daily chart
Dow Jones FAQs
The Dow Jones Industrial Average, one of the oldest stock market indices in the world, is compiled of the 30 most traded stocks in the US. The index is price-weighted rather than weighted by capitalization. It is calculated by summing the prices of the constituent stocks and dividing them by a factor, currently 0.152. The index was founded by Charles Dow, who also founded the Wall Street Journal. In later years it has been criticized for not being broadly representative enough because it only tracks 30 conglomerates, unlike broader indices such as the S&P 500.
Many different factors drive the Dow Jones Industrial Average (DJIA). The aggregate performance of the component companies revealed in quarterly company earnings reports is the main one. US and global macroeconomic data also contributes as it impacts on investor sentiment. The level of interest rates, set by the Federal Reserve (Fed), also influences the DJIA as it affects the cost of credit, on which many corporations are heavily reliant. Therefore, inflation can be a major driver as well as other metrics which impact the Fed decisions.
Dow Theory is a method for identifying the primary trend of the stock market developed by Charles Dow. A key step is to compare the direction of the Dow Jones Industrial Average (DJIA) and the Dow Jones Transportation Average (DJTA) and only follow trends where both are moving in the same direction. Volume is a confirmatory criteria. The theory uses elements of peak and trough analysis. Dow’s theory posits three trend phases: accumulation, when smart money starts buying or selling; public participation, when the wider public joins in; and distribution, when the smart money exits.
There are a number of ways to trade the DJIA. One is to use ETFs which allow investors to trade the DJIA as a single security, rather than having to buy shares in all 30 constituent companies. A leading example is the SPDR Dow Jones Industrial Average ETF (DIA). DJIA futures contracts enable traders to speculate on the future value of the index and Options provide the right, but not the obligation, to buy or sell the index at a predetermined price in the future. Mutual funds enable investors to buy a share of a diversified portfolio of DJIA stocks thus providing exposure to the overall index.
추천 기사


