
Crypto Today: Bitcoin consolidates, Ethereum and XRP trim gains as Elon Musk's SpaceX moves $150 million BTC
- Bitcoin consolidates above $118,000 as Elon Musk's SpaceX company transfers over $150 million in BTC, ending three years of dormancy.
- Ethereum claws back gains and retreats toward $3,600 support, shrugging off steady spot ETF inflows.
- XRP slides toward its previous all-time high of $3.40 after facing rejection from the $3.66 resistance level.
Cryptocurrencies, particularly leading altcoins, are showing signs of weakness on Tuesday, following a week of steady gains. Ethereum (ETH) is frontlining the correction, down over 2% to trade at $3,662 at the time of writing on Tuesday. Ripple (XRP) also faces headwinds following a retest of its record high of $3.66 on Monday.
The cross-border money remittance token is currently trading at $3.48. Meanwhile, Bitcoin (BTC) offers bullish signs while consolidating above $118,000 level.
Market overview: Elon Musk's SpaceX moves Bitcoin
SpaceX, the space exploration company founded by Elon Musk, has, for the first time since June 2022, transferred its Bitcoin holdings to a new wallet. According to a report by Spot On Chain, SpaceX transferred 1,308 BTC on Tuesday, worth approximately $153 million, marking the end of three years of dormancy.
SpaceX previously transferred 17,314 BTC, worth approximately $510.65 million at the time, from May 25 to June 10, 2022, to Coinbase. The company currently holds 6,977 BTC valued at approximately $822.65 million spread across known addresses.
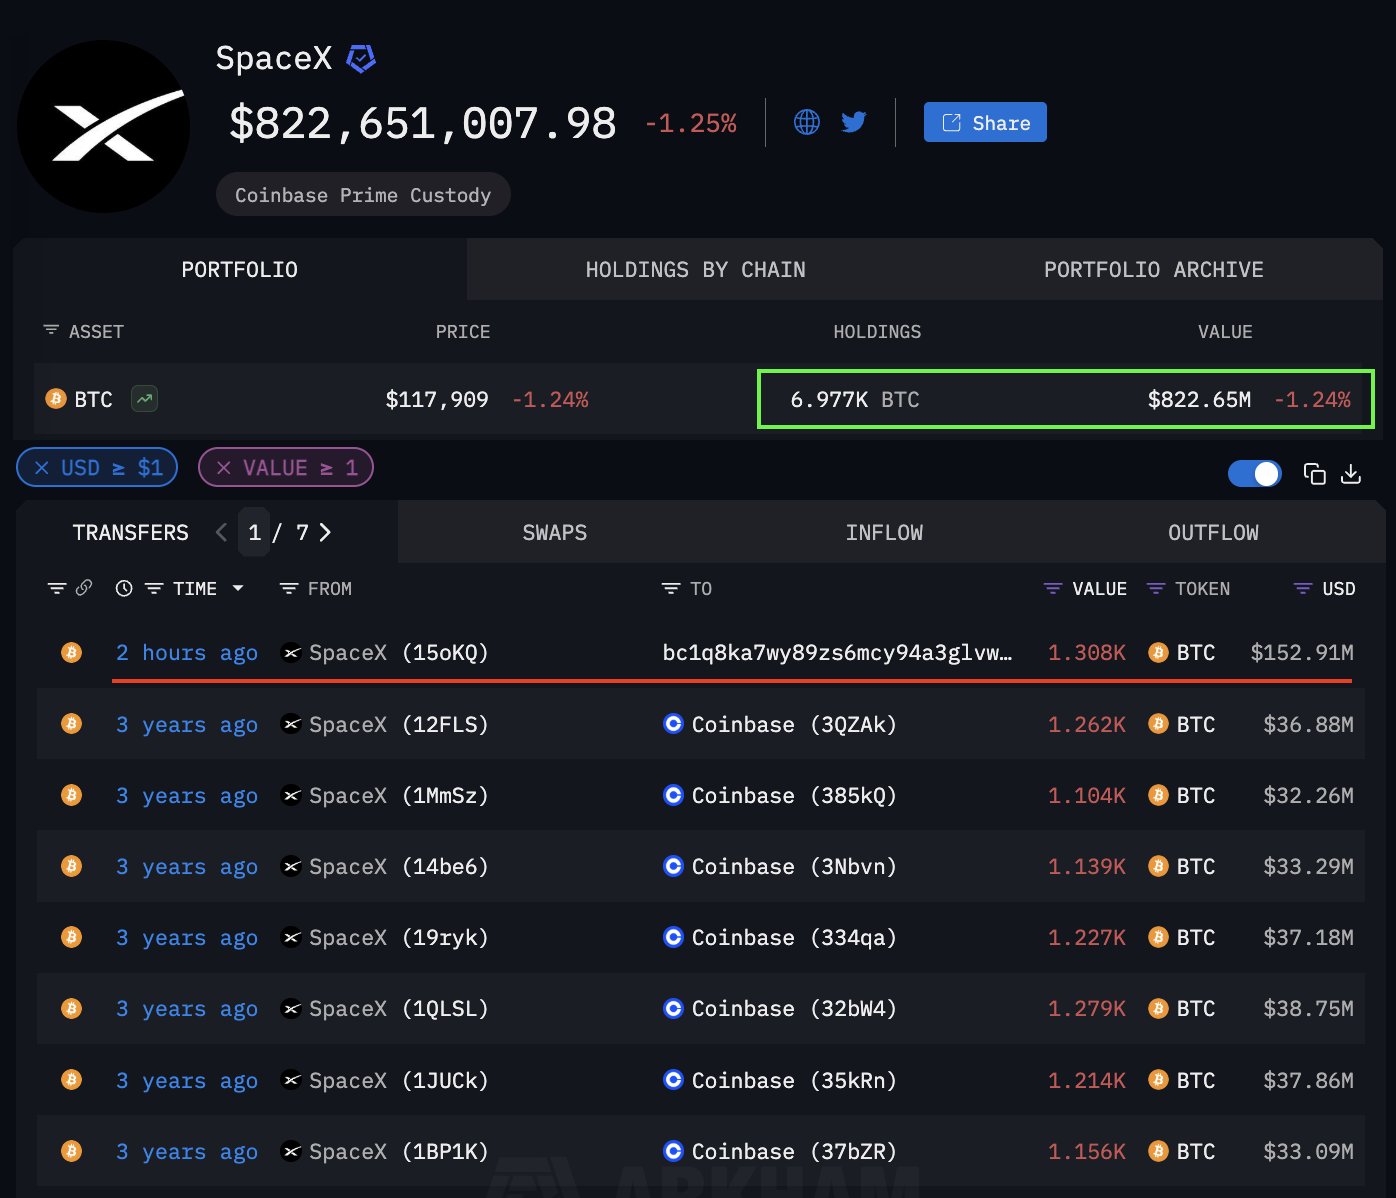
SpaceX BTC holdings | Source: Spot On Chain
Bitcoin price remained stable above $118,000 following SpaceX's BTC transfer, with Glassnode's 'Market Pulse' report suggesting that the market remains inclined toward bullish speculation.
Glassnode added that, "overall, market conditions reflect a healthy yet fragile balance. Seller exhaustion appears likely and ready for another potential leg up, but if profitability continues to weaken, the market may transition into a broader consolidation phase as sentiment cools and positioning normalizes."
Data spotlight: Ethereum ETF inflows steady
Interest is shifting toward altcoins, as evidenced by the steady capital inflow into Ethereum spot Exchange Traded Funds (ETFs), which captured approximately $297 million on Monday. This marks 12 consecutive days of inflows, bringing the cumulative total to $7.78 billion and the net assets to $19.60 billion.
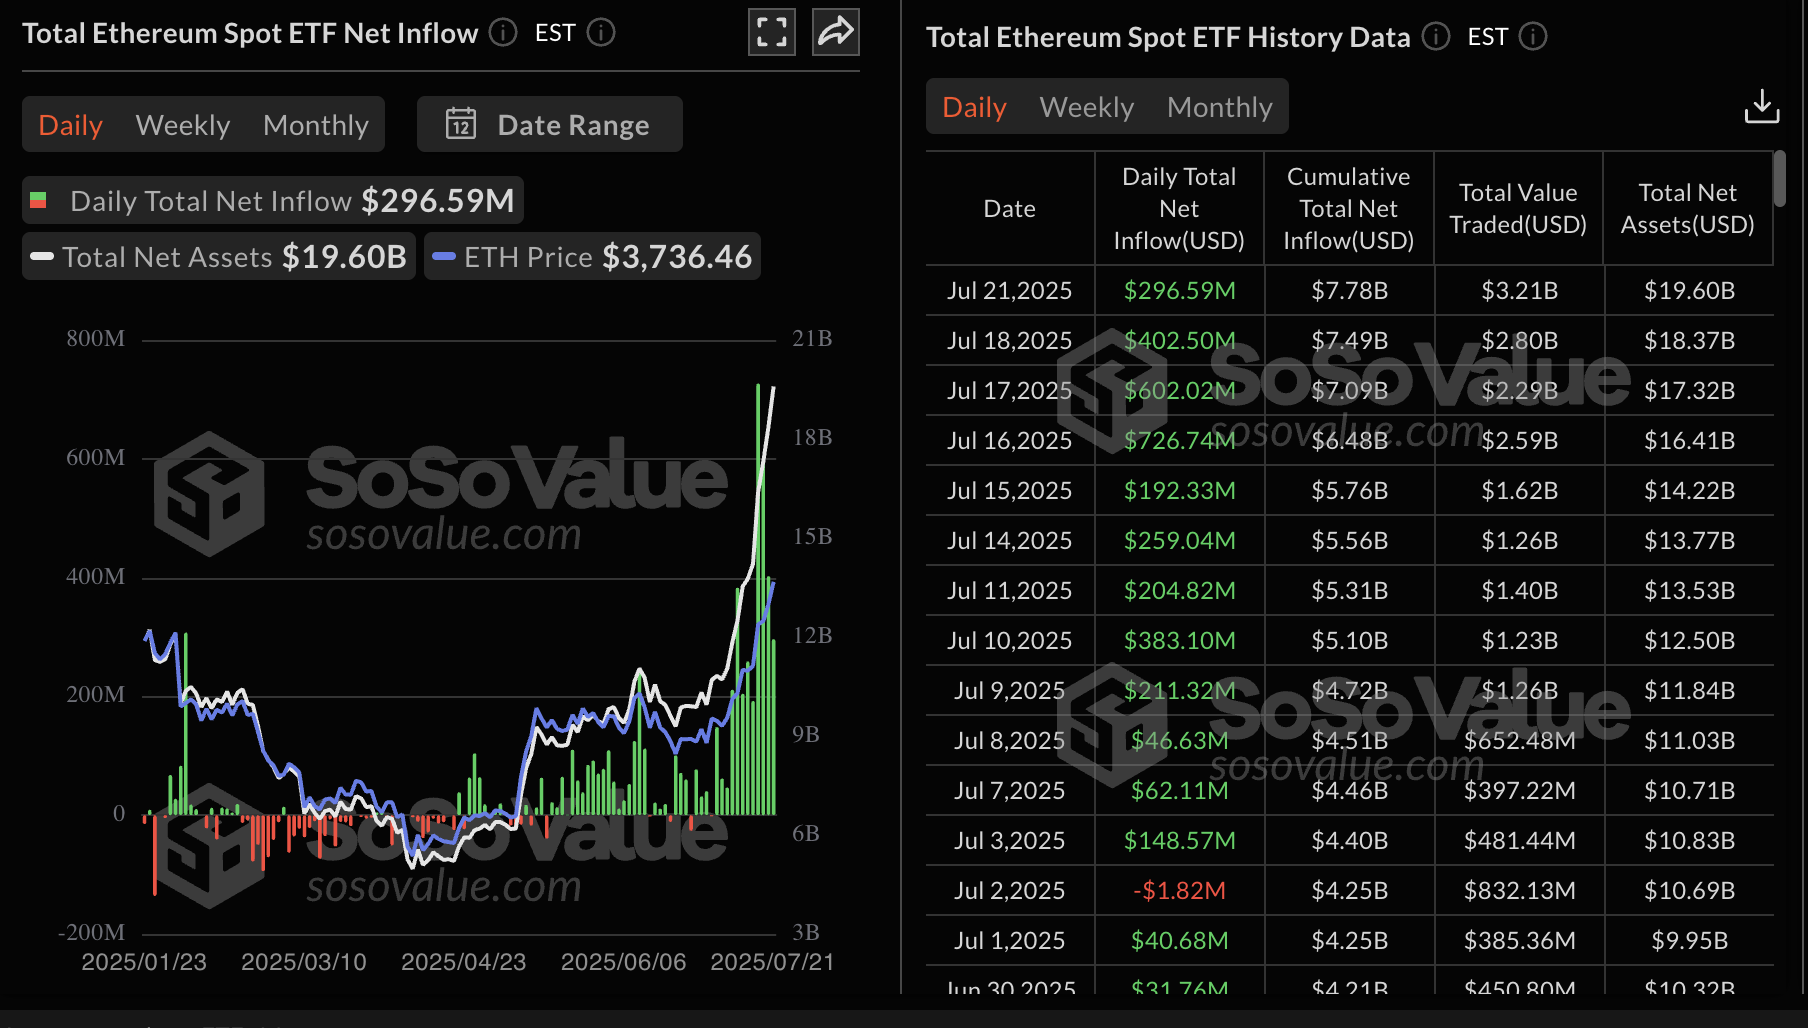
Ethereum spot ETF data | Source: SoSoValue
As for Bitcoin, spot ETFs licensed in the United States (US) have broken 12 consecutive days of net inflows, with SoSoValue highlighting $131 million outflow volume on Monday, with the total cumulative inflow averaging $54.62 billion and total net assets slightly below $152 billion.
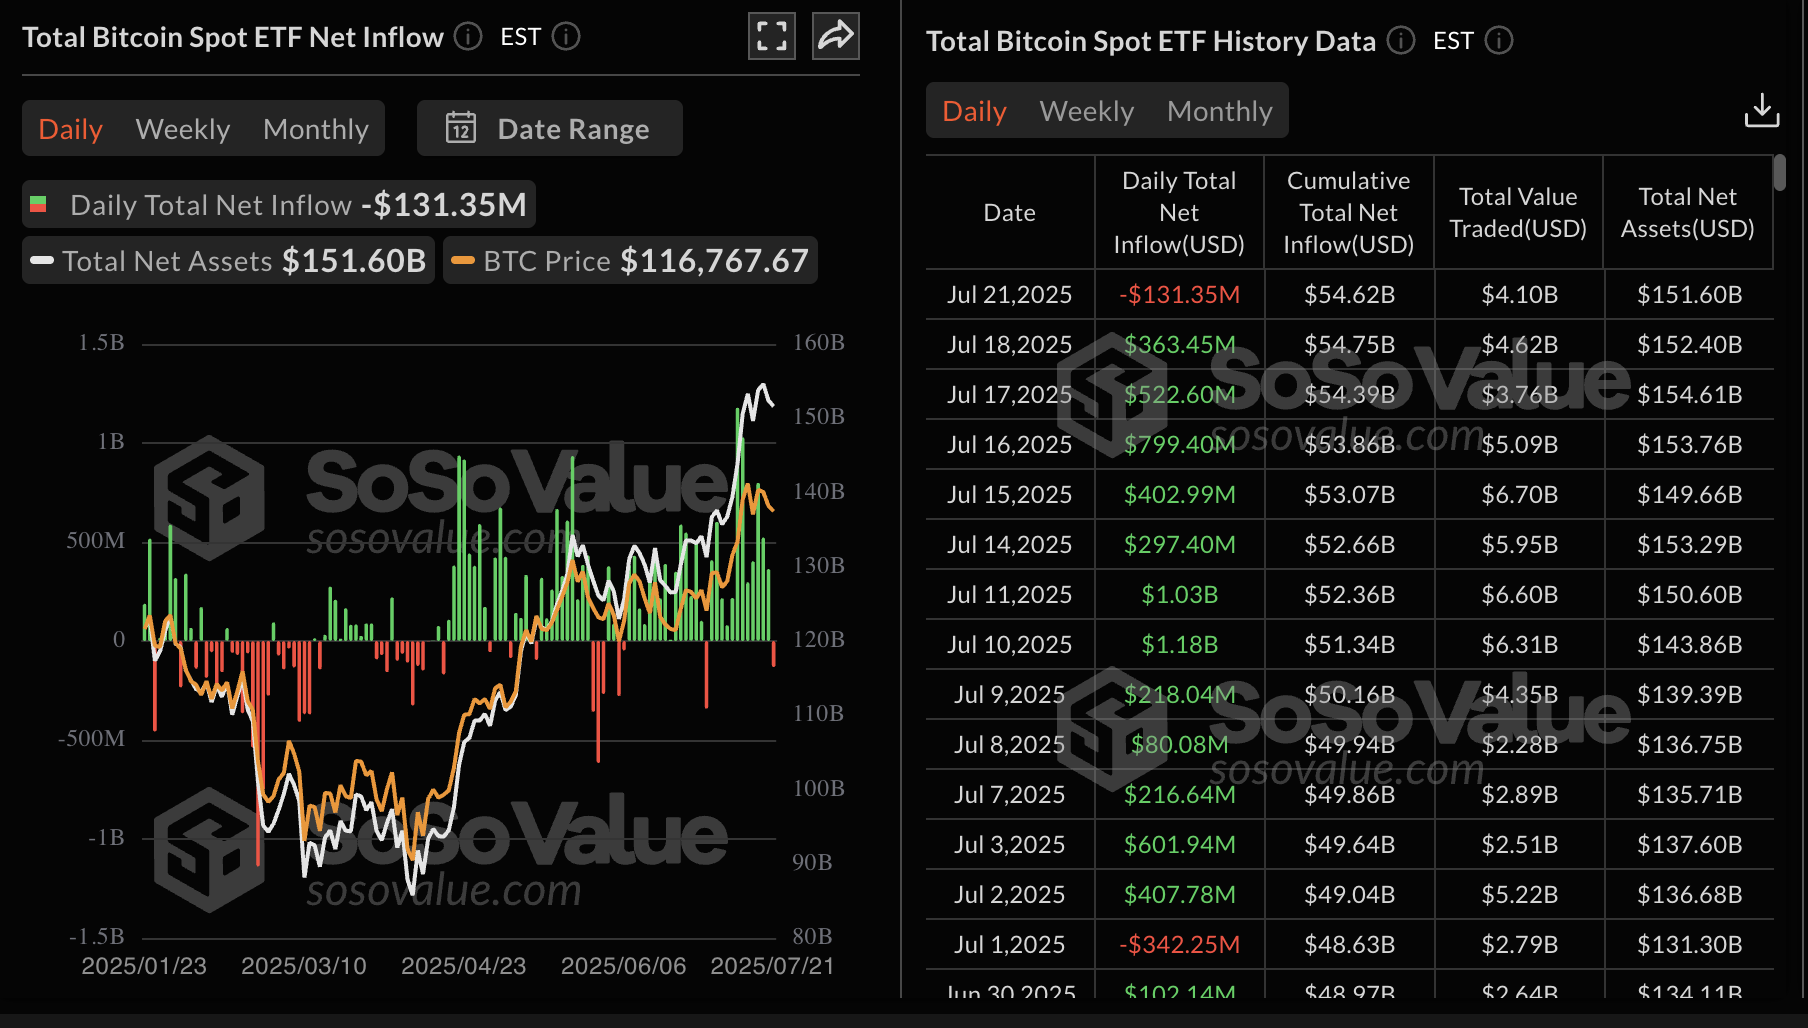
Bitcoin spot ETF data | Source: SoSoValue
Chart of the day: Bitcoin retains bullish potential
Bitcoin price showcases uptrend continuation signals, starting with the Relative Strength Index (RSI), which recently dropped from overheated levels around 60. The trend-following tool has risen to 65 at the time of writing, depicting bullish momentum building.
The position of the upward-facing moving averages, significantly below the current price, supports the solid technical structure. In the daily chart below, the 50-day Exponential Moving Average (EMA) is at $110,596, the 100-day EMA at $105,443 and the 200-day EMA at $98,512. In the event of an accelerated trend reversal, these levels would serve as tentative support.
Traders will look for a break above $120,000 to ascertain the strength of the uptrend. Above this limit, the next key hurdle is the record high of $123,218, followed by the next milestone at $125,000.
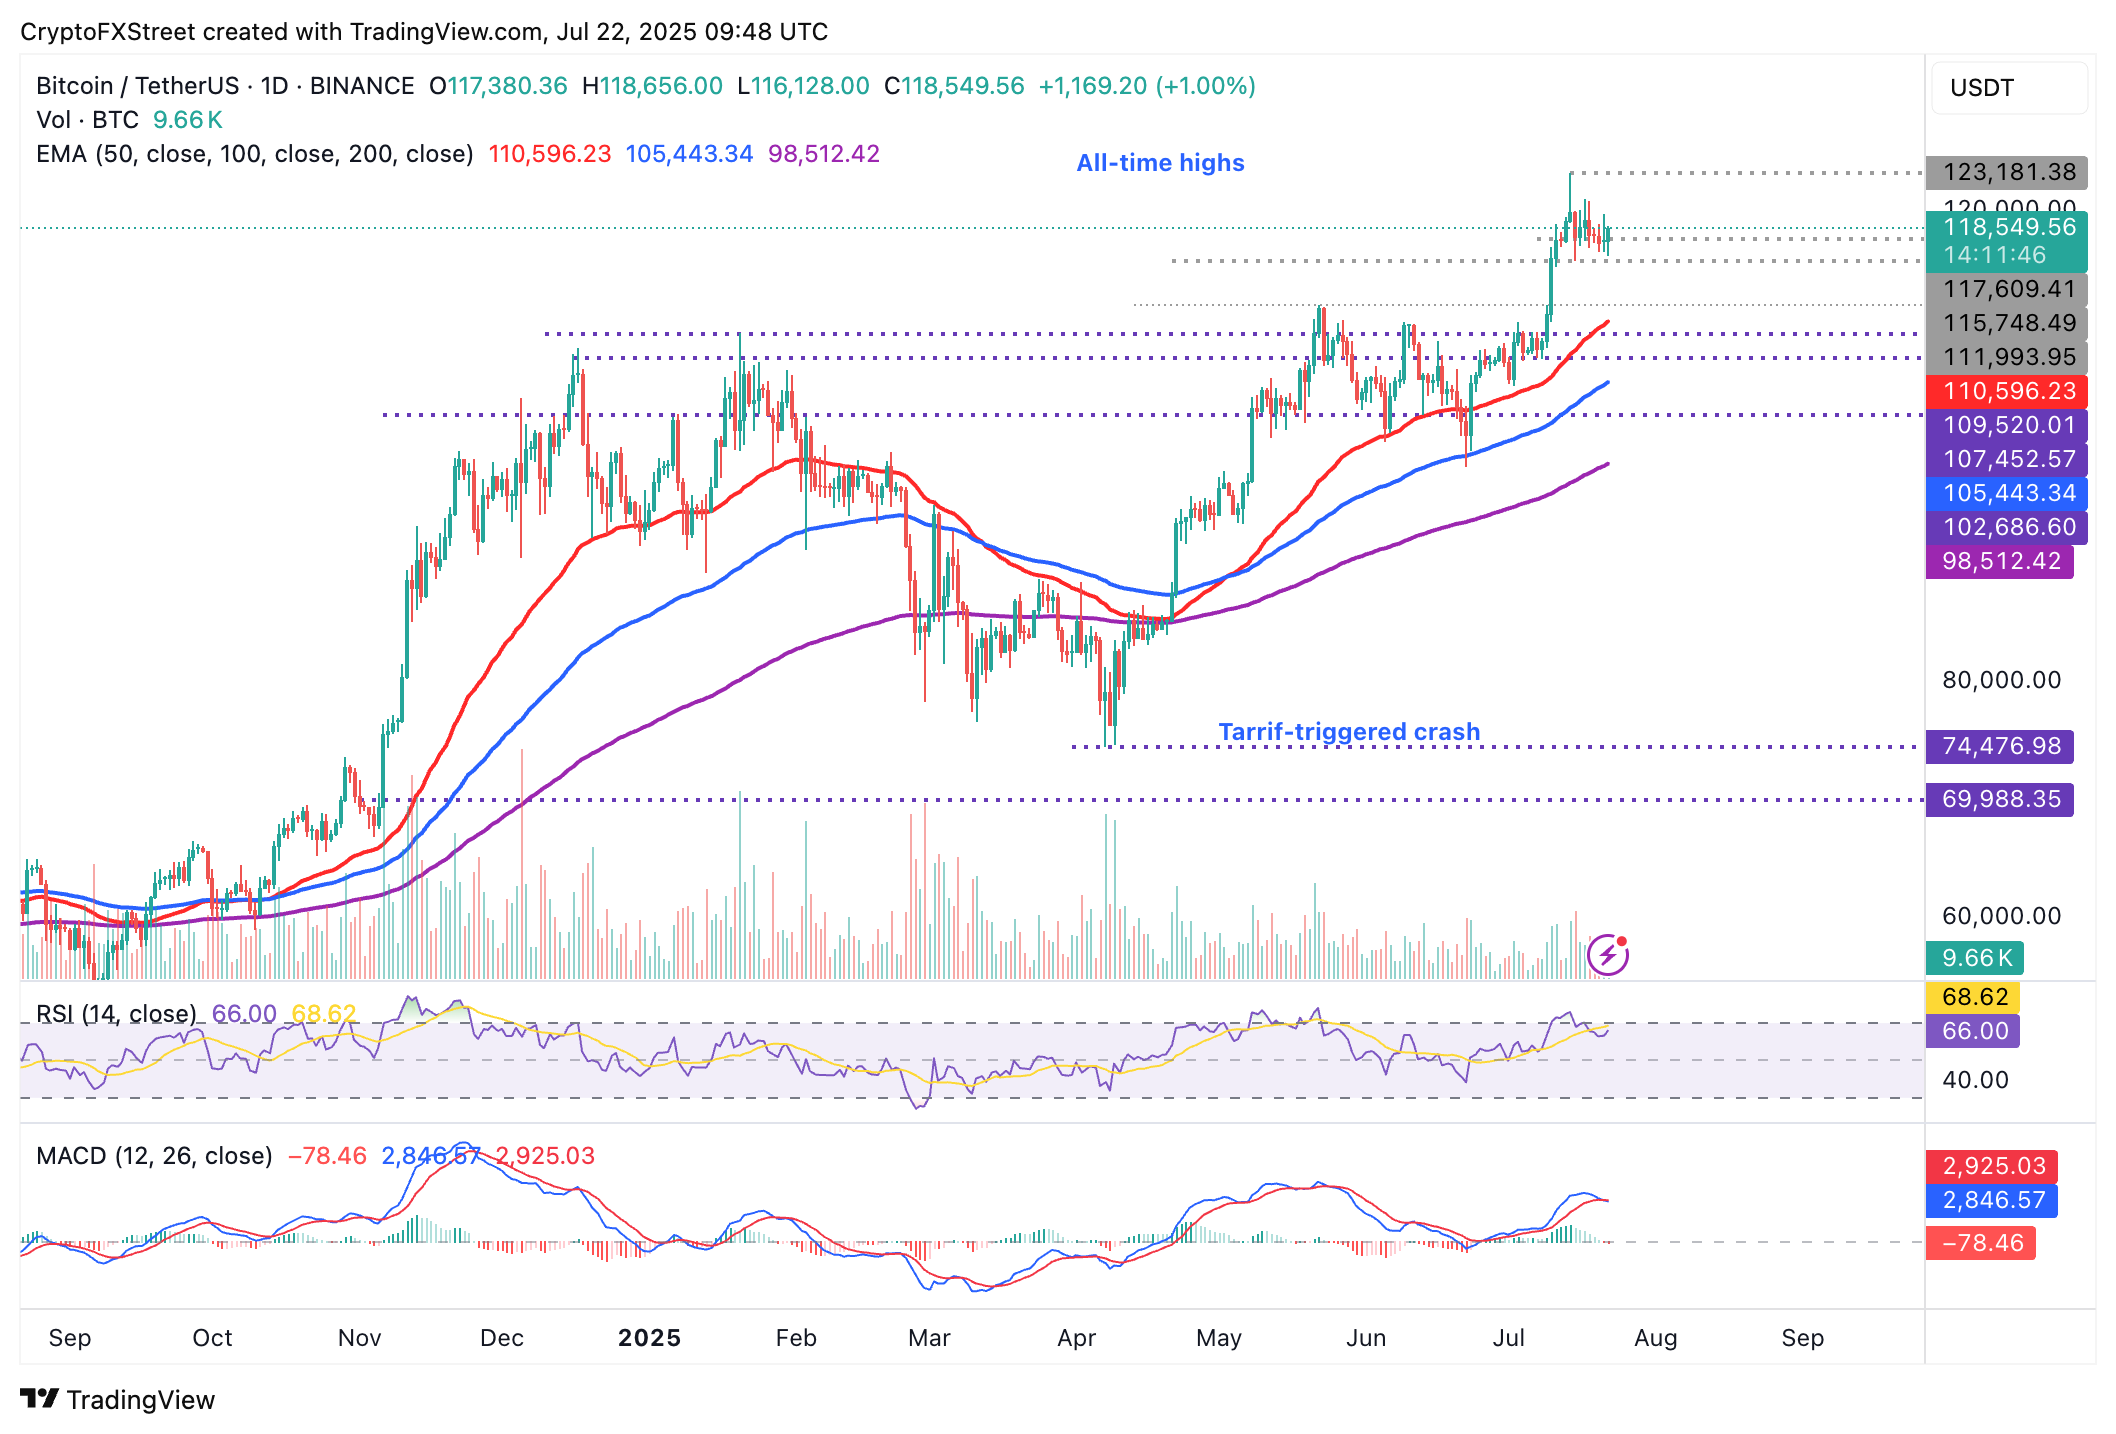
BTC/USDT daily chart
Traders should also move with caution, considering the Moving Average Convergence Divergence (MACD) is in the process of validating a sell signal. The blue MACD line must hold below the red line to confirm the signal, prompting traders to reduce their exposure.
Altcoins update: Ethereum, XRP retreat
Ethereum price is declining after reaching a high of $3,860 on Monday. The RSI remains relatively overheated at around 79. If the RSI continues to retreat into neutral territory, ETH reversal could accelerate below short-term support at $3,600. Other key tentative support levels include $3,500, which was tested as resistance in January, and $3,217, which served as support in December.
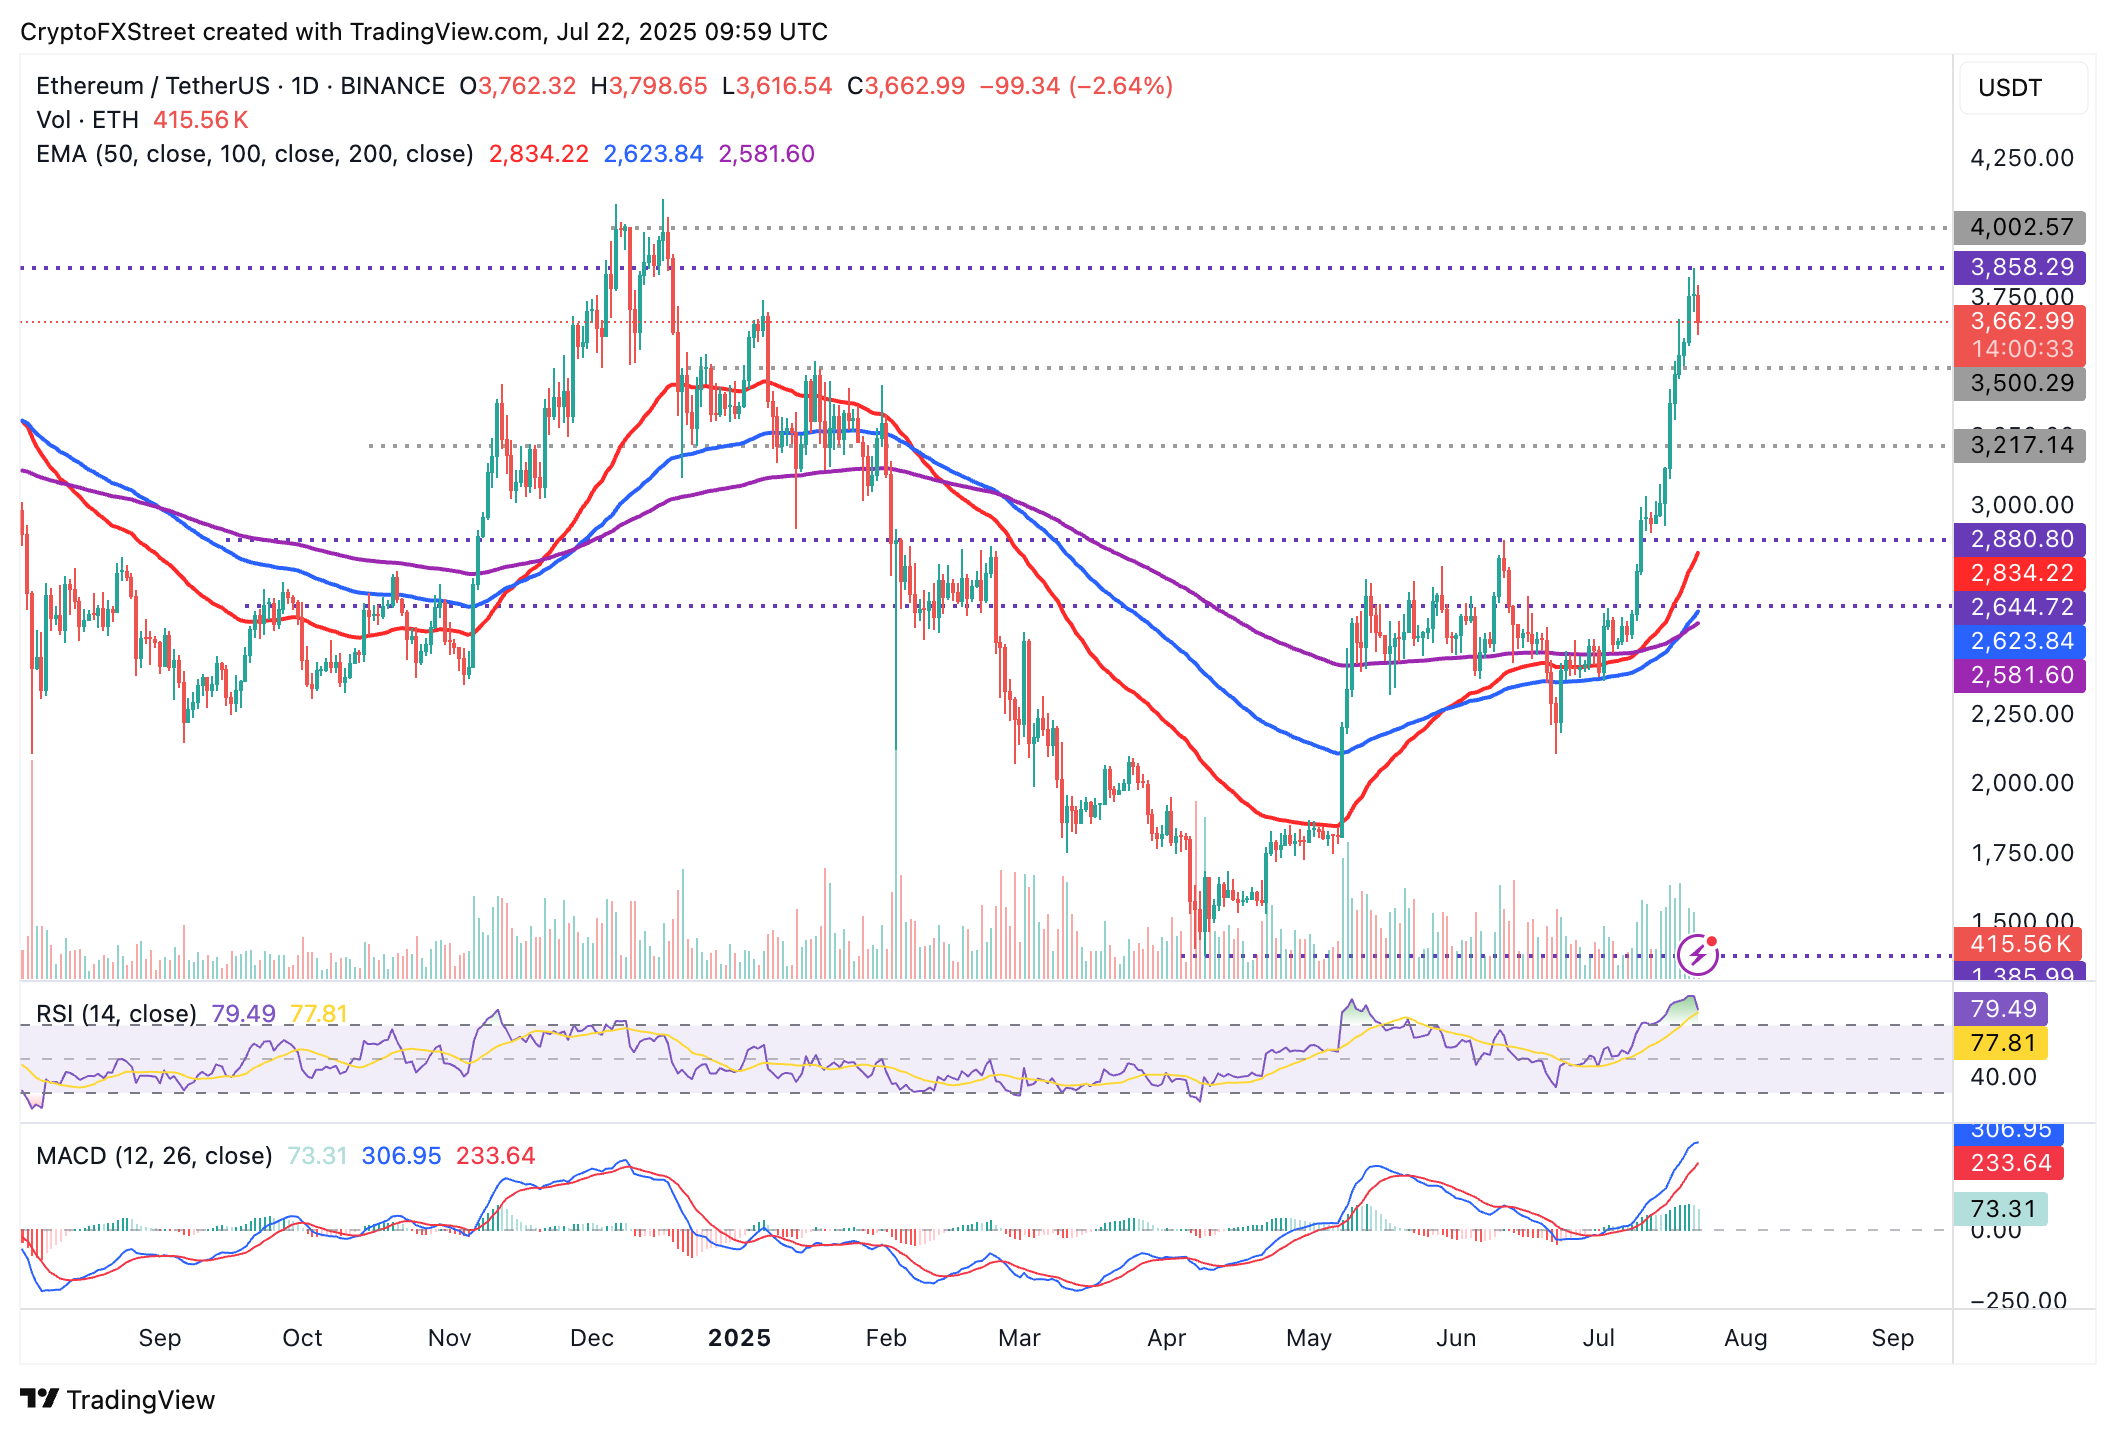
ETH/USD daily chart
Still, bulls cannot be shrugged off now that two Gold Cross patterns have been confirmed on the daily chart. The first pattern was confirmed on July 10 when the 50-day EMA crossed above the 200-day EMA, and the second one on July 20 when the 100-day EMA settled above the 200-day EMA.
Apart from the seller congestion at $3,858, the next critical level is at $4,000, which, if broken, could boost Ethereum price toward the record high of $4,878.
As for XRP, bears appear to be regaining control, pushing for a red candle for the first time in three days. Following the rejection from the record high at $3.66, XRP retreated to $3.42 before rising to trade at $3.48 at the time of writing.
The RSI signals overheated market conditions at 80, down from highs around 88. An extended drop into neutral territory would signal a reduction in buying pressure. Persistent weakness of the uptrend could trigger profit-taking activities, intensifying overhead pressure.
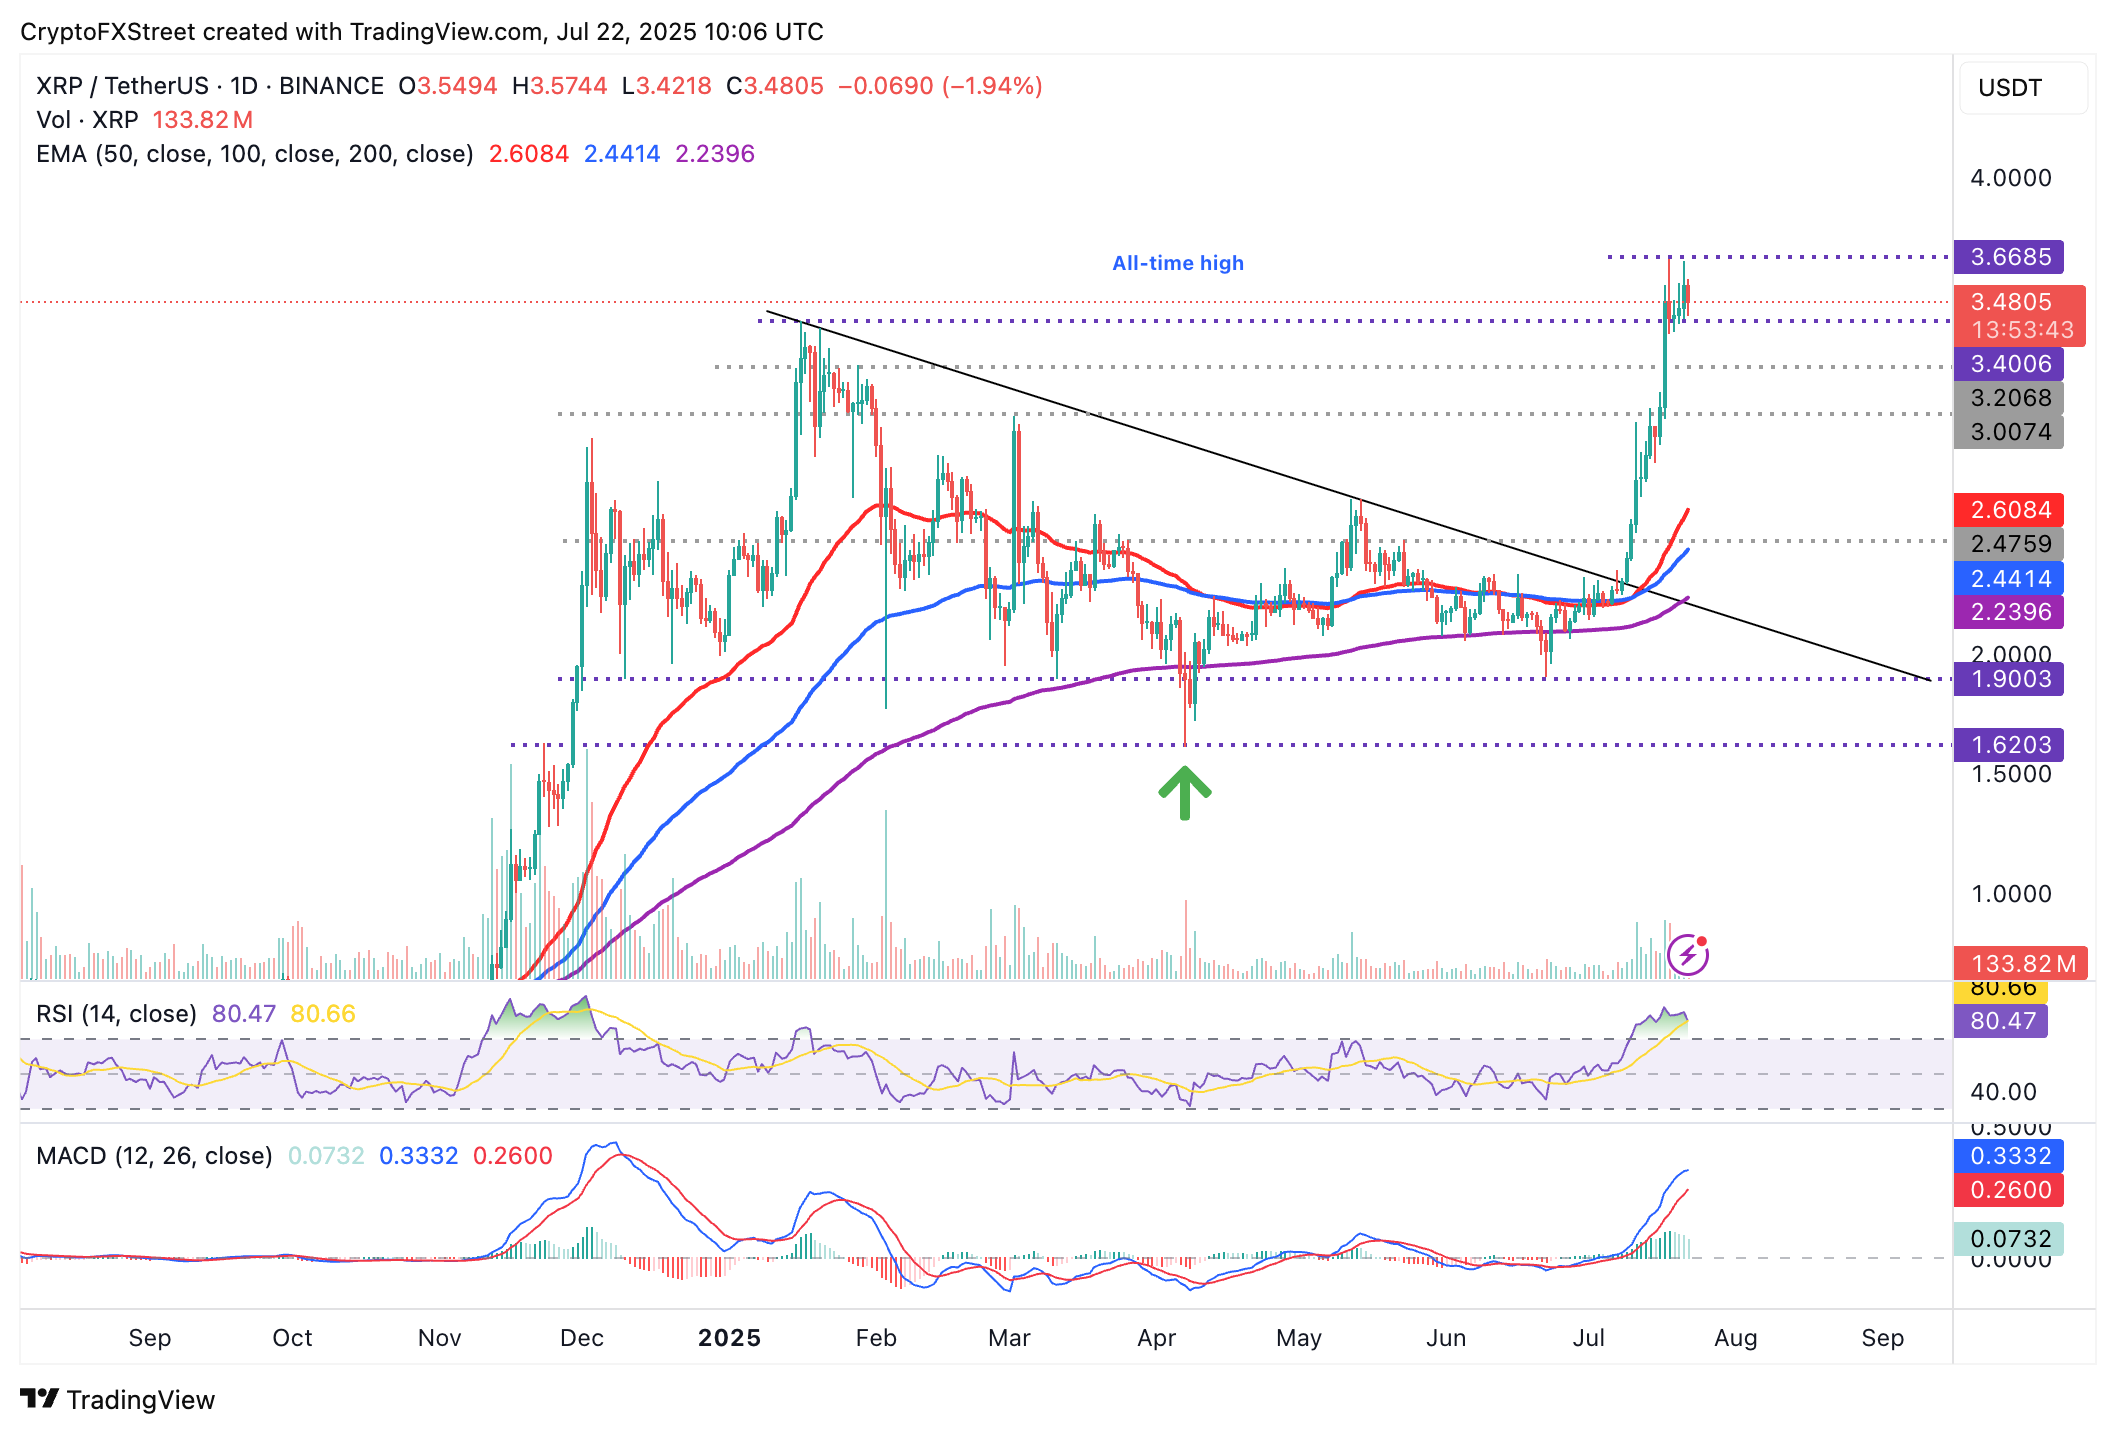
XRP/USD daily chart
A sideways price action could follow the run to new all-time highs, with resistance at $3.66 and support at $3.40. On the other hand, a breakout toward $4.00 will ensue if traders ignore short-term volatility and focus on the robust technical structure bolstered by the Golden Cross pattern triggered when the 50-day EMA crossed above the 100-day EMA on July 13.
Cryptocurrency metrics FAQs
The developer or creator of each cryptocurrency decides on the total number of tokens that can be minted or issued. Only a certain number of these assets can be minted by mining, staking or other mechanisms. This is defined by the algorithm of the underlying blockchain technology. On the other hand, circulating supply can also be decreased via actions such as burning tokens, or mistakenly sending assets to addresses of other incompatible blockchains.
Market capitalization is the result of multiplying the circulating supply of a certain asset by the asset’s current market value.
Trading volume refers to the total number of tokens for a specific asset that has been transacted or exchanged between buyers and sellers within set trading hours, for example, 24 hours. It is used to gauge market sentiment, this metric combines all volumes on centralized exchanges and decentralized exchanges. Increasing trading volume often denotes the demand for a certain asset as more people are buying and selling the cryptocurrency.
Funding rates are a concept designed to encourage traders to take positions and ensure perpetual contract prices match spot markets. It defines a mechanism by exchanges to ensure that future prices and index prices periodic payments regularly converge. When the funding rate is positive, the price of the perpetual contract is higher than the mark price. This means traders who are bullish and have opened long positions pay traders who are in short positions. On the other hand, a negative funding rate means perpetual prices are below the mark price, and hence traders with short positions pay traders who have opened long positions.
추천 기사


