

Crypto Today: Bitcoin recovery stalls below $120,000 as Ethereum, XRP rally gains momentum
- Bitcoin consolidates around $118,000 on Thursday amid cooling volume and rising spot ETF inflows.
- Ethereum rally extends, nearing $3,500, supported by a robust technical structure and growing institutional appetite.
- XRP bulls aim for record highs after breaking above $3.00 resistance.
The cryptocurrency market appears to be gearing up for a major run, evidenced by Ethereum (ETH) and Ripple’s (XRP) breakout in the last 24 hours. As Bitcoin’s (BTC) recovery stalled under $120,000 on Wednesday, the two leading altcoins extended gains above key resistance levels, suggesting potential capital rotation into mid and large-cap altcoins.
Market overview: US House ‘Crypto Week’ back on track
The United States (US) House of Representatives’ self-proclaimed ‘Crypto Week’ is back on track after the lawmakers cleared a procedural bottleneck, allowing key crypto legislation to advance to the final votes late Wednesday. A previous vote on Tuesday had failed to advance the legislation, forcing President Donald Trump to intervene.
The House is expected to vote on the GENIUS Act on Thursday and advance it to President Trump’s desk if it passes for his signature. Notably, the CLARITY Act could undergo the final vote next week before the House goes on recess in early August. Moreover, the Senate will have to vote on the Market Structure CLARITY Act before it can reach the President’s desk for signing.
Passing all three crypto bills, including the GENIUS Act, the CLARITY Act, and the Anti-Central Bank Digital Asset (CBDC), is expected to foster clear regulations for digital assets in the US.
One of President Trump’s campaign promises was to remove the legislative hurdles that have been stifling innovation and ensure clear regulations that will help build America as the global leader in cryptocurrency.
The Bitcoin price did not react to the House’s successful procedural vote and continues to consolidate at around $118,000 during the European session. Altcoins, including Ethereum and XRP, edge higher at the time of writing, showing no signs of fatigue.
Data spotlight: Bitcoin, Ethereum ETF inflows rising
Ethereum spot Exchange Traded Funds (ETFs) recorded the highest inflow on record of approximately $726 million on Wednesday, marking a significant increase from the previous day’s $192 million. This surge in US ETH spot ETFs underscores the growing institutional interest in Ethereum, resulting in a cumulative total net inflow of $6.48 billion and total net assets of $16.41 billion.
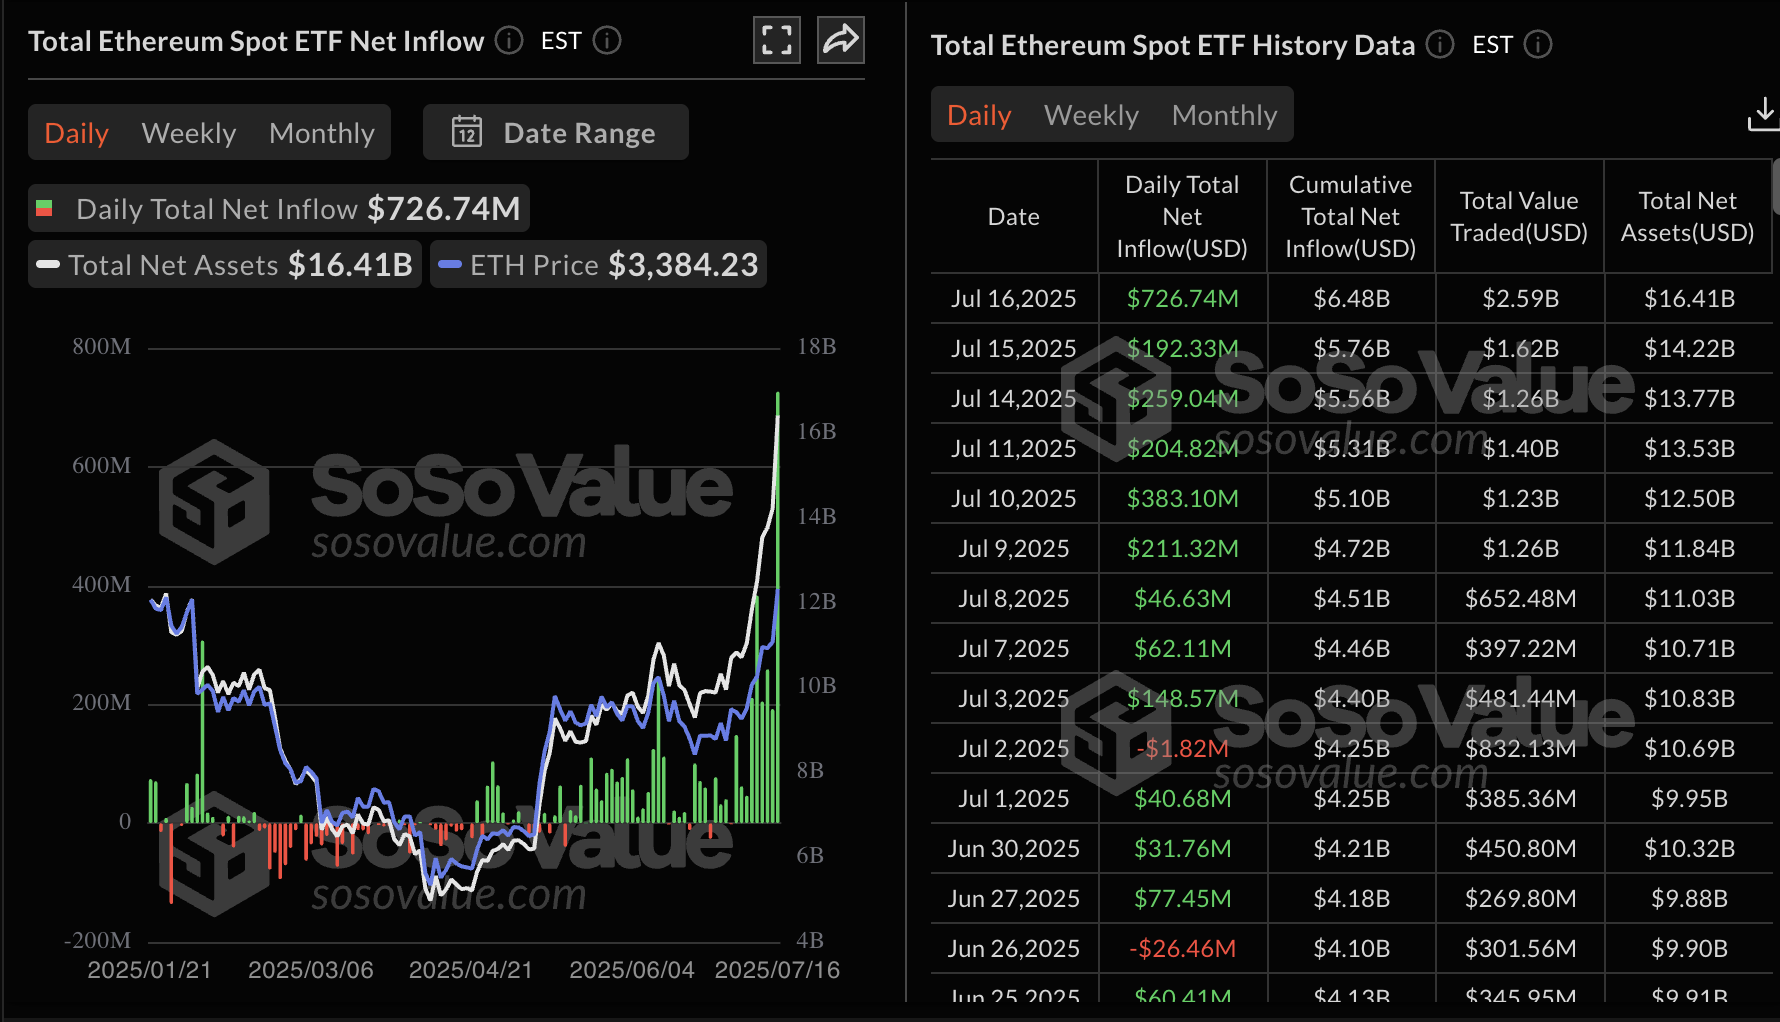
Ethereum spot ETF data | Source: SoSoValue
As for Bitcoin spot ETFs, the inflow volume almost doubled from Tuesday’s $403 million to an average $799 million on Wednesday. None of the 12 ETFs licensed in the US experienced outflows, with BlackRock’s IBIT emerging as the best-performer with roughly $764 million streaming in.
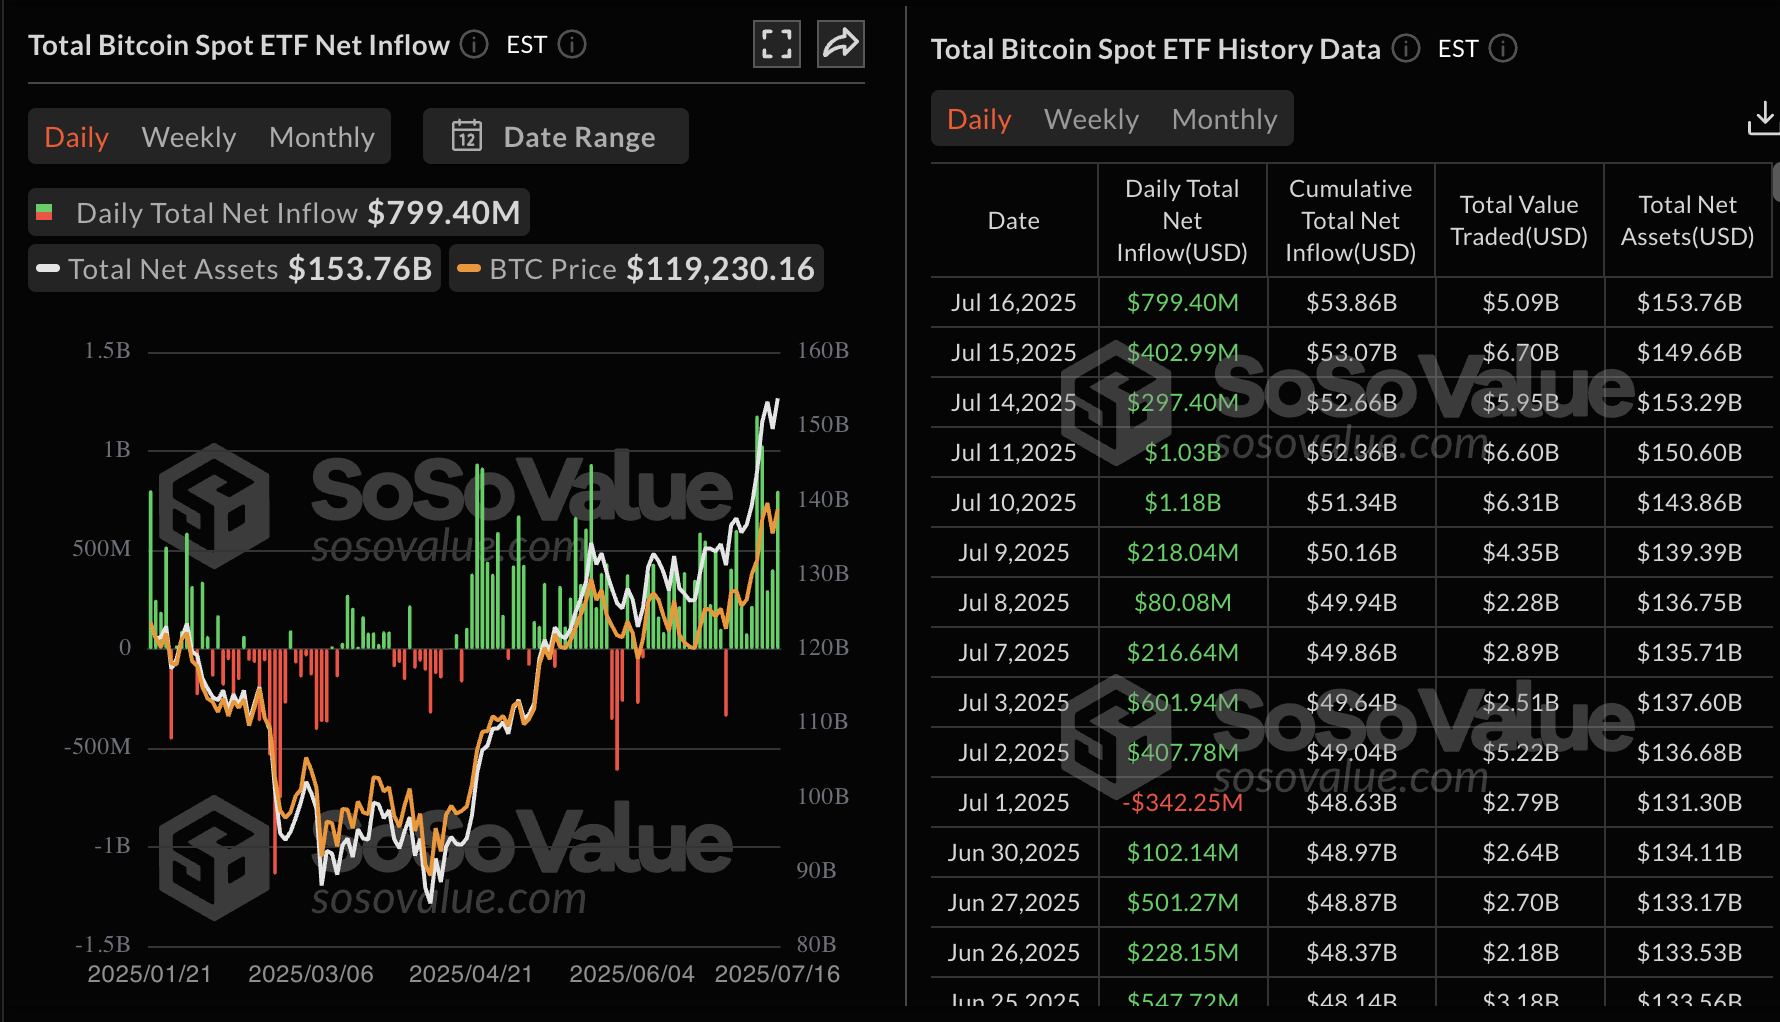
Bitcoin spot ETF data | Source: SoSoValue
Chart of the day: Bitcoin consolidates ahead of another breakout
Bitcoin price shows signs of consolidation, with bulls aiming for highs above $120,000. A recovery attempt on Wednesday failed to breach the $120,000 hurdle, resulting in a brief correction to the daily low of $117,017.
Despite the lull in price action over the past 24 hours, Bitcoin appears technically bullish, supported by a buy signal maintained by the Moving Average Convergence Divergence (MACD) indicator since June 26.
The blue MACD line crossing above the red signal line indicated a buy signal for traders to consider buying BTC. If the signal holds with the green histogram above the zero line expanding, the path of least resistance could stay upward, thereby increasing the probability of BTC closing in on record highs of $123,218.
Still, traders should temper their bullish expectations considering the Relative Strength Index (RSI) near overbought territory at 69. Profit-taking and volatility due to macroeconomic uncertainty could result in a trend reversal toward the 50-day Exponential Moving Average (EMA) currently at $108,990.

BTC/USDT daily chart
Altcoins update: Ethereum, XRP uptrend steady
Ethereum extends the bullish outlook, closing in on the short-term resistance at $3,500 at the time of writing. Its uptrend is backed by steady institutional demand and a robust technical picture, accentuated by a Golden Cross pattern formed when the 50-day EMA crossed above the 100-day EMA on July 10. The day’s close could confirm a second Golden Cross pattern, if the 50-day EMA settles above the 200-day EMA.
Traders will look for movement above $3,500 hurdle to ascertain the uptrend’s strength as they expand their bullish scope toward $4,000. In the event of the trend reversing downward, key tentative areas worth monitoring for support include $3,217, tested in January, and $2,880, a resistance-turned-support level.
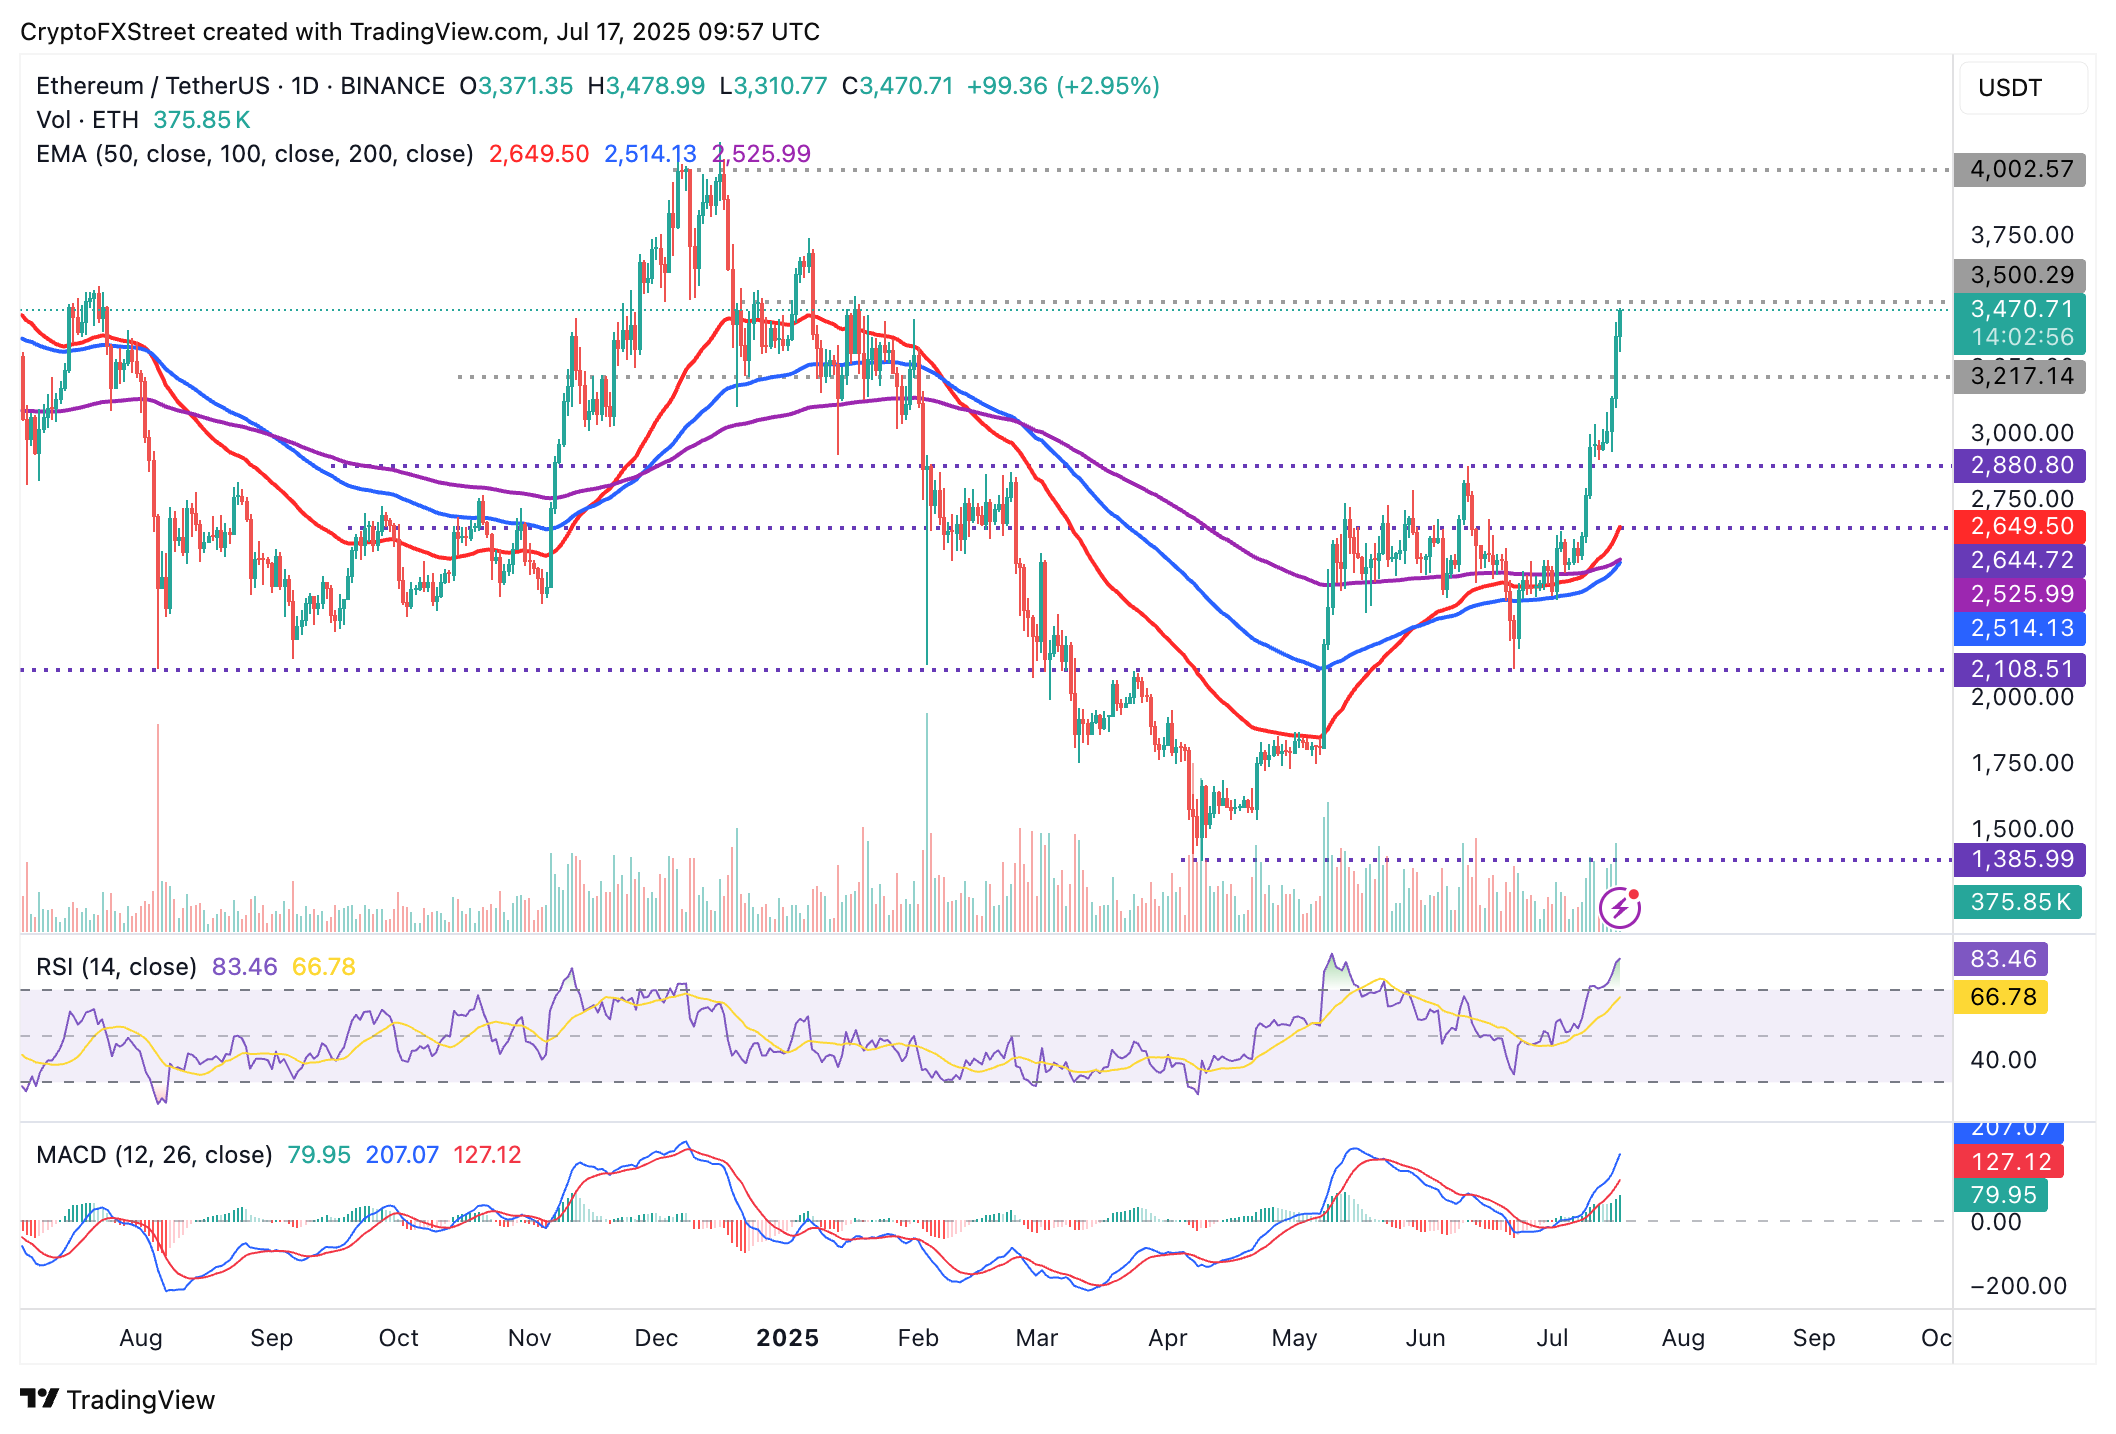
ETH/USDT daily chart
As for XRP, the path of least resistance appears to be upward, backed by several bullish signals, including a MACD indicator buy signal and the overbought, yet upward-looking RSI.
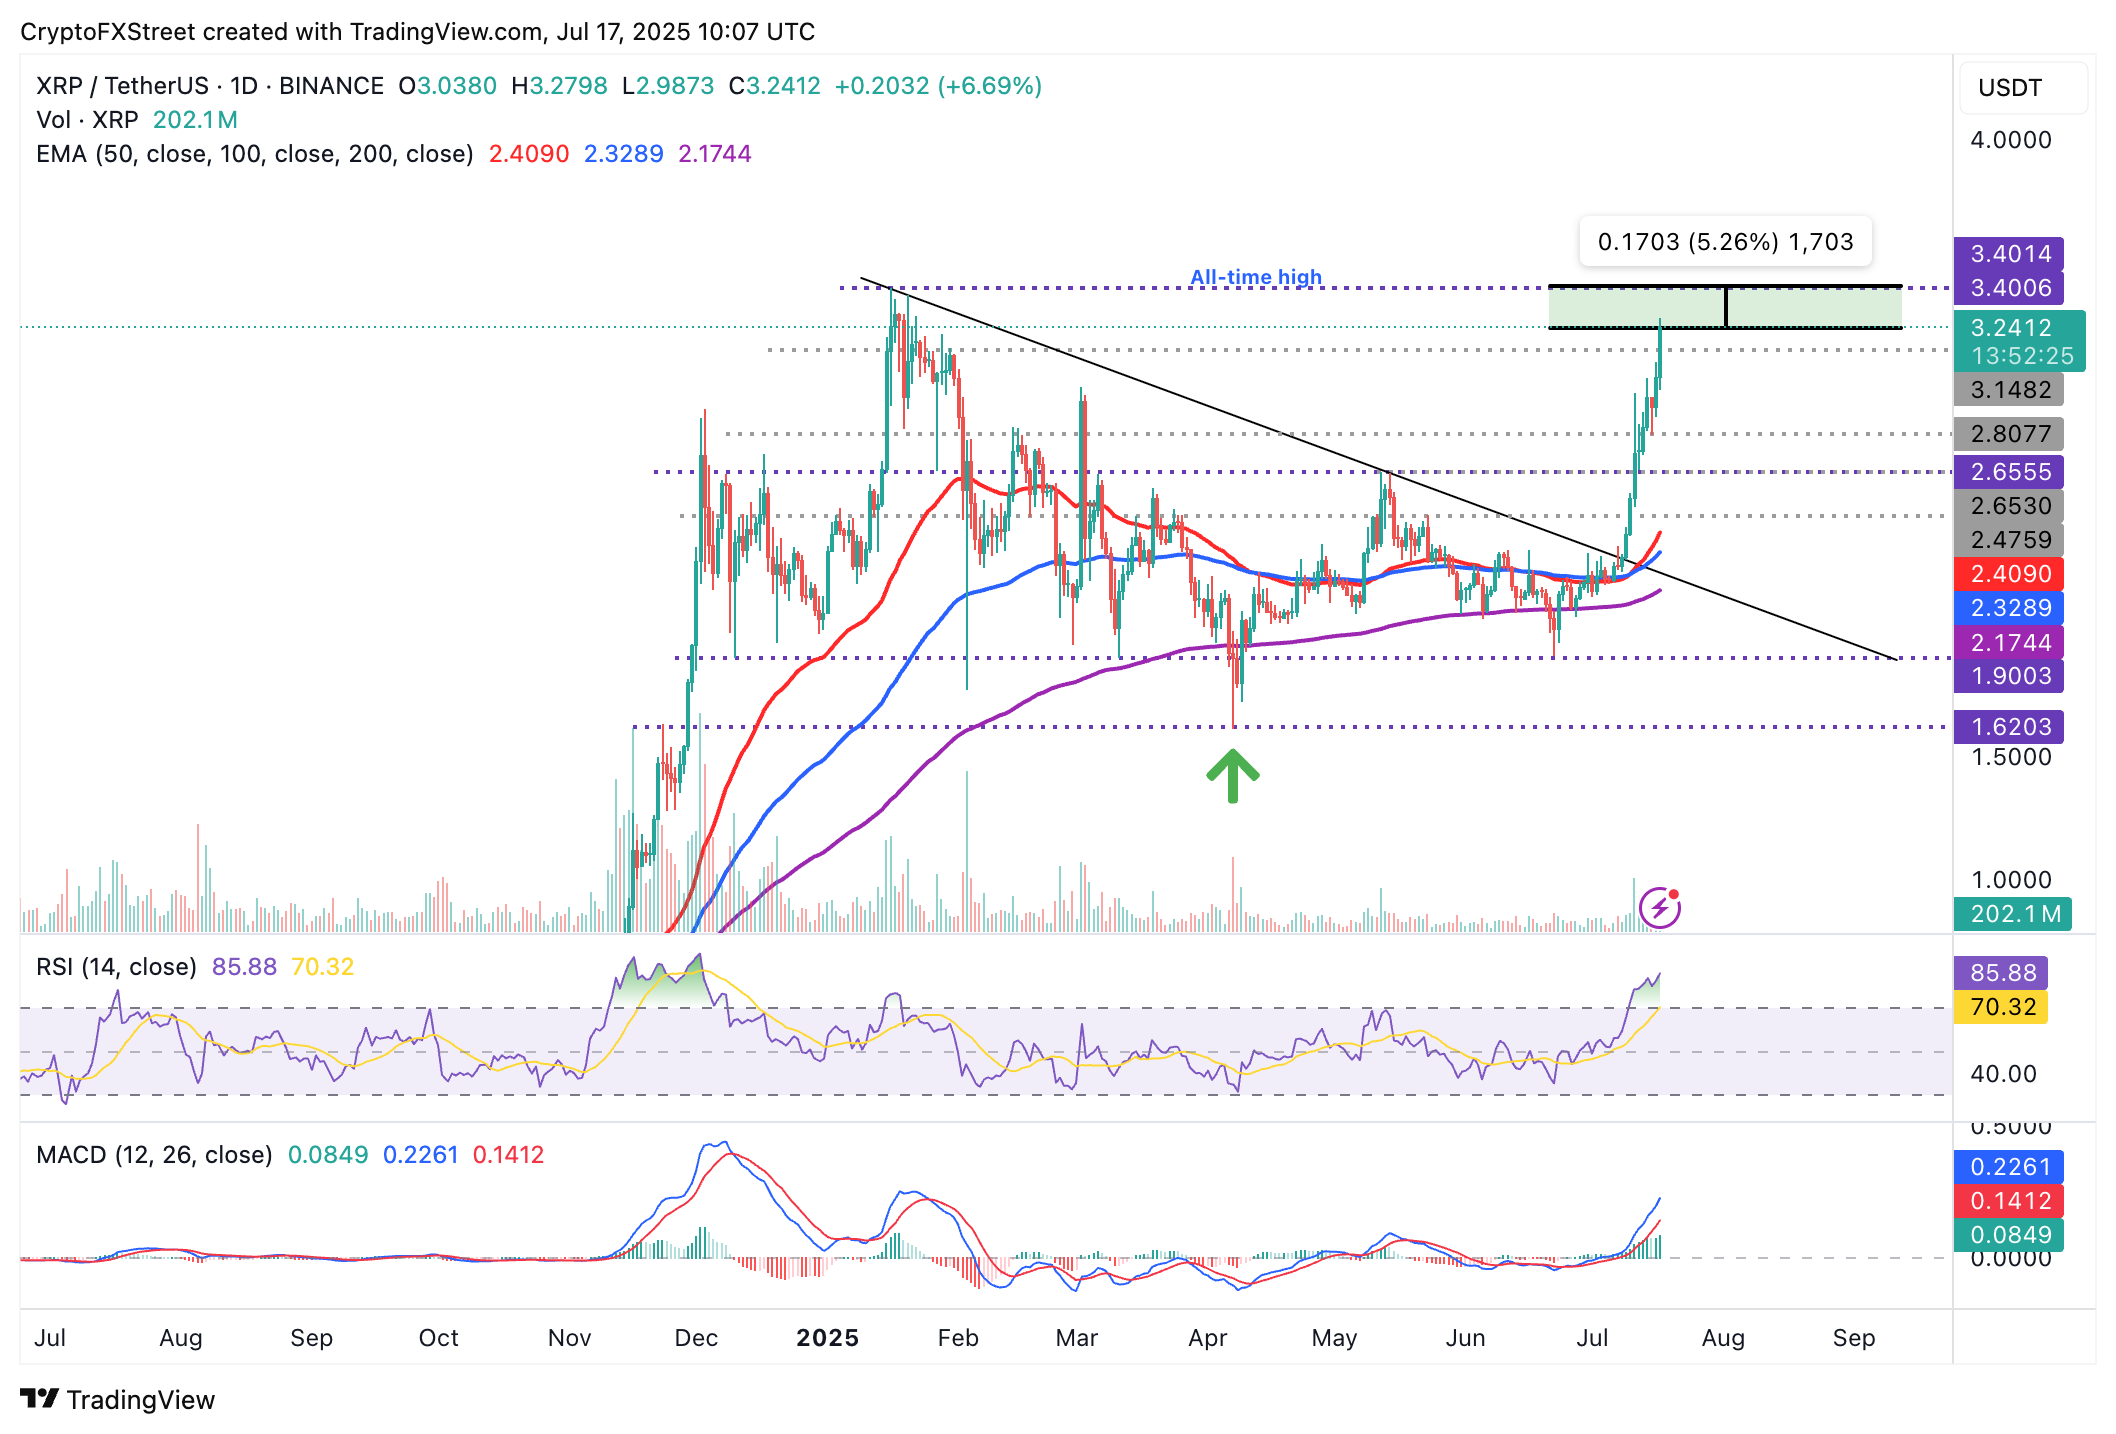
XRP/USDT daily chart
Like Ethereum, XRP has the backing of a Golden Cross Pattern as observed with the 50-day EMA above the 100-day EMA on the chart above. The token is only 5% away from reaching record highs of $3.40.
Cryptocurrency prices FAQs
Token launches influence demand and adoption among market participants. Listings on crypto exchanges deepen the liquidity for an asset and add new participants to an asset’s network. This is typically bullish for a digital asset.
A hack is an event in which an attacker captures a large volume of the asset from a DeFi bridge or hot wallet of an exchange or any other crypto platform via exploits, bugs or other methods. The exploiter then transfers these tokens out of the exchange platforms to ultimately sell or swap the assets for other cryptocurrencies or stablecoins. Such events often involve an en masse panic triggering a sell-off in the affected assets.
Macroeconomic events like the US Federal Reserve’s decision on interest rates influence crypto assets mainly through the direct impact they have on the US Dollar. An increase in interest rate typically negatively influences Bitcoin and altcoin prices, and vice versa. If the US Dollar index declines, risk assets and associated leverage for trading gets cheaper, in turn driving crypto prices higher.
Halvings are typically considered bullish events as they slash the block reward in half for miners, constricting the supply of the asset. At consistent demand if the supply reduces, the asset’s price climbs.
추천 기사


