
Meme Coins Price Prediction: DOGE, SHIB, and PEPE rise as broader crypto market recovers
- Dogecoin holds at critical support, ticking up after five consecutive days of losses.
- Shiba Inu begins the week regaining strength and targeting a key resistance trendline.
- Pepe’s trend reversal gains momentum in the 4-hour chart.
Meme coins Dogecoin (DOGE), Shiba Inu (SHIB), and Pepe (PEPE) register a bright start to the week, concurrent with the broader cryptocurrency market recovery. Dogecoin and Shiba Inu present the possibility of a double bottom reversal with a bullish RSI divergence, while Pepe’s reversal overcomes a key level as its momentum grows.
Dogecoin’s first uptick in six days
Dogecoin trades in the green by almost 1% at press time on Monday as it bounces off the $0.1710 support level formed by the lowest closing price in June. With a potential tweezer bottom in making, Dogecoin prepares for its second turnaround from this level.
This could trigger a double bottom pattern possibility with a neckline at $0.1987, the closing price of June 10. Thus, DOGE shows potential to test the immediate resistance at this level.
A potential closing above the neckline could extend the breakout rally towards the $0.2506 peak formed on May 10.
The Relative Strength Index (RSI) momentum indicator at 40 gradually recovers from the oversold boundary in the daily chart, while DOGE records a second bottom at the $0.1710 support floor. This signals a bullish RSI divergence supporting uptrend chances with significant room for growth before reaching the overbought zone.
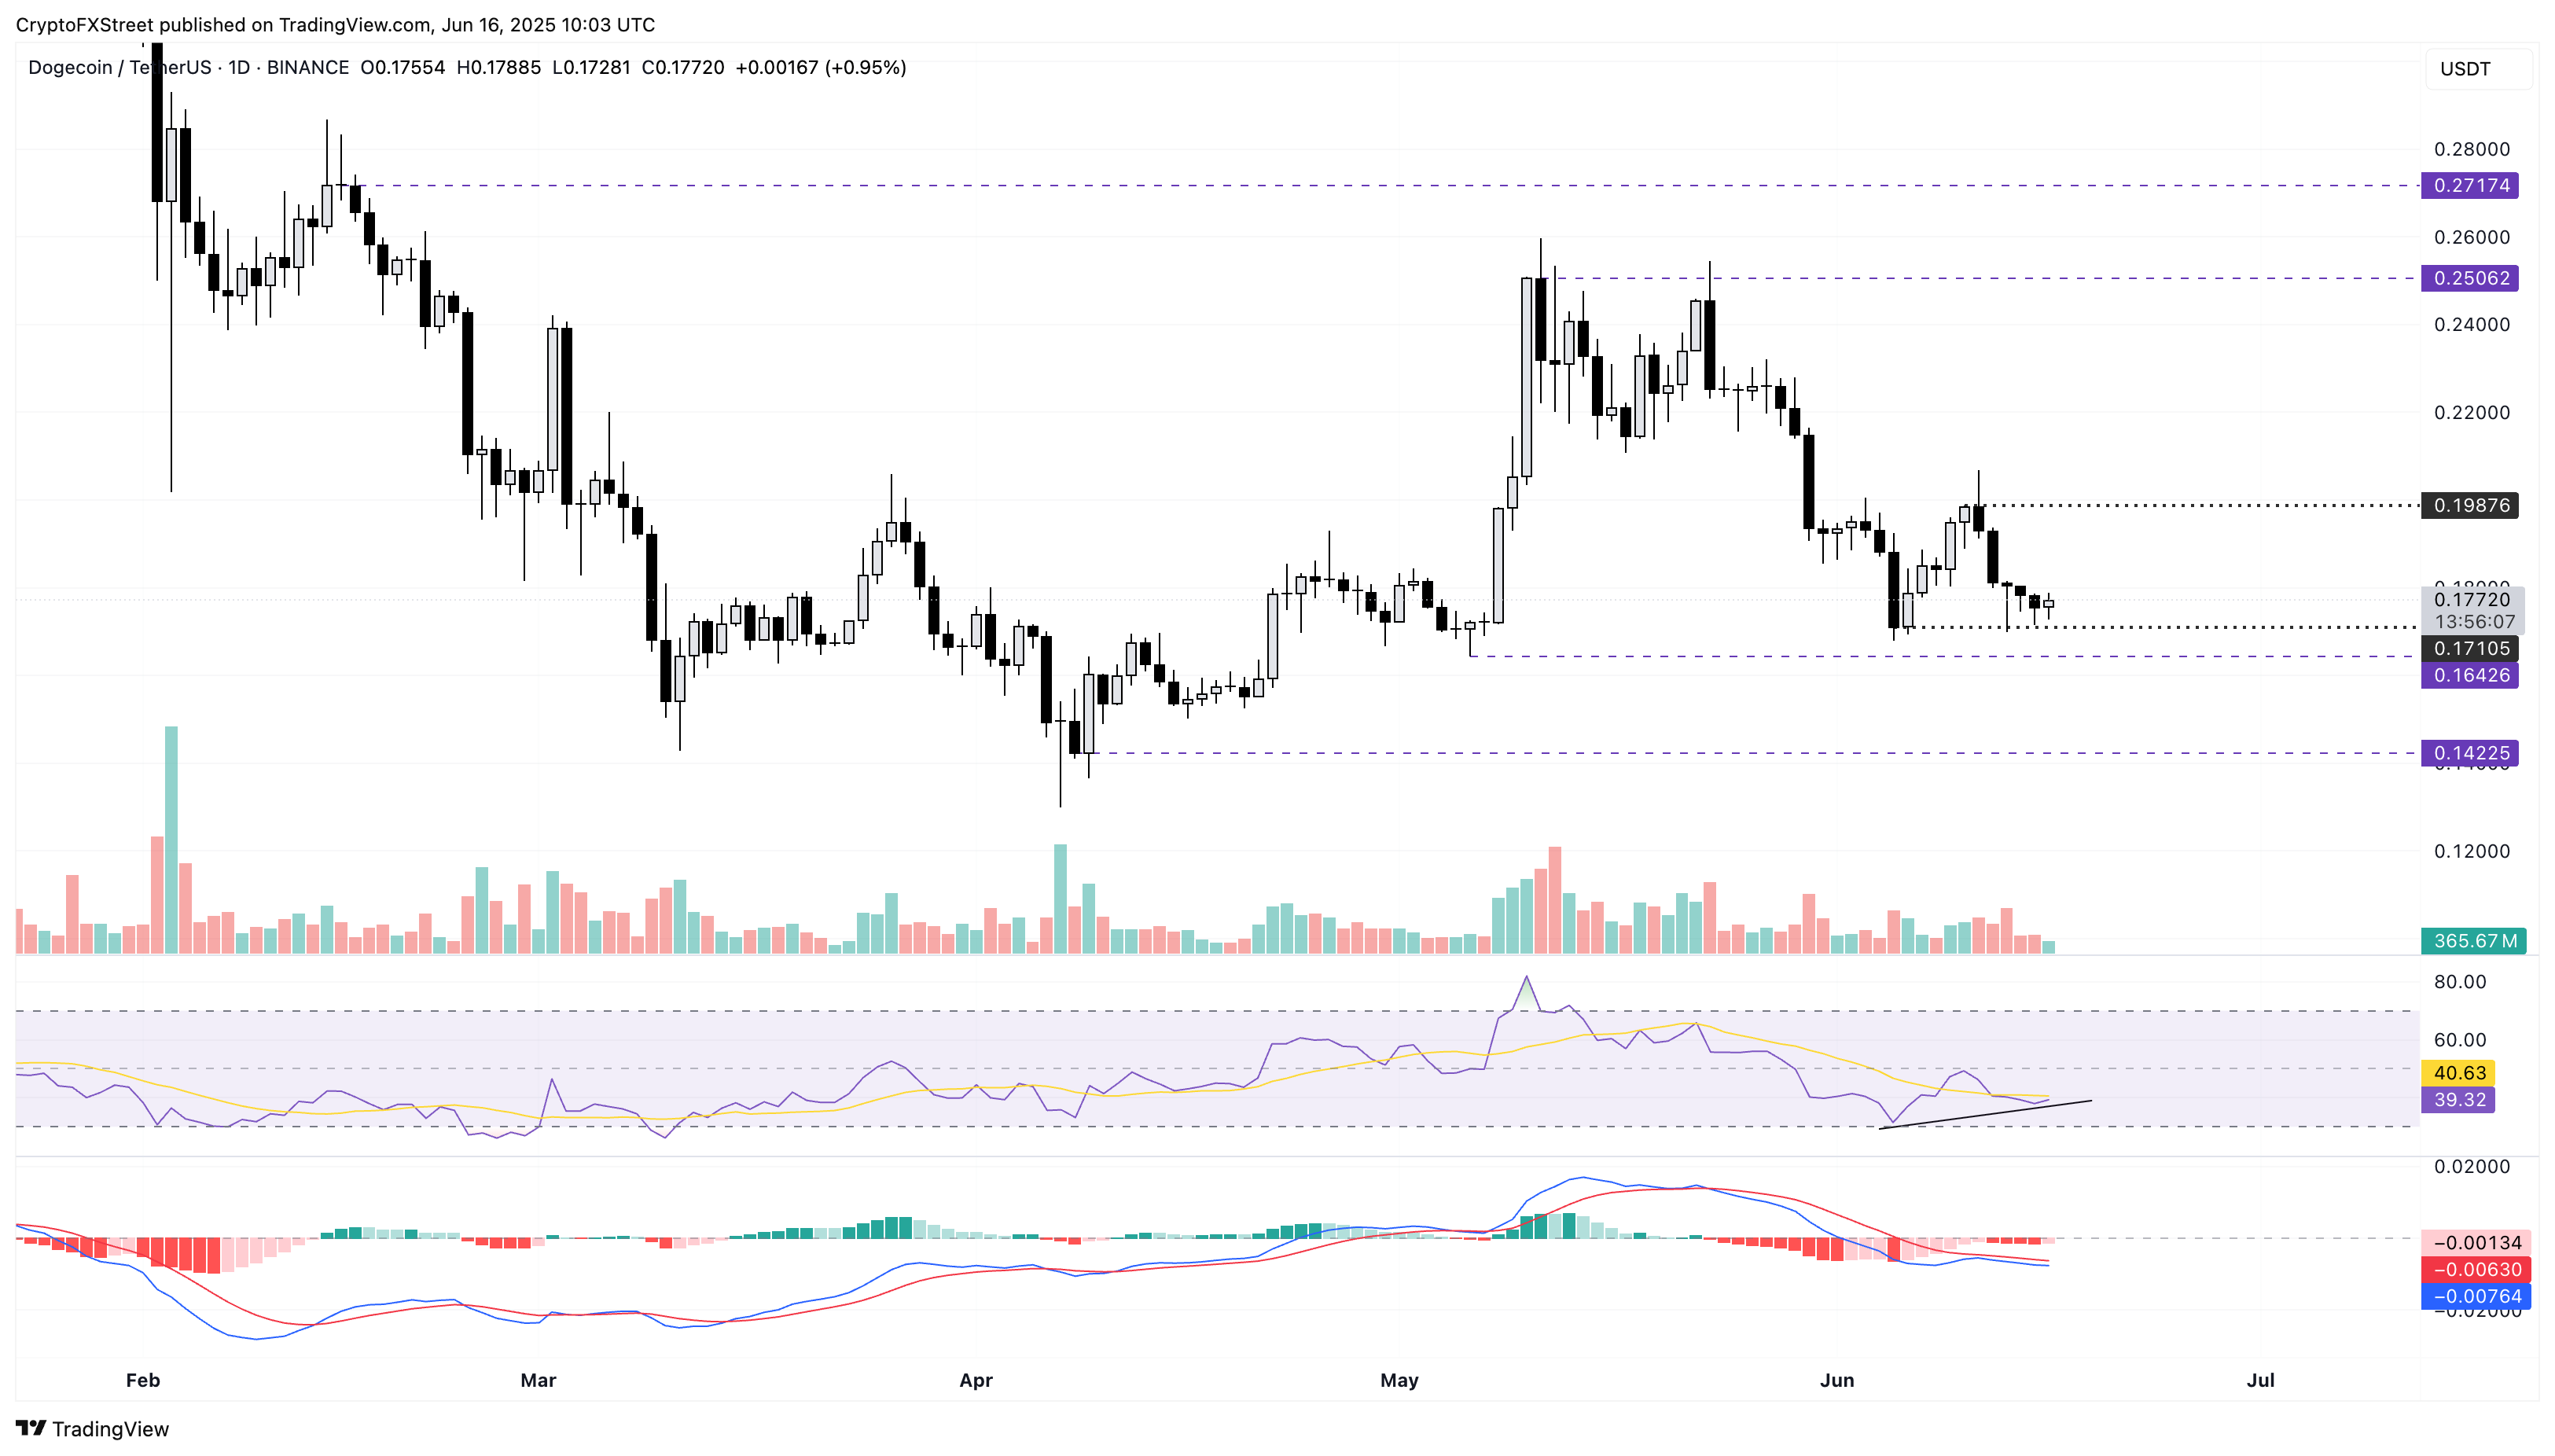
DOGE/USDT daily price chart.
However, a closing below $0.1710 will nullify the double bottom pattern. In such a scenario, DOGE could test the $0.1642 support formed on May 6.
Shiba Inu mimics Dogecoin’s double bottom recovery
Shiba Inu avoids a close below the critical support level at $0.00001220, marked by June's lowest closing (June 5) so far, despite increased pressure last week. After multiple long-tailed candles, SHIB is up by over 1% at press time on Monday, hinting at a trend reversal.
Similar to DOGE, Shiba Inu teases a double bottom pattern as it bounces off the $0.00001220 support with a neckline at $0.00001337, the highest closing price last week. A clean push in closing price above the neckline will mark the pattern breakout.
The similarity with DOGE extends to the momentum indicator as a bullish RSI divergence manifests in the daily chart. The RSI indicator at 40 shows a recovery approaching the halfway line, suggesting a gradual rise in bullish momentum.
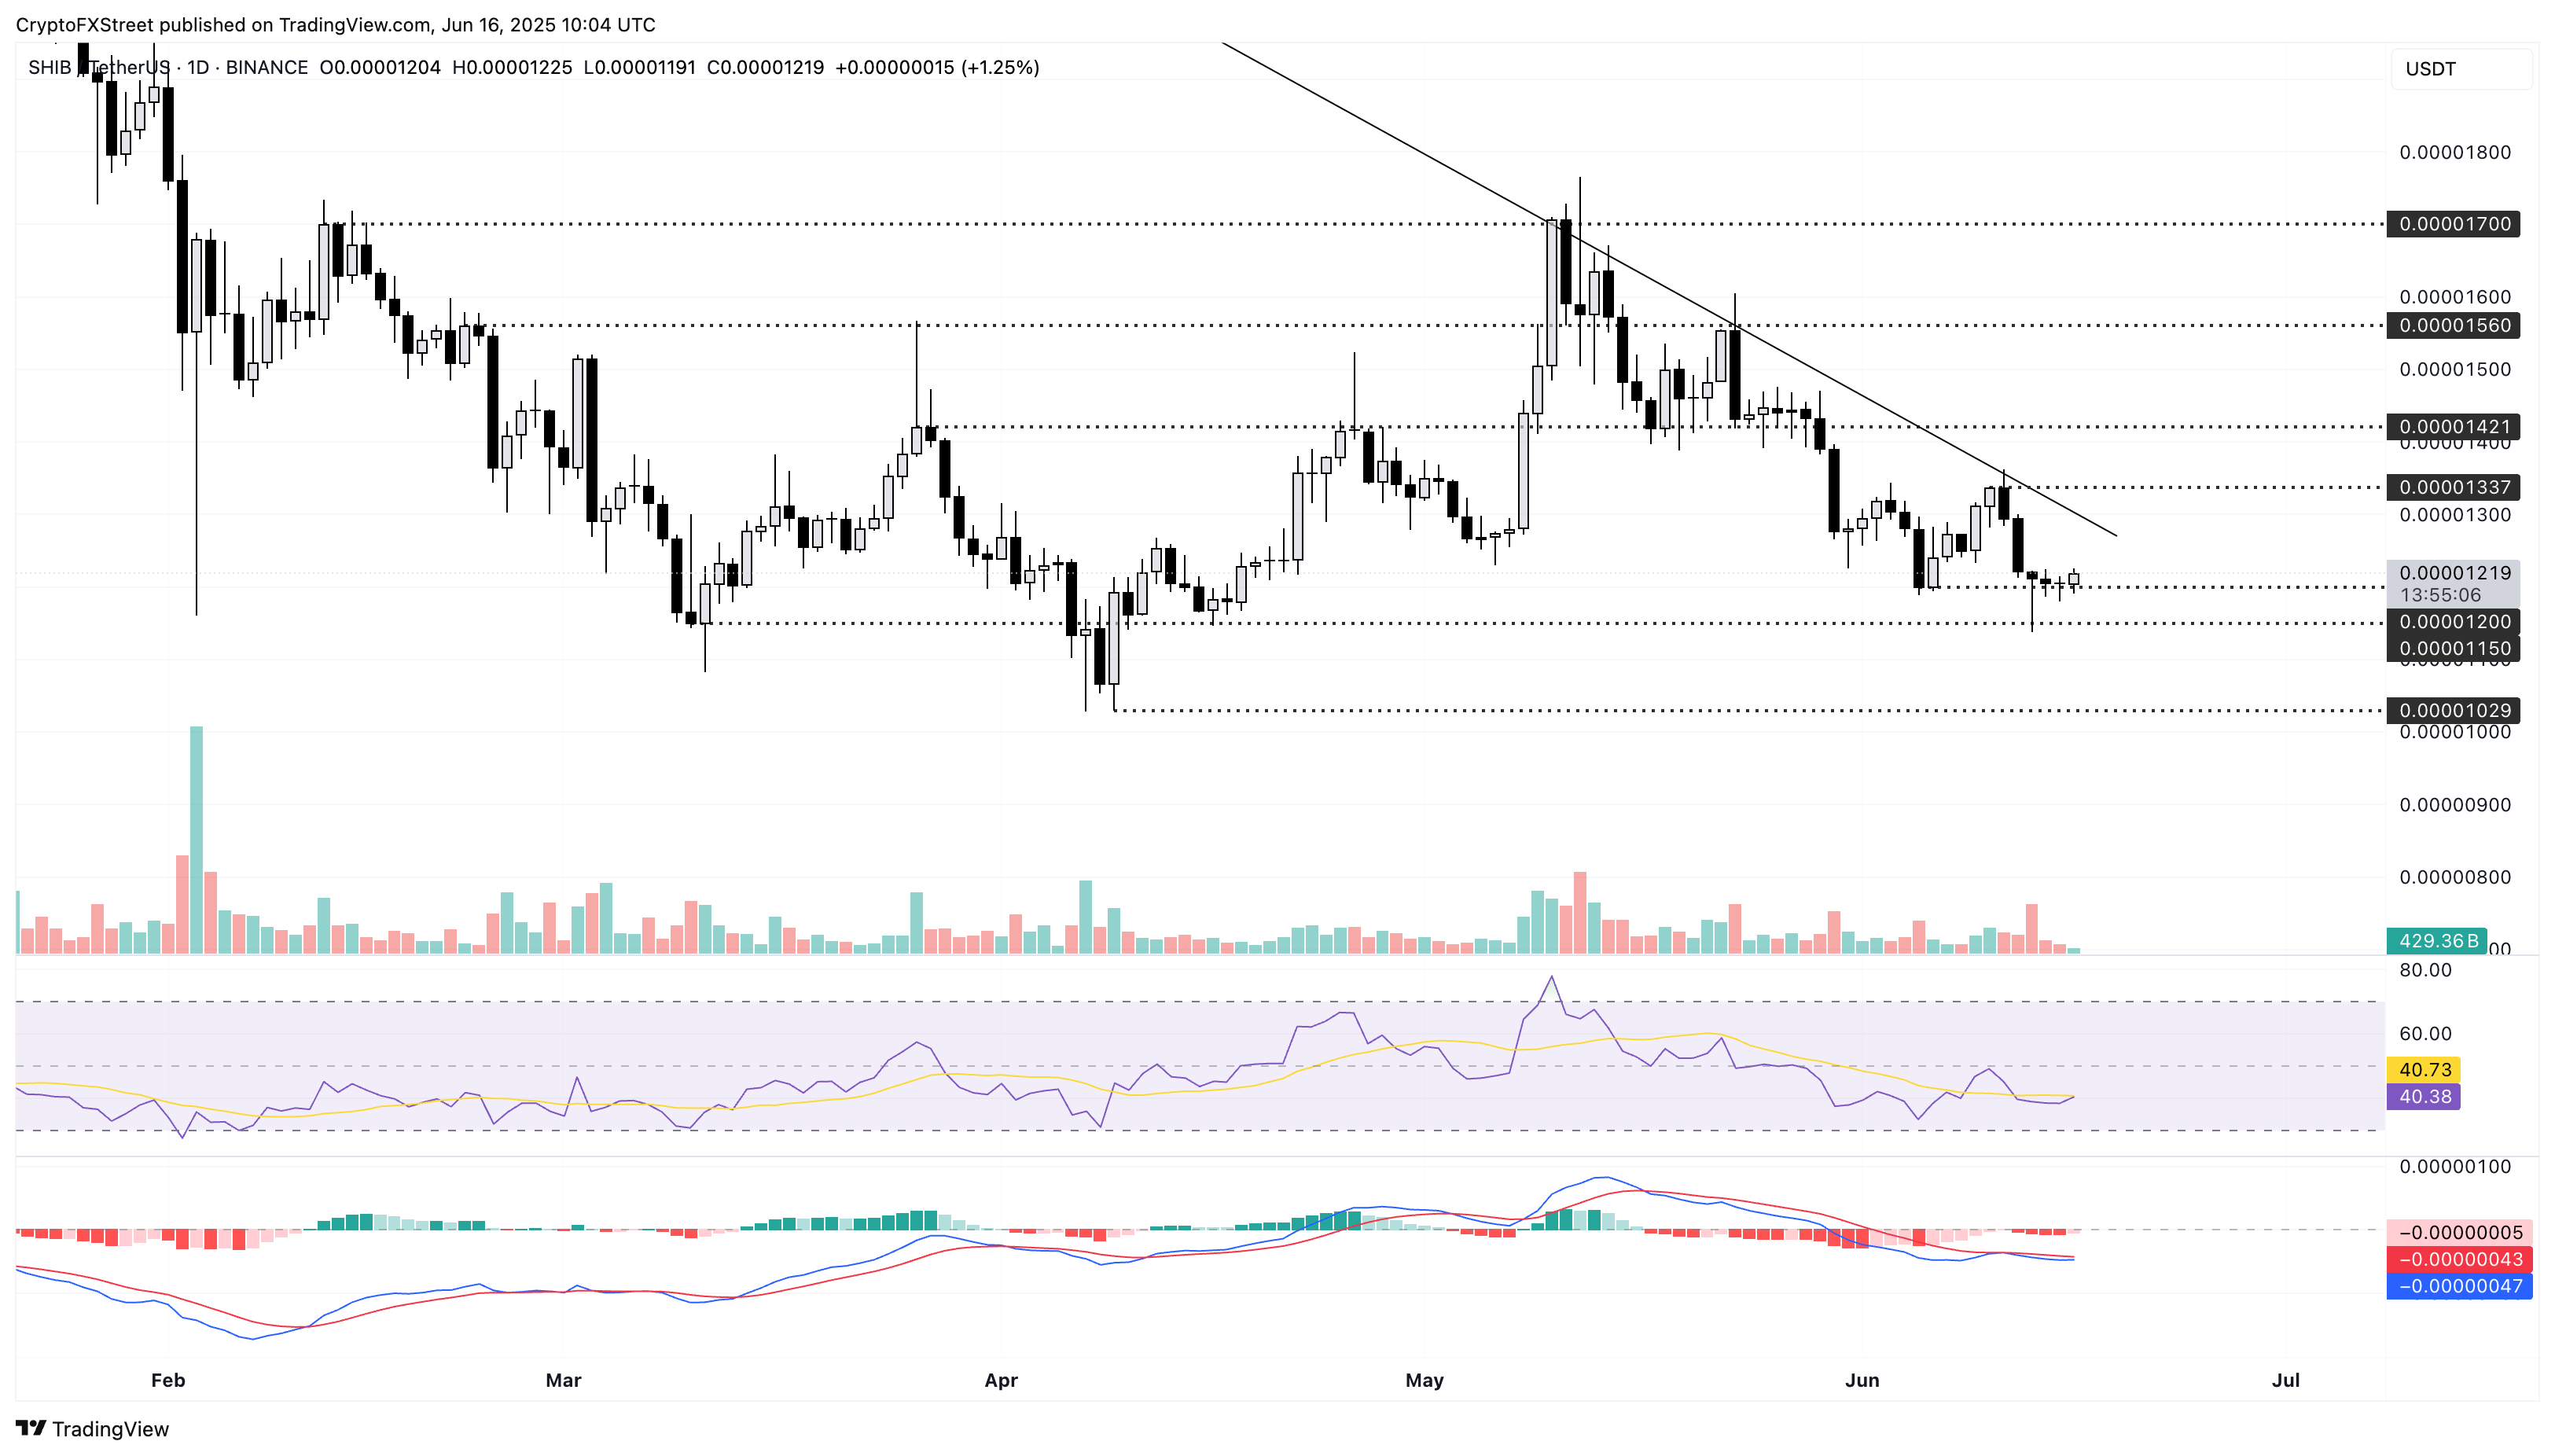
SHIB/USDT daily price chart.
However, a closing below the $0.00001220 support floor will nullify the bullish pattern. In such a case, SHIB could extend the correction to test the $0.00001150 level last tested on April 16.
Pepe recovery crosses key resistance
Pepe’s pullback last week bottomed out before risking a close below the $0.00001000 psychological support level. At the time of writing, PEPE trades at $0.00001139, with a nearly 10% surge from its Friday low of $0.00001044.
The recovery rally has crossed above the $0.00001119 resistance last tested by a reversal on Sunday on the 4-hour chart. With a clean closing price push above this key resistance, Pepe now targets the $0.00001208 resistance marked by a swing low on May 17.
The RSI indicator at 51 crosses above the halfway line, signalling a turn in momentum favouring bulls in the 4-hour chart. As RSI needs to cover space before reaching overbought conditions, the indicator projects room for growth in the PEPE price.
Further up, the Moving Average Convergence/Divergence (MACD) indicator crosses above its signal line, marking a bullish crossover. This aligns with the trend reversal thesis and backs upside chances.
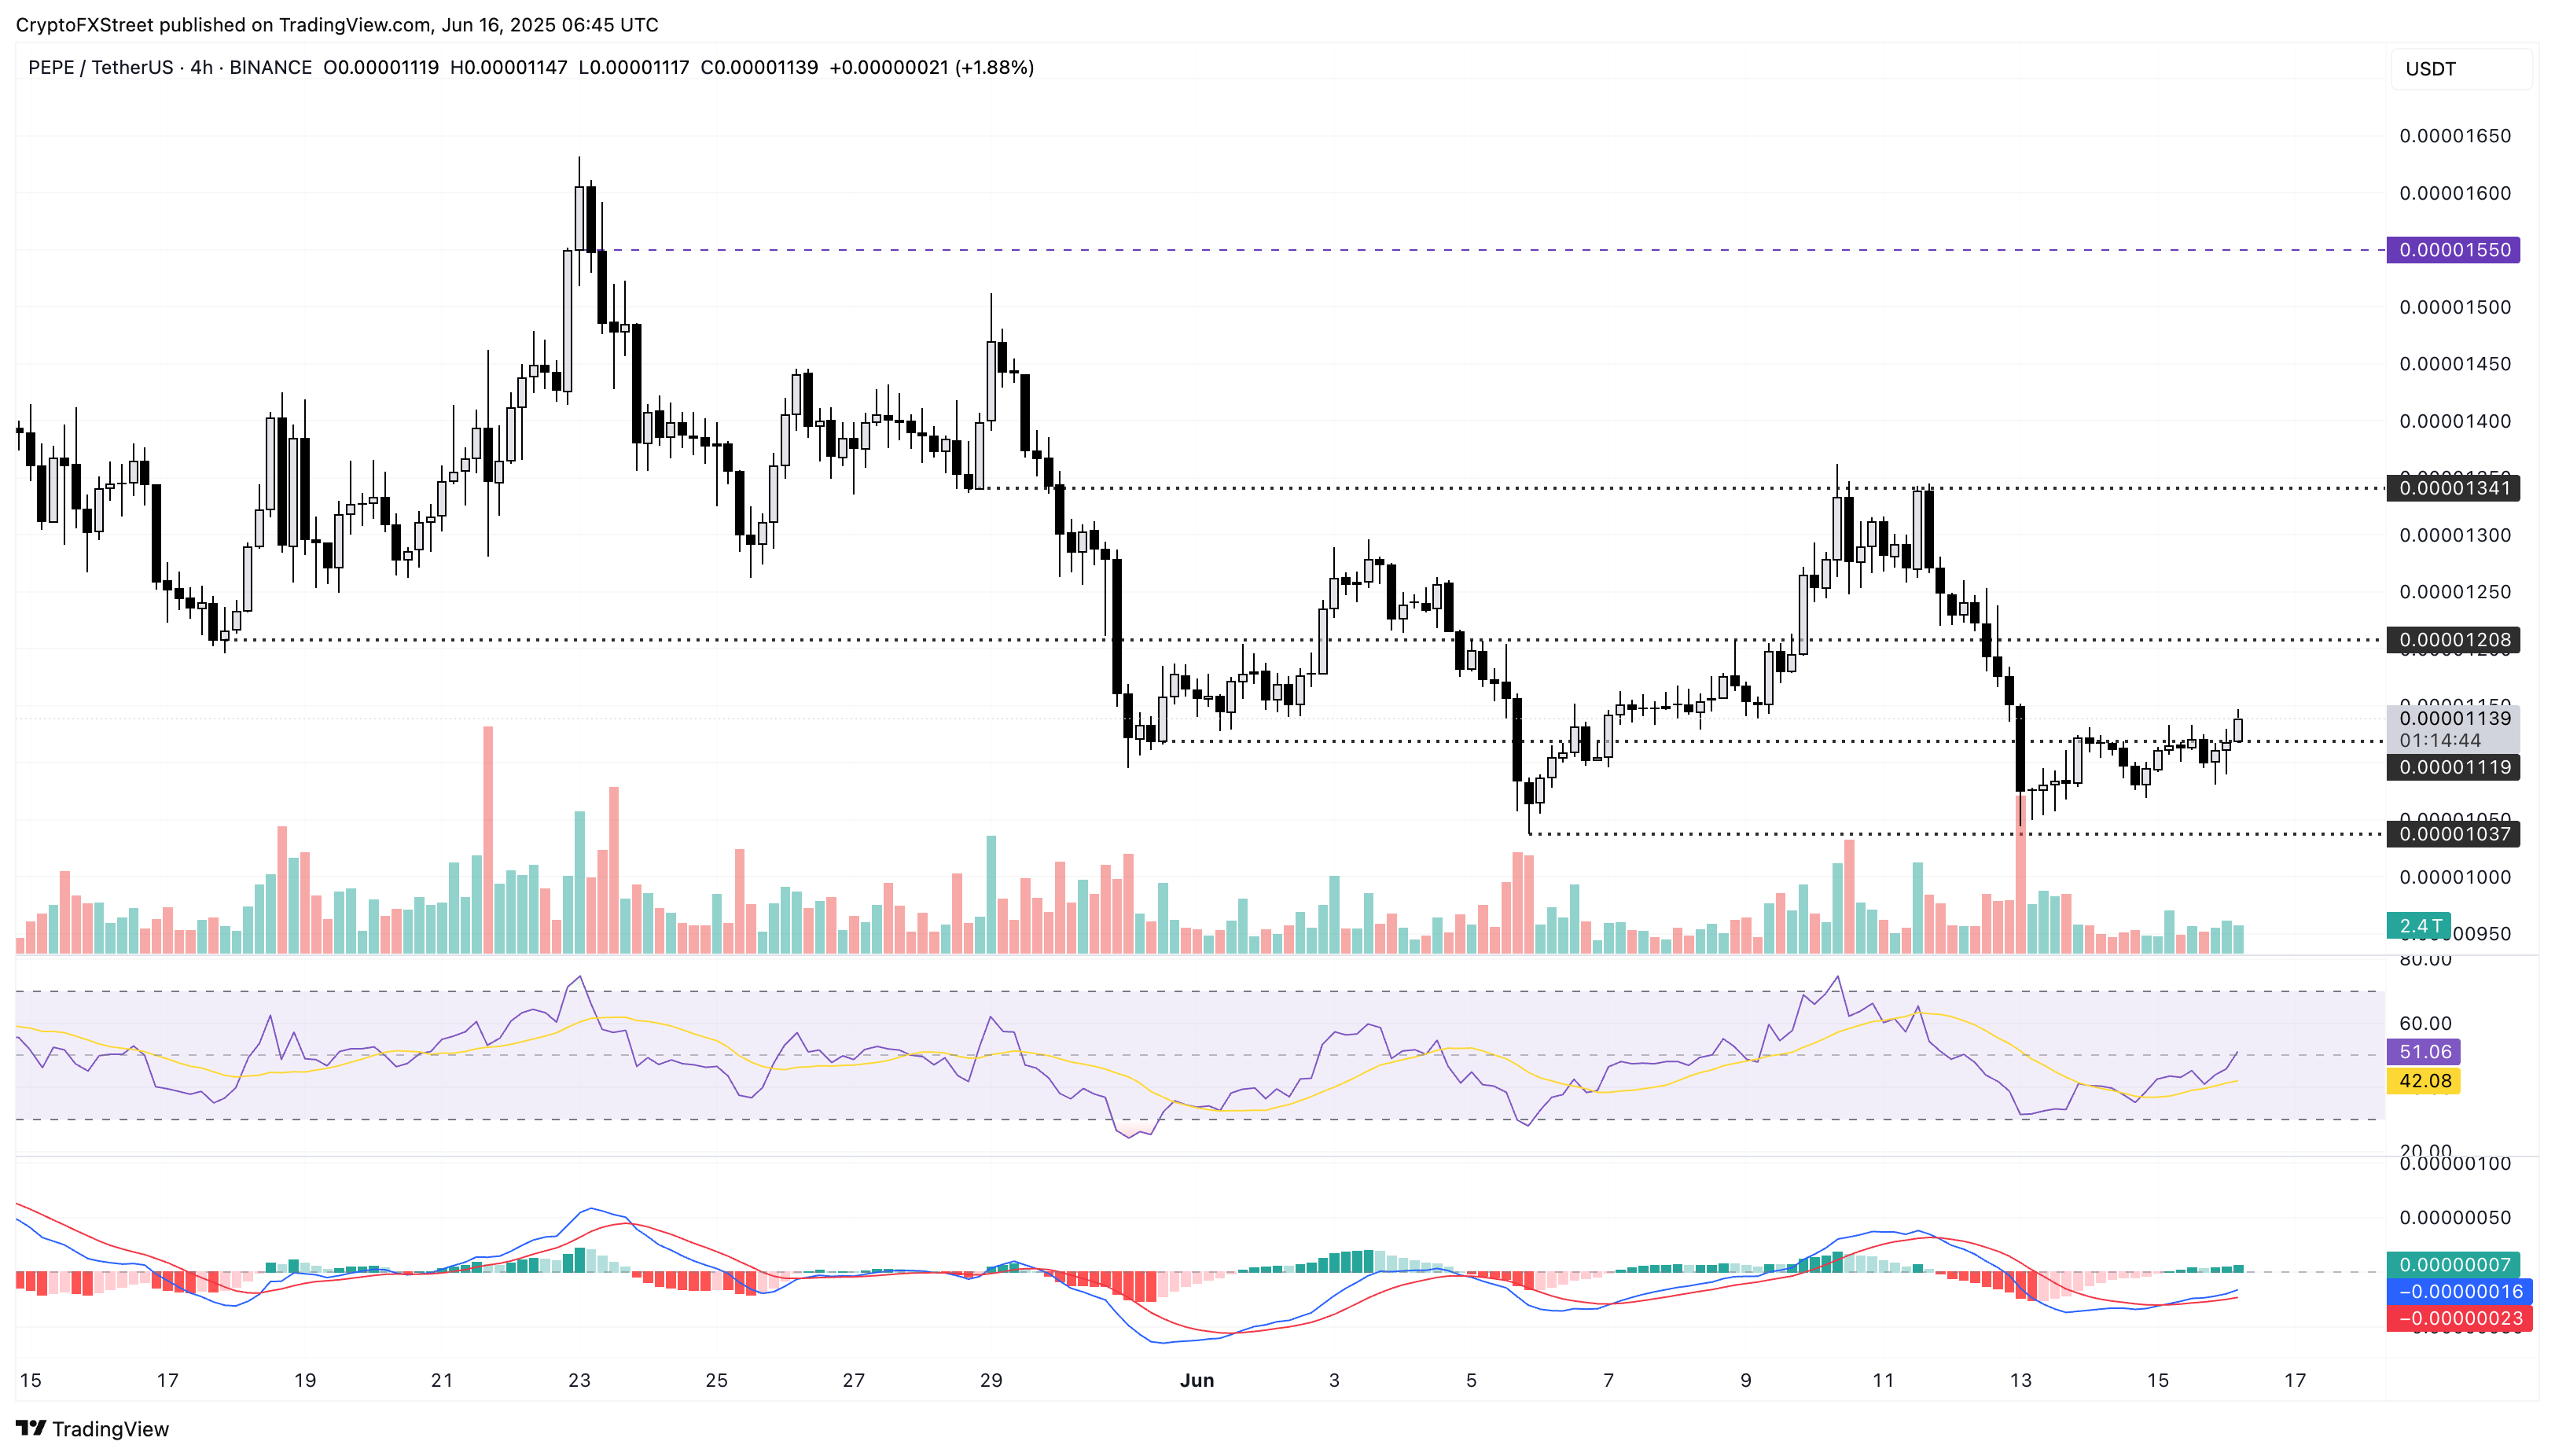
PEPE/USDT 4-hour price chart.
If Pepe fails to hold support at $0.00001119, a steeper correction towards $0.00001000 is possible.
추천 기사


