

Meme Coins Price Prediction: Dogecoin, Shiba Inu, Pepe nosedive amid Middle East tensions
- Dogecoin extends its losses below $0.20 while RSI signals minor recovery chances.
- Shiba Inu's downfall records a new monthly low as selling pressure grows.
- Pepe weakens as its market capitalization falls below $5 billion and the market price drops below the 200-day EMA.
Dogecoin (DOGE), Shiba Inu (SHIB), and Pepe (PEPE) trade in the red as the broader market sell-off gains traction. With the rising supply in the market, the meme coins' market capitalization has dropped nearly 10% in the same period. Amid strong risk-off sentiment in the market, the technical outlook suggests a potential extended crash in DOGE, SHIB, and PEPE.
Dogecoin risks an extended correction phase
Dogecoin, the leader in the meme coin segment, with a market capitalization of $26 billion, is down nearly 9% over the last 24 hours. Despite a recovery earlier this week, DOGE failed to surpass the 50-day Exponential Moving Average at $0.1976, resulting in the ongoing three-day crash accounting for over 15% decline from the $0.2067 high.
At the time of writing, DOGE trades at $0.1738, printing its third consecutive bearish candle with the lowest daily price recorded at $0.1698. If Dogecoin extends its falling trend, it could create a new low for the month by testing the $0.1624 support, marked by the swing low on May 6.
The Moving Average Convergence/Divergence (MACD) indicator prolongs the declining trend after reversing from its signal line. A new wave of bearish histograms below the zero line signals an extension in the downtrend.
The Relative Strength Index (RSI) at 37 reflects a sudden plunge in bullish momentum. Notably, the RSI suggests a potential higher low formation if DOGE reverses to form a double bottom pattern, resulting in a bullish divergence.
However, a potential closing below $0.1642 could nullify the RSI divergence-fueled reversal in Dogecoin. In such a case, sellers could witness the meme coin retesting the $0.1422 mark, as marked on April 8.
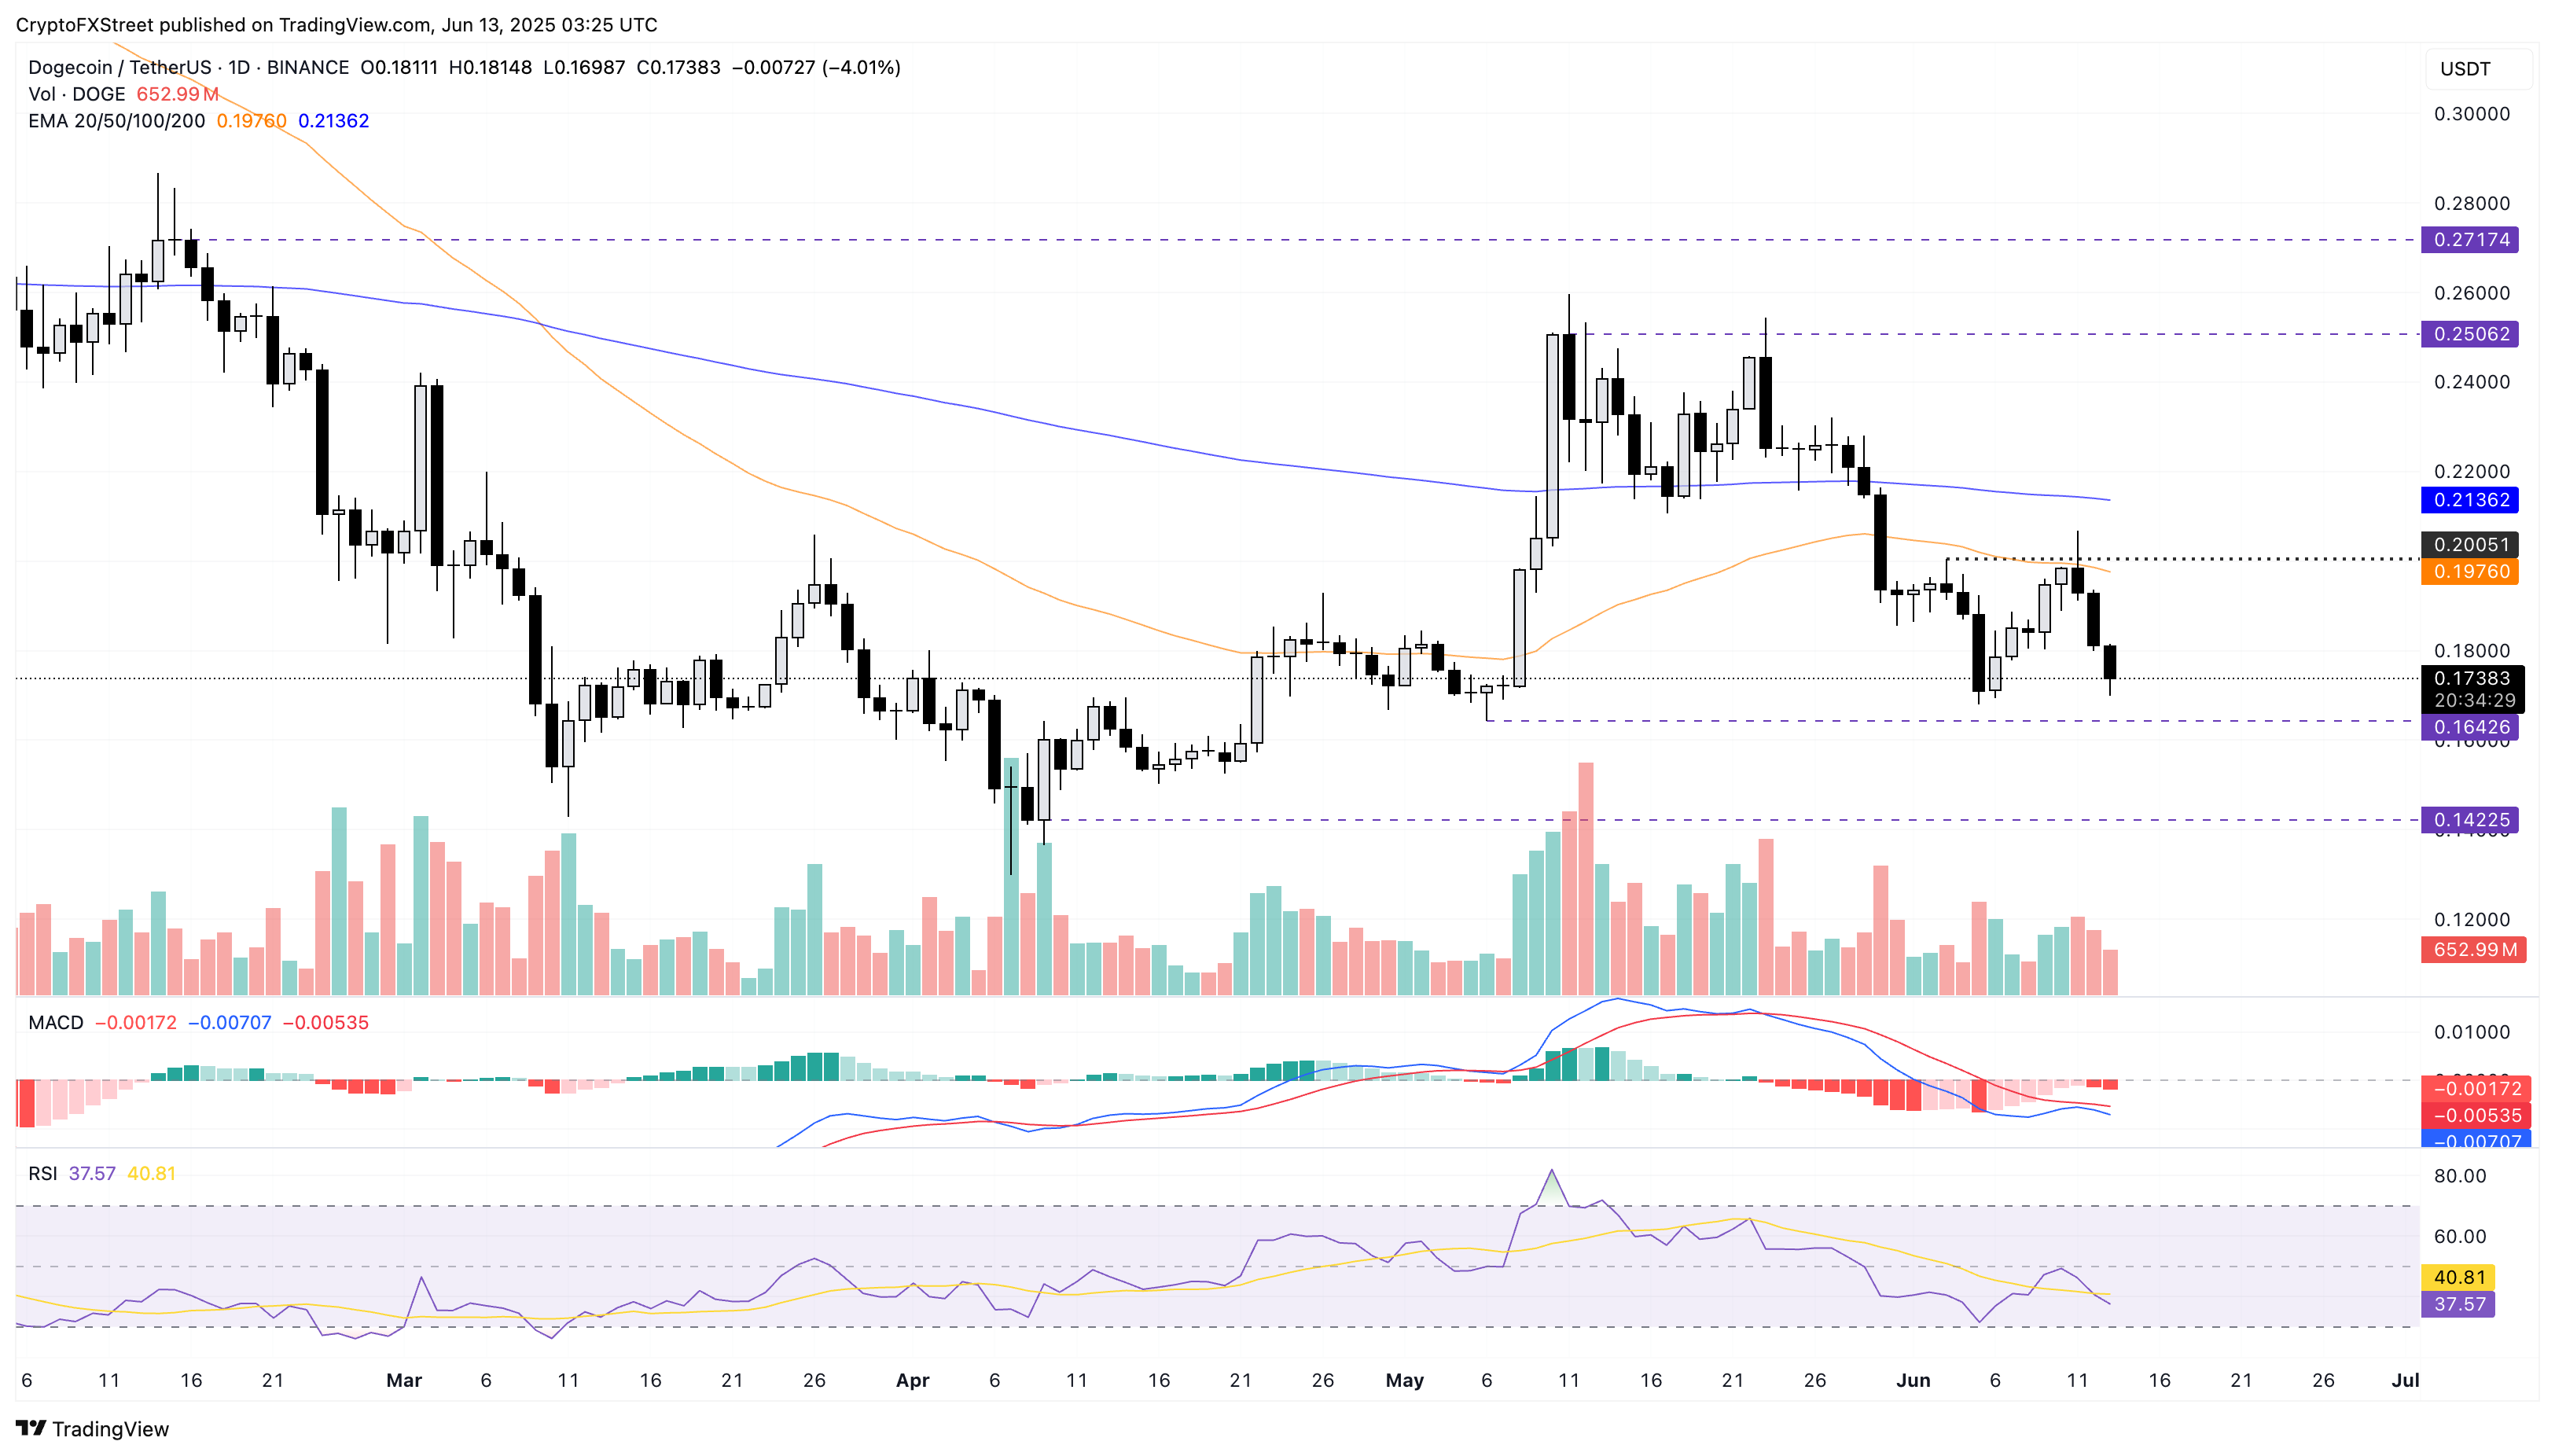
DOGE/USDT daily price chart.
Conversely, Dogecoin flipping from $0.1642 might retest the 50-day EMA at $0.1976.
Shiba Inu is in a steep declining trend
Shiba Inu extends the bearish reversal after facing rejection on Wednesday from a key long-standing resistance trendline marked by peaks on December 8, May 10, and May 22. At the time of writing, SHIB is down 4% in the day, marking a new 30-day low at $0.00001138.
The momentum indicator mimics the segment leader, with the MACD indicator extending a declining trend as it reverses from its signal line. The indicator signals a sell call as a bearish histogram rises below the zero line.
Further up, the RSI indicator plunges from the halfway line, suggesting a surge in bearish momentum.
A daily close below the $0.00001150, a support last tested on April 16, could prolong the downfall to the $0.00001029 level, the year-to-date lowest trading price.
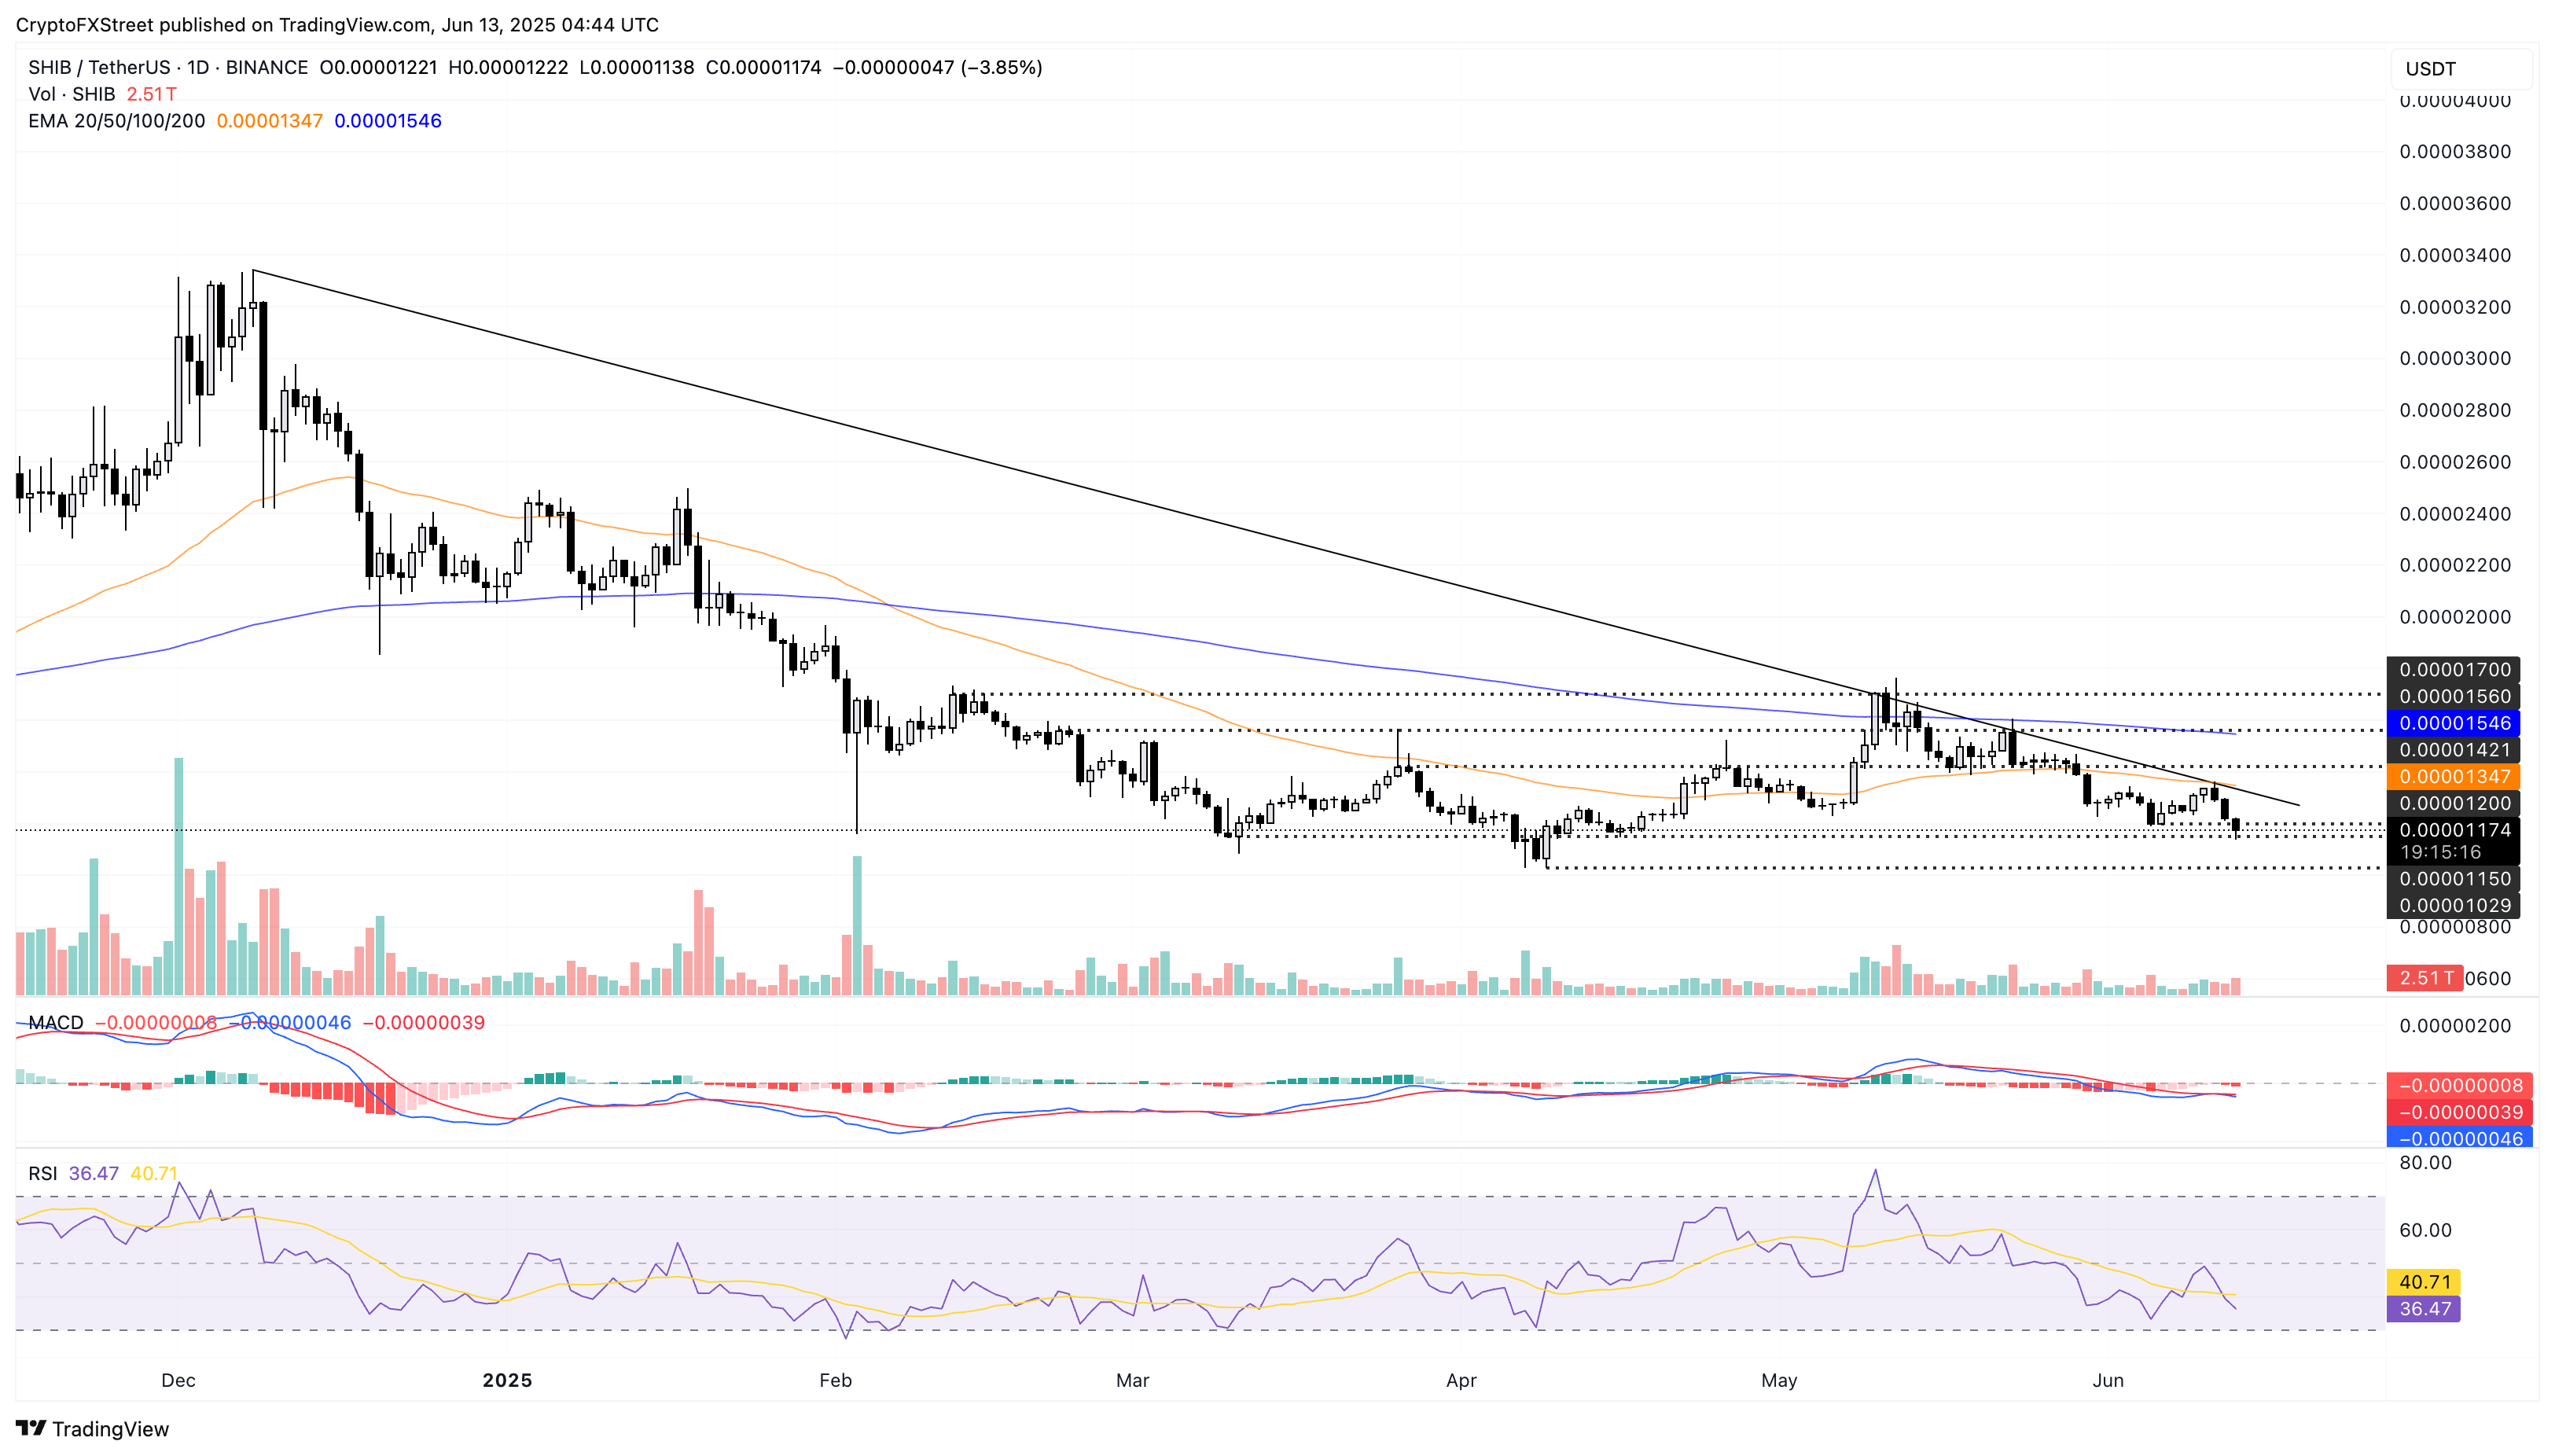
SHIB/USDT daily price chart.
However, a potential reversal must surpass the 50-day EMA at $0.00001347, moving near the resistance trendline to reinstate a bullish trend.
Pepe risks breakdown of a key psychological support
Pepe is down over 20% from the weekly high at $0.00001362 in three consecutive days of weakness. The downfall breaches the 200-day EMA and risks a breakdown of the $0.00001037 level, the lowest trading price in June.
A potential closing below the $0.00001037 could violate the psychological level at $0.00001000, suggesting a possible drop to the $0.00000900 support zone, last tested on April 26.
The MACD indicator steps below the zero line from which new bearish histograms arise, suggesting that declining trend momentum is on the rise. Further up, the RSI indicator at 41 nosedives towards the oversold zone, aligning with the bearish outlook.
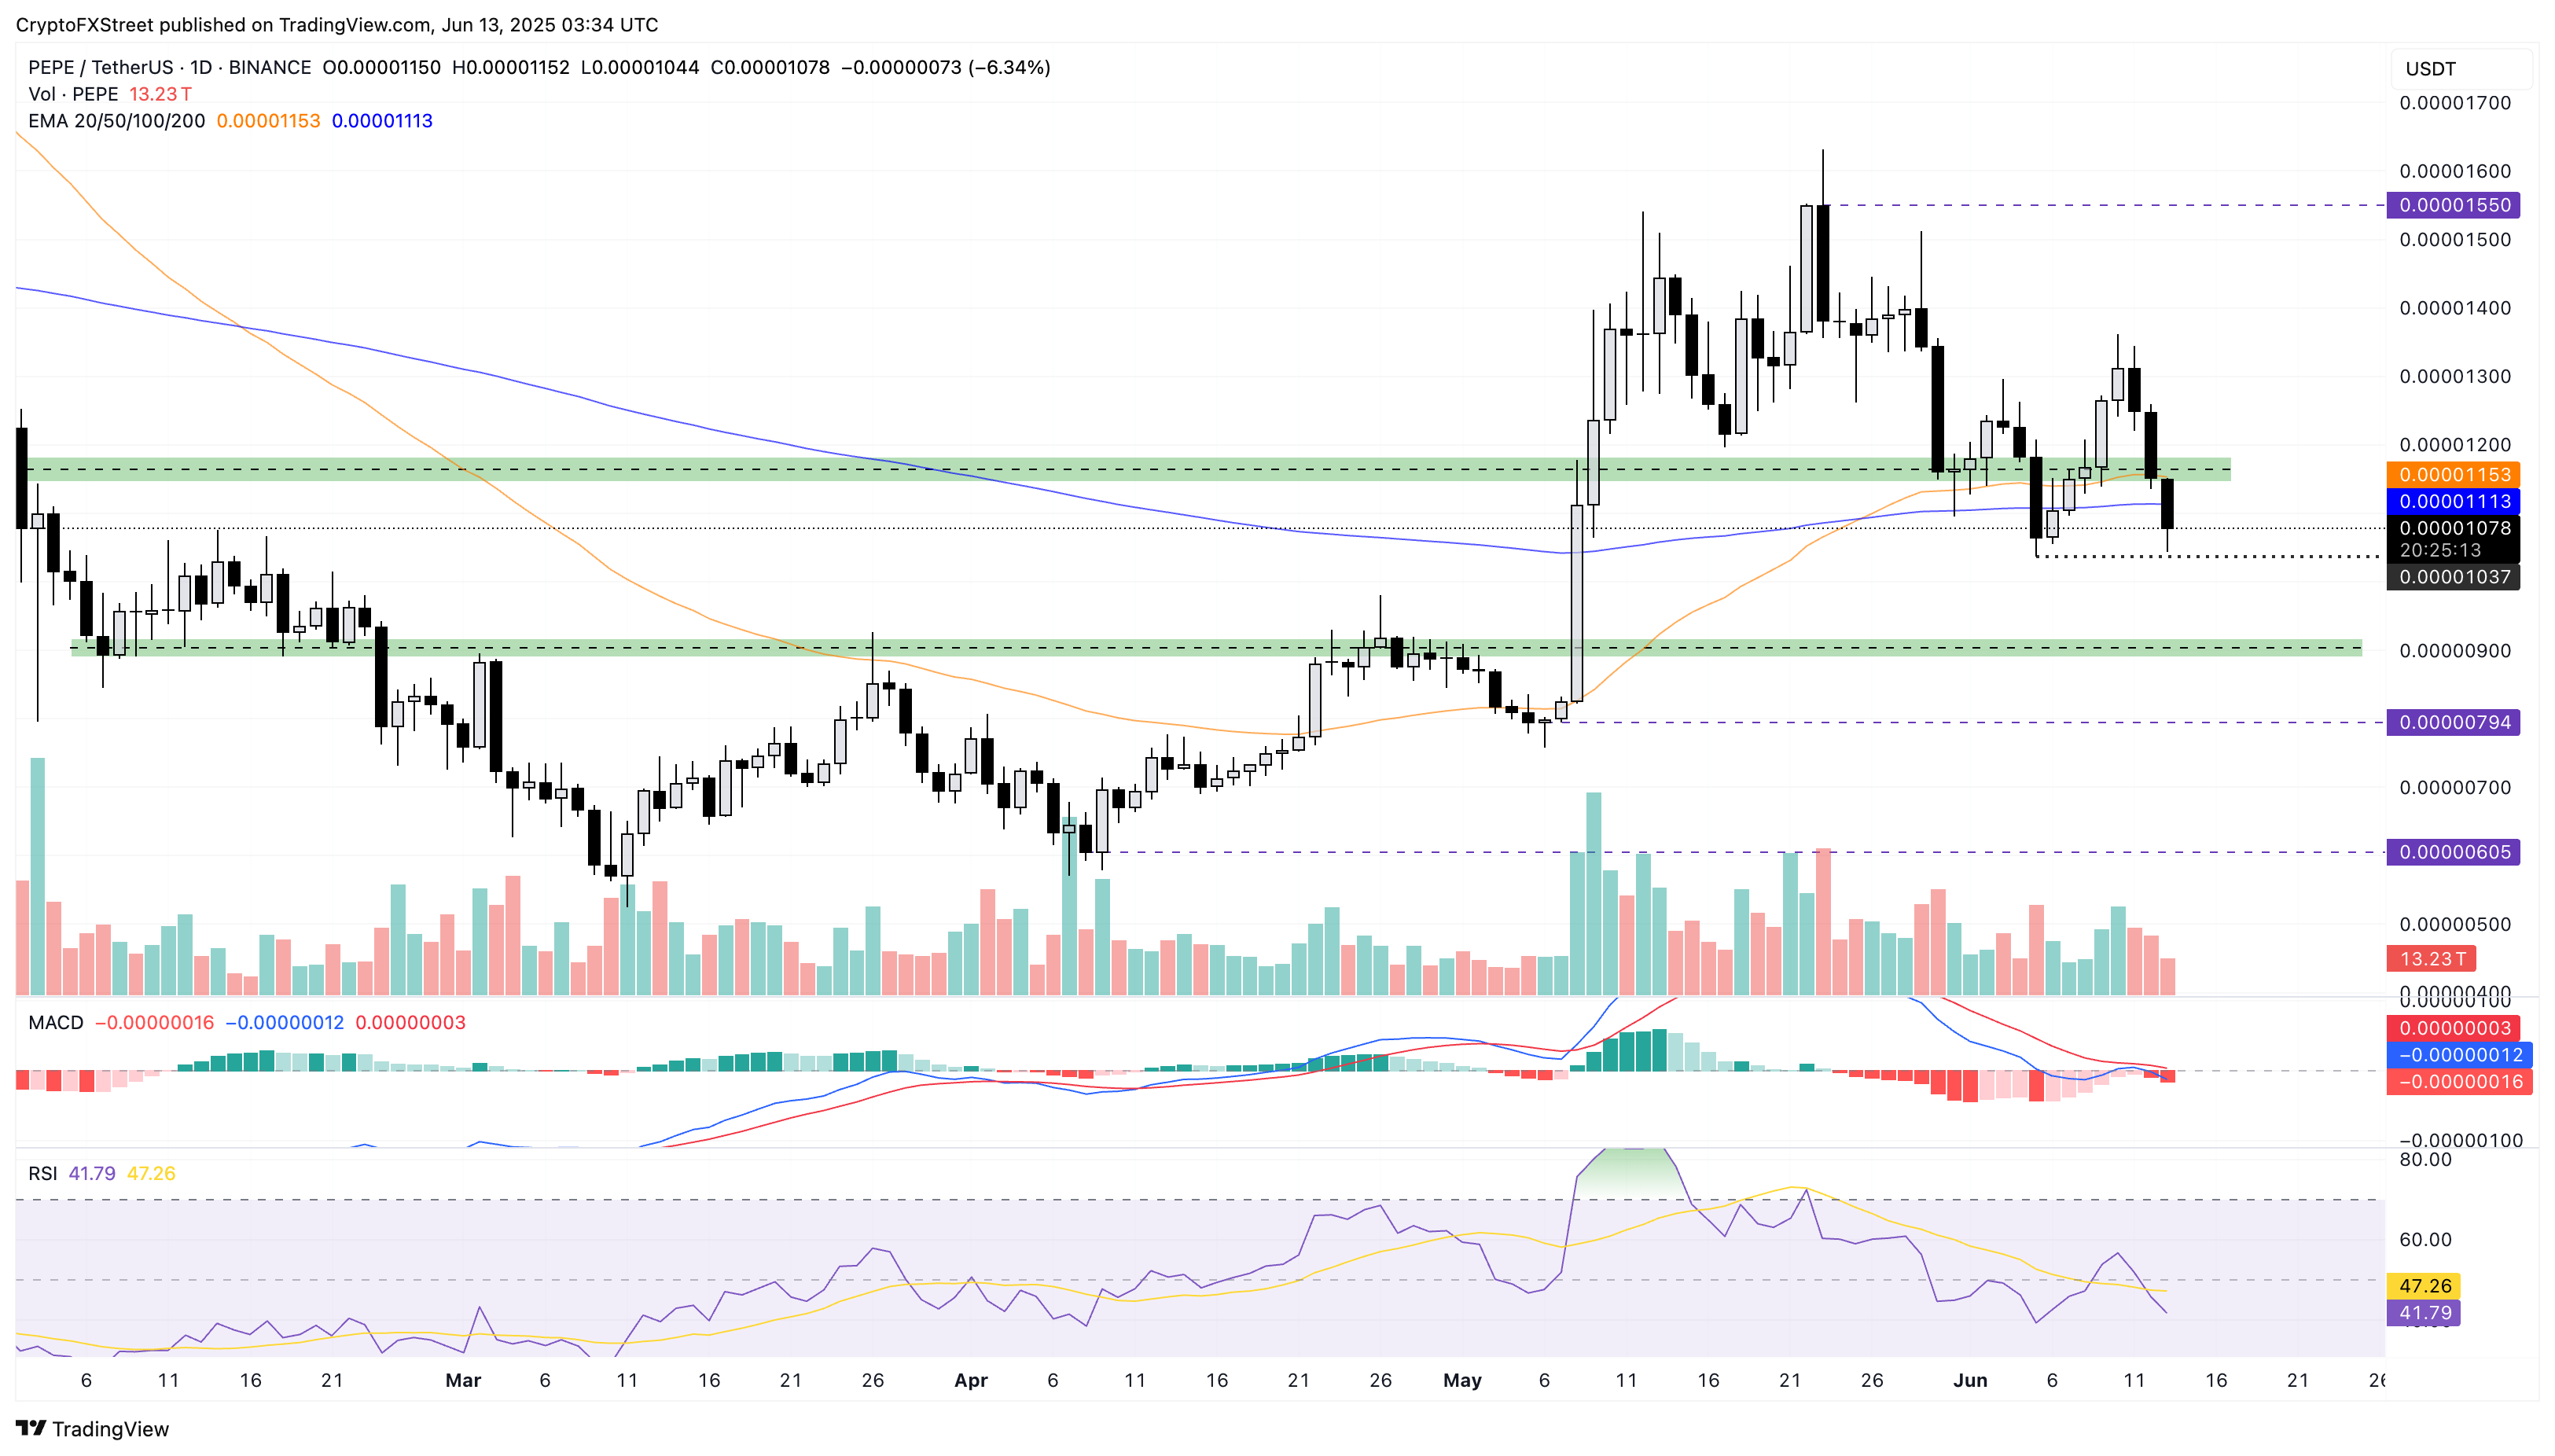
PEPE/USDT daily price chart.
However, a potential bullish reversal from the $0.00001000 could test the 50-day EMA at $0.00001153.
추천 기사


