

AI Tokens to Watch: VIRTUAL, GRASS surge ahead of the weekend
- Investors turn their attention to lesser-known digital assets as AI tokens post double-digit gains.
- Virtuals Protocol extends its rebound, eyeing a breakout above $2.00 while decoupling from the broader crypto sell-off.
- GRASS explodes nearly 15%, reinforced by multiple buy signals and potential support above $2.00.
The cryptocurrency market is struggling to hold onto gains accrued in May as weak sentiment triggers frequent but brief flash sell-offs. However, isolated rallies can be spotted in the artificial intelligence (AI) sector, led by Virtuals Protocol (VITUAL) and Grass (GRASS) tokens. These tokens are aggressively extending gains on Friday, hinting at a potential bullish outlook during the weekend.
Market outlook: AI tokens surge, defying negative sentiment
The fallout between United States (US) President Donald Trump and Tesla CEO Elon Musk has led to a public spat, sending shockwaves through global markets, including the cryptocurrency sector.
Bitcoin dropped to near $100,000 on Thursday, triggering a cascade of losses in the broader cryptocurrency market. The sharp downturn resulted in a decline in total market capitalization to $3.28 trillion from $3.41 trillion on Thursday.
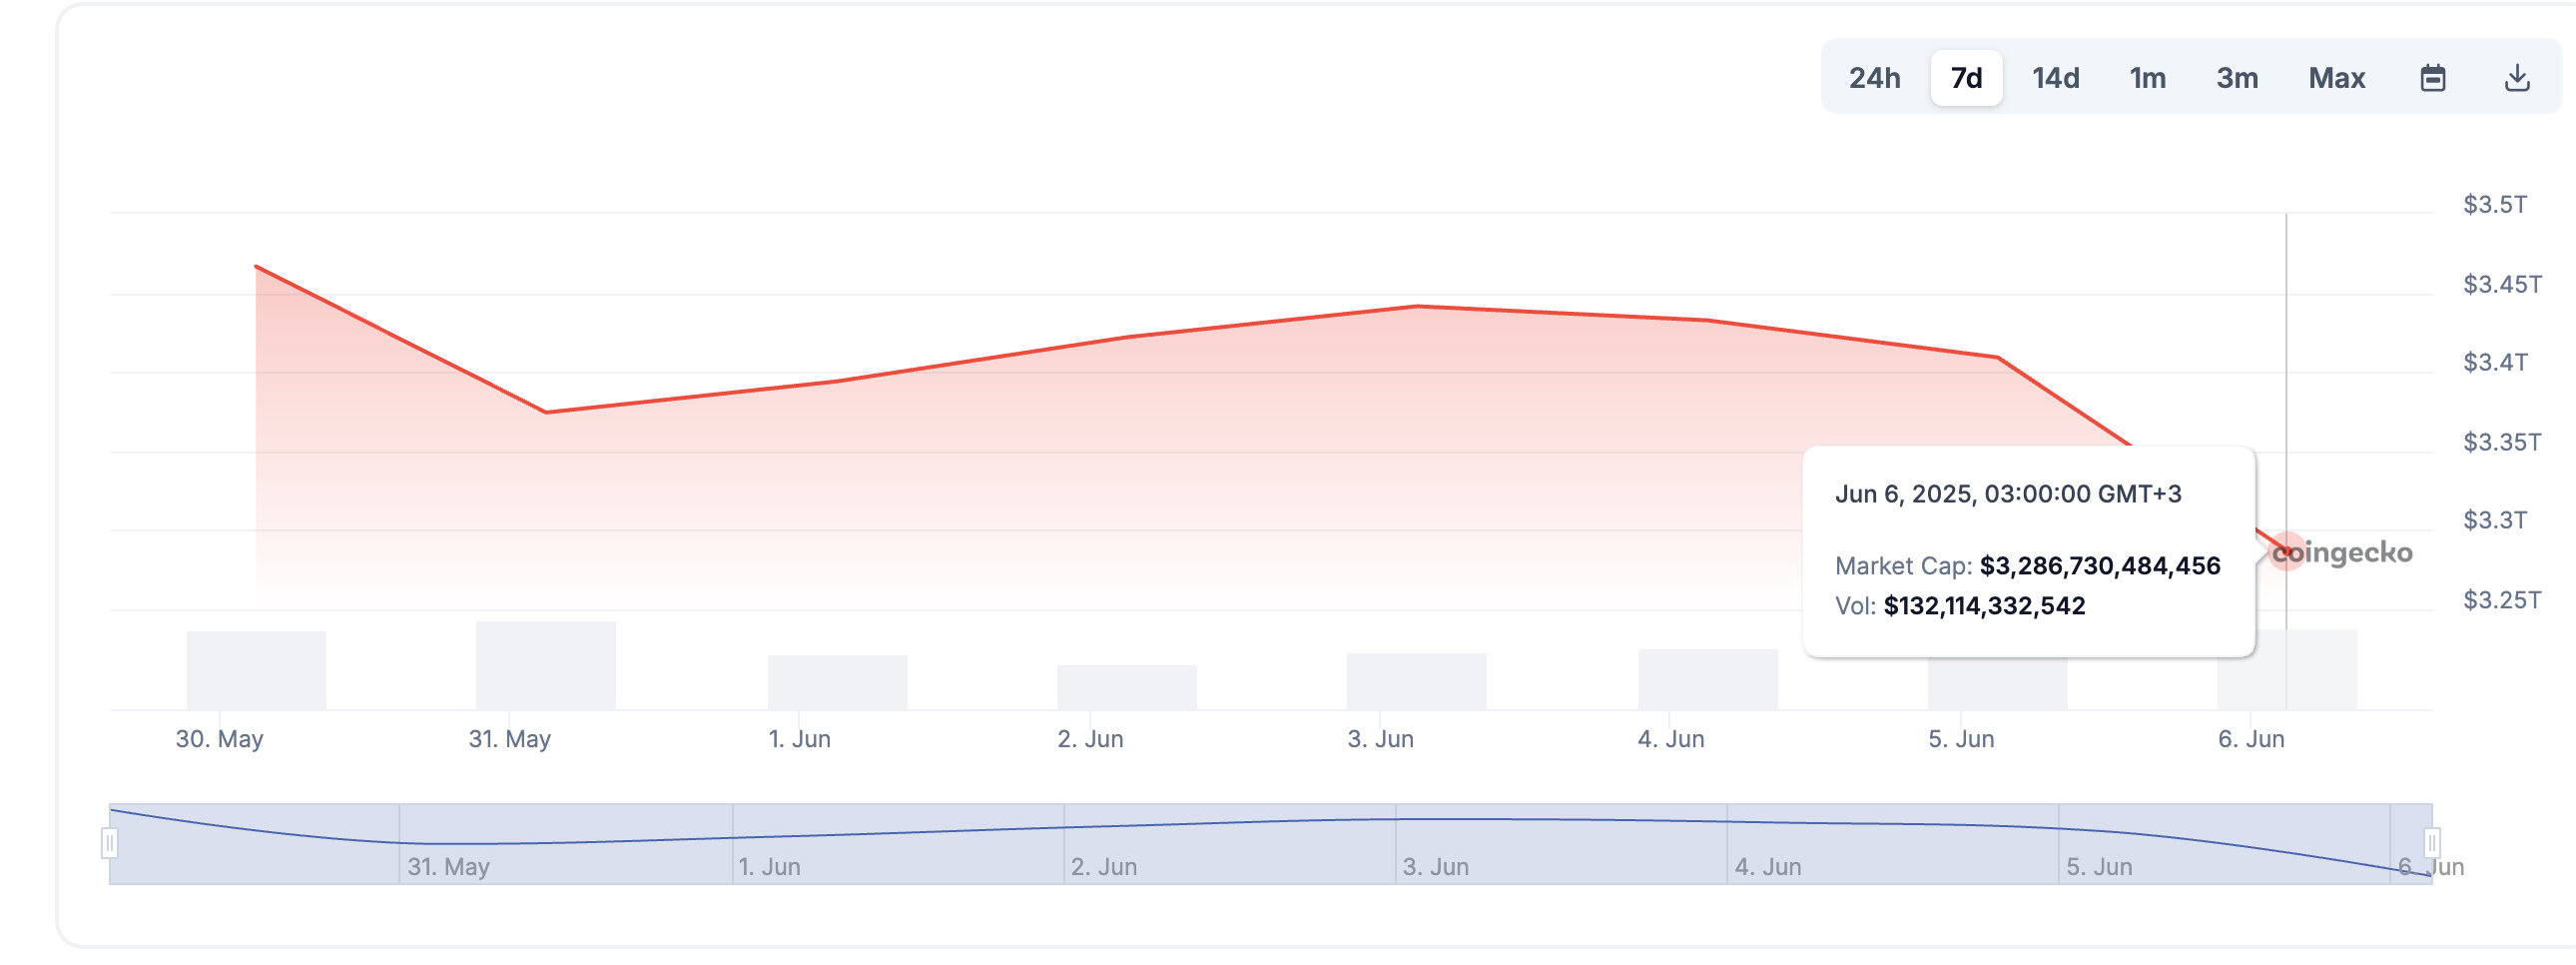
Cryptocurrency market | Source: CoinGecko
Aside from the disagreement between President Trump and Musk, recession fears in the US have resurfaced. Experts such as Mike Wilson, Morgan Stanley's chief US equity strategist and CIO, have warned that a mild recession could occur in the second half of the year. This would be mainly driven by an April-like tariff-triggered crash in the stock market.
The employment data released by the Bureau of Labor Statistics (BLS) on Friday indicated that the labor market continues to improve slowly, remaining close to historical lows.
With the Federal Reserve (Fed) meeting scheduled for later this month, expectations lean toward no interest rate cut in the short term, which could keep markets subdued longer than expected.
This dismal outlook may be driving investors toward lesser-known tokens, such as Virtuals Protocol and Grass, which promise higher growth margins amid heightened volatility.
Virtuals Protocol eyes break past $2.00
Virtuals Protocol's price edges higher, more than 12% on Friday, while trading at around $1.85 at the time of writing. The AI token, valued at $1.2 billion, holds above short-term support provided by the 4-hour, 200-period Exponential Moving Average (EMA) at $1.60.
The descending trendline resistance, now turned into support, reinforces the bullish grip on the token.
A buy signal from the Moving Average Convergence Divergence (MACD) indicator suggests that the technical structure has a strong bullish bias. This signal occurred when the blue MACD line crossed above the red signal line during the European session on Friday, encouraging traders to seek exposure to VIRTUAL.
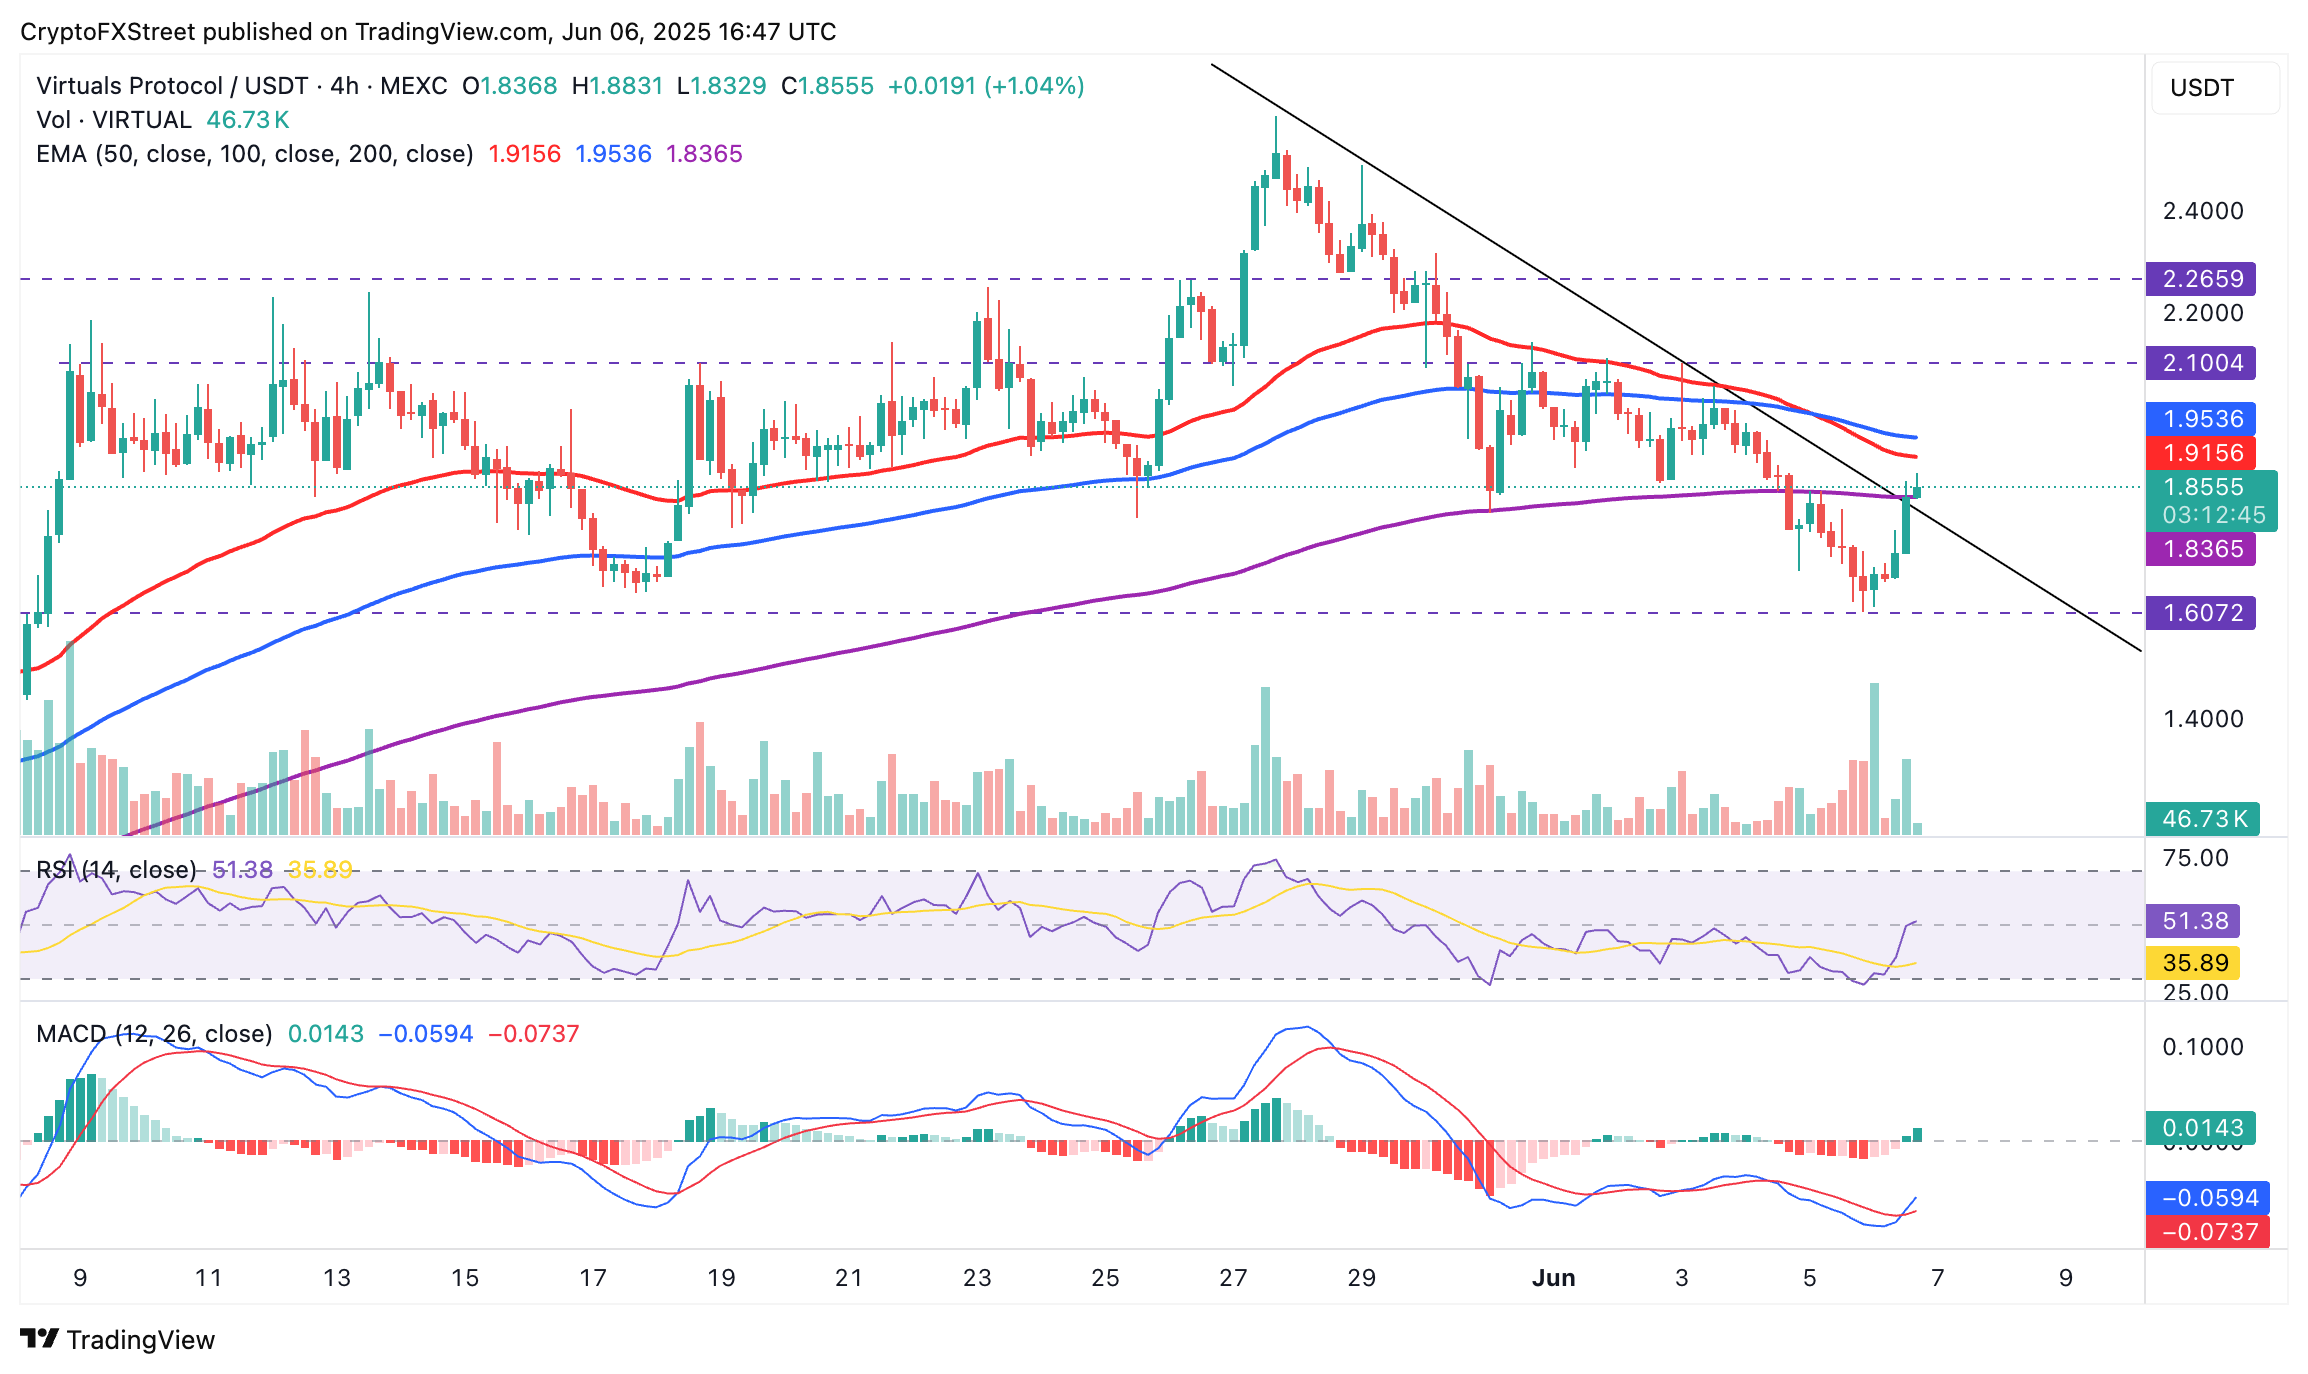
VIRTUAL/USDT 4-hour chart
Traders should consider the possibility of a reversal, especially of short-term support at the 200-period EMA breaks. Profit-taking and potential resistance at the 50-period EMA around $1.91 and the 100-period EMA at approximately $1.95 could delay the breakout beyond $2.00 or even lead to consolidation.
Grass gains momentum backed by key technical buy signals
Grass, a decentralized network-sharing application that allows users to sell their unused bandwidth, posted double-digit gains of nearly 15% on Friday. The token hovers at around $2.03, above key moving averages, including the 100-period EMA at $1.95 and the confluence support established by the 50-period EMA and the 200-period EMA at $1.92.
Multiple buy signals reinforce the bullish influence on the token, including the blue MACD line crossing above the signal line on the 4-hour chart. The MACD indicator climbs above the zero line (0.00), and the green histogram bars extend above it, indicating a continuation of the uptrend.
The second buy signal from the SuperTrend indicator, sent on Wednesday, indicates that bulls have the upper hand. This trend-following tool utilizes the readings of the Average True Range (ATR) to gauge market volatility.
Traders can use the tool as a dynamic support and resistance indicator, with the buy signal flashing every time the price crosses above the SuperTrend line, changing color from red to green.
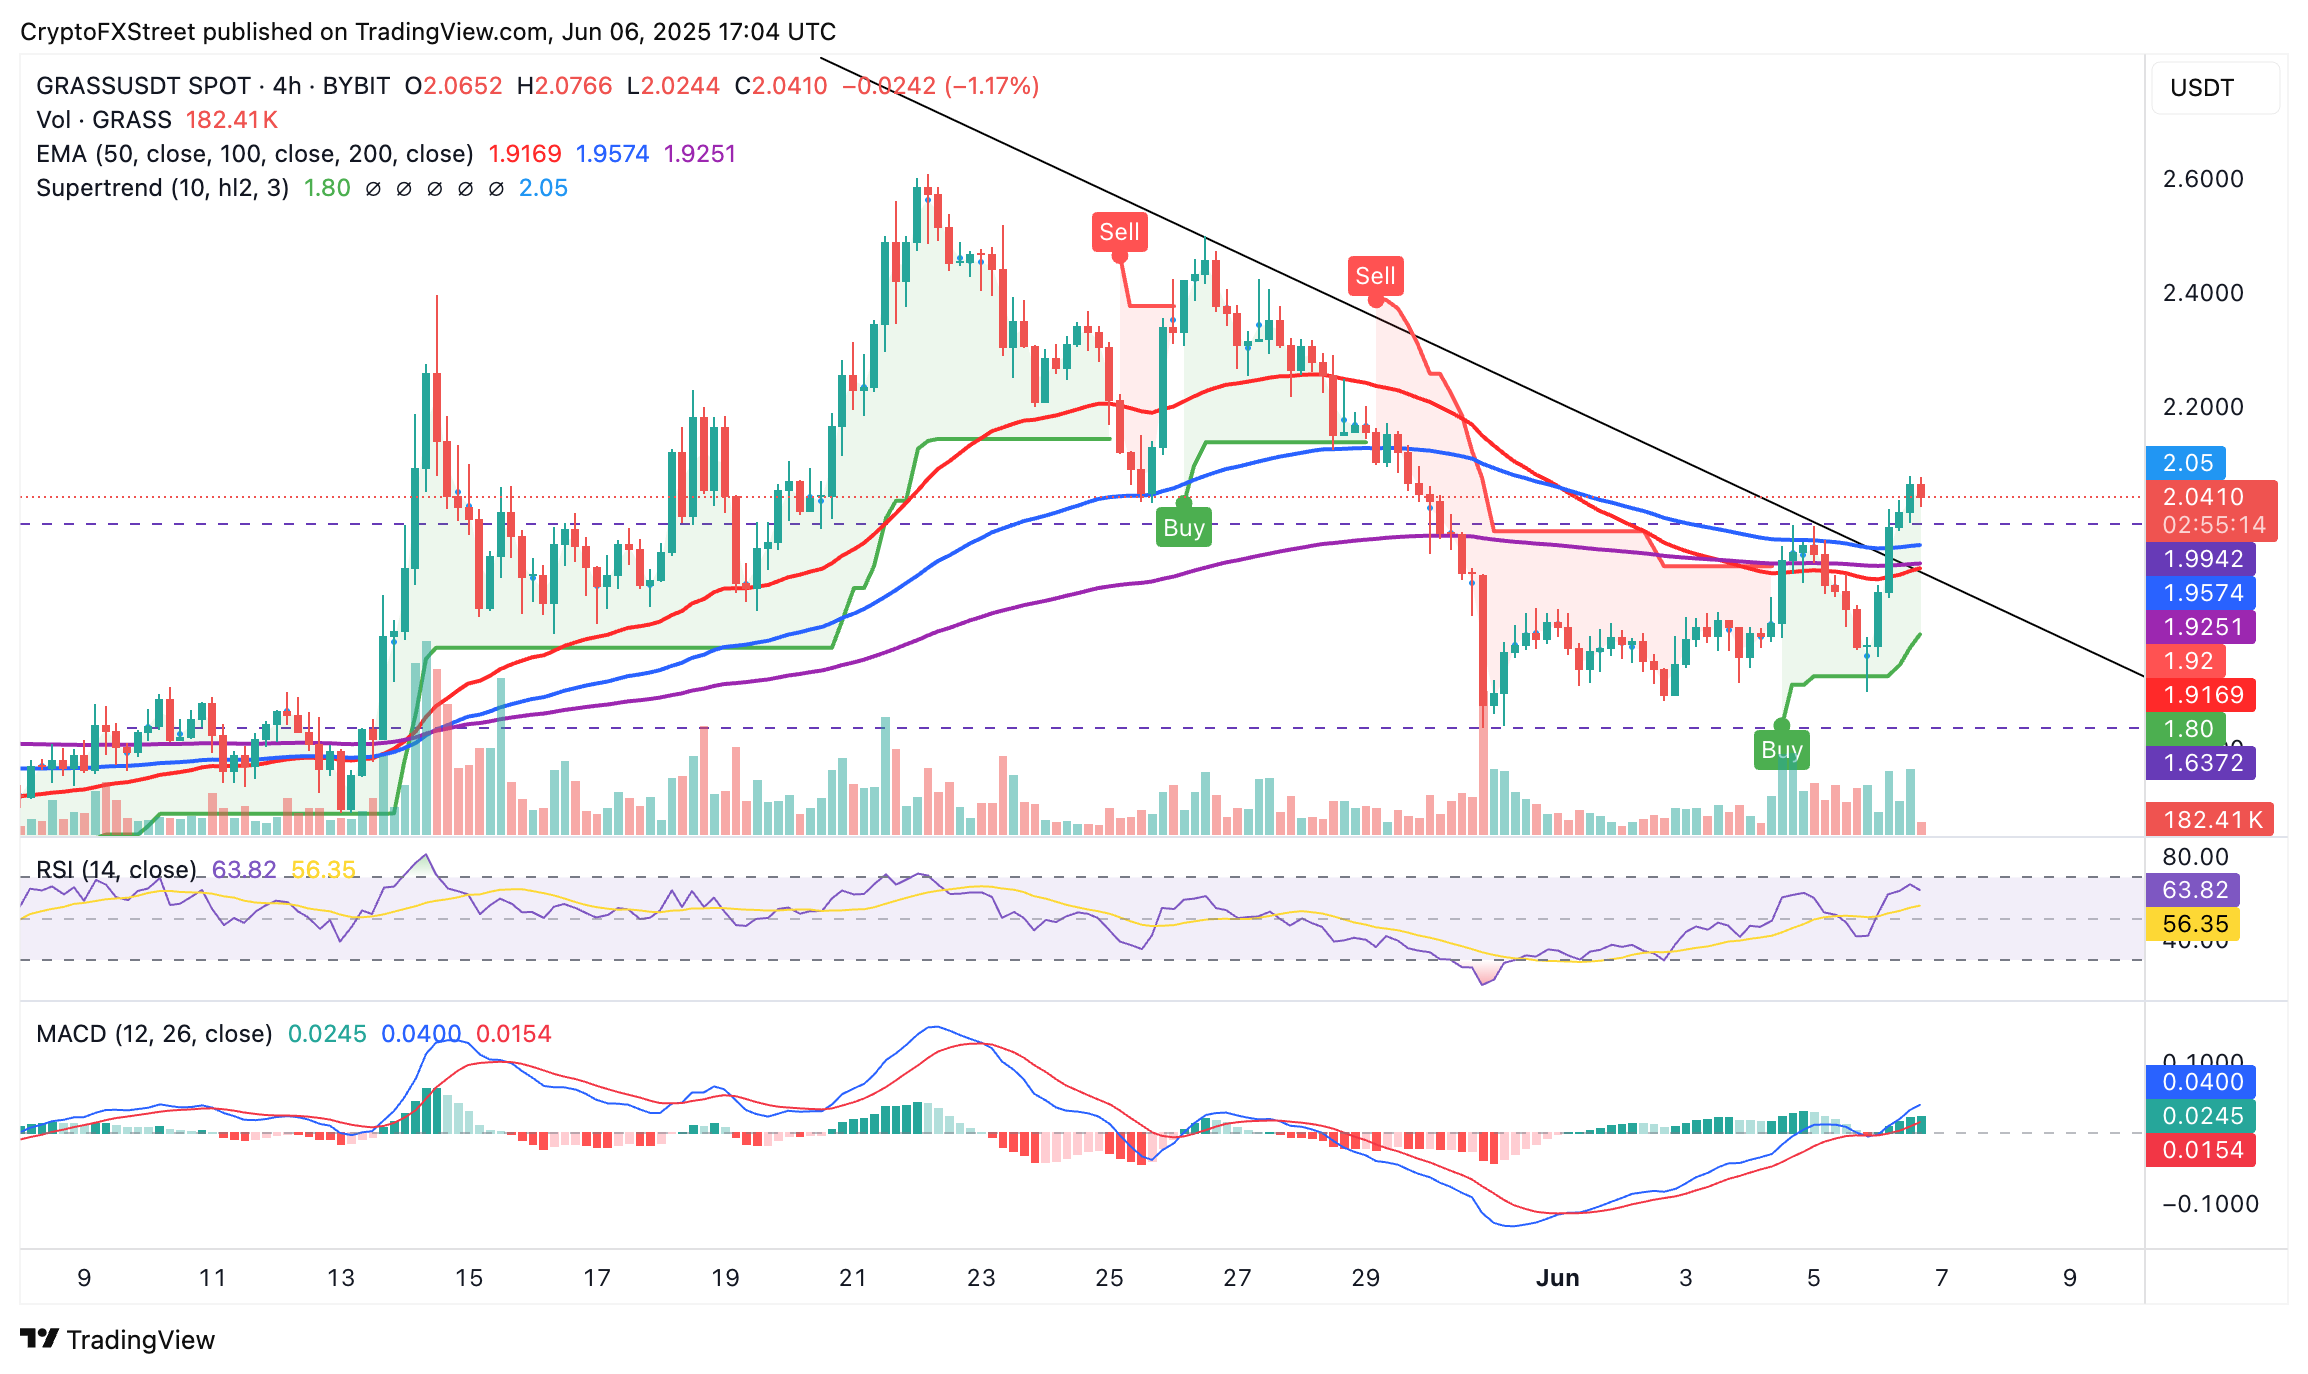
GRASS/USDT 4-hour chart
Still, the Relative Strength Index (RSI) shows signs of weakness at 63 after falling short of the overbought region.
A reversal toward the 50 midline implies a lack of conviction in the uptrend, possibly due to potential profit-taking and changing market dynamics. Therefore, the potential loss of support at $2.00 could prompt traders to adjust to key support levels, including the 50-period EMA and the confluence support at $1.92.
Cryptocurrency prices FAQs
Token launches influence demand and adoption among market participants. Listings on crypto exchanges deepen the liquidity for an asset and add new participants to an asset’s network. This is typically bullish for a digital asset.
A hack is an event in which an attacker captures a large volume of the asset from a DeFi bridge or hot wallet of an exchange or any other crypto platform via exploits, bugs or other methods. The exploiter then transfers these tokens out of the exchange platforms to ultimately sell or swap the assets for other cryptocurrencies or stablecoins. Such events often involve an en masse panic triggering a sell-off in the affected assets.
Macroeconomic events like the US Federal Reserve’s decision on interest rates influence crypto assets mainly through the direct impact they have on the US Dollar. An increase in interest rate typically negatively influences Bitcoin and altcoin prices, and vice versa. If the US Dollar index declines, risk assets and associated leverage for trading gets cheaper, in turn driving crypto prices higher.
Halvings are typically considered bullish events as they slash the block reward in half for miners, constricting the supply of the asset. At consistent demand if the supply reduces, the asset’s price climbs.
추천 기사


