
Litecoin Price Forecast: LTC likely to crash double-digit as dead-cat bounce scenario unfolds
- Litecoin price approaches its key resistance, with price action emerging as a classic dead-cat bounce pattern.
- Side-lined investors looking to short LTC can do so between $93 and $95.
- On-chain data support the bearish thesis as profit-taking and dormant wallet activities are rising.
Litecoin (LTC) is recovering and nearing its key resistance level, with price action emerging as a classic dead-cat bounce pattern. The technical outlook suggests that side-lined traders looking to short LTC could consider entry points between $93 and $95 in anticipation of the price resuming its downtrend. On-chain data supports the bearish thesis as LTC’s profit-taking and dormant wallet activities are rising.
Litecoin’s holders’ profit booking activity reaches the highest level in two months
Santiments’ Network Realized Profit/Loss (NPL) metric indicates that Litecoin holders are realizing gains.
As shown in the graph below, the NPL experienced a significant spike on Saturday, marking the highest profit booking activity since March 24. Later on Monday this week, a similar spike of lesser intensity was also seen. These spikes indicate that holders are, on average, selling their bags at a significant profit and increasing the selling pressure.
 [09-1748929667426.48.10, 03 Jun, 2025].png)
LTC NPL chart. Source: Santiment
Examining Santiment’s Age Consumed index also shows bearish signs. The spikes in this index suggest dormant tokens (tokens stored in wallets for a long time) are in motion, and it can be used to spot short-term local tops or bottoms. As in LTC’s case, history shows that the spikes were followed by a decline in Litecoin’s price as holders transferred their tokens from wallets to exchanges, thereby increasing selling pressure.
The most recent uptick on Monday was the highest spike since mid-March, which forecasted that LTC was ready for a downtrend.
 [09-1748929687331.50.40, 03 Jun, 2025].png)
LTC Age Consumed chart. Source: Santiment
Litecoin Price Forecast: Dead-cat bounce scenario develops
Litecoin price broke and closed below its ascending trendline (drawn by connecting multiple lows since early April) and its 200-day Exponential Moving Average at $93.70 on Thursday and declined by 8.12% the following day. However, it recovered slightly in the next three days. At the time of writing on Tuesday, it hovers around $89.30.
In this scenario, LTC might experience a dead-cat bounce—a brief price increase within a broader downtrend—potentially facing rejection from the 200-day EMA level at $93.70. This level roughly coincides with the 50% price retracement level at $95.8, making these levels a crucial reversal zone.
Side-lined investors looking to short LTC can do so between the $93.70 and $95.80 ranges, with the stop-loss set slightly above its weekly resistance at $96.30.
If LTC faces correction from the levels mentioned above, it could extend the decline to retest its Saturday low of $83.31. A successful close below this would extend the losses to retest the next weekly support level at $77.19.
The Relative Strength Index (RSI) on the daily chart reads 44, below its neutral level of 50, indicating bearish momentum. Moreover, the Moving Average Convergence Divergence (MACD) indicator also displayed a bearish crossover, supporting the bearish thesis.
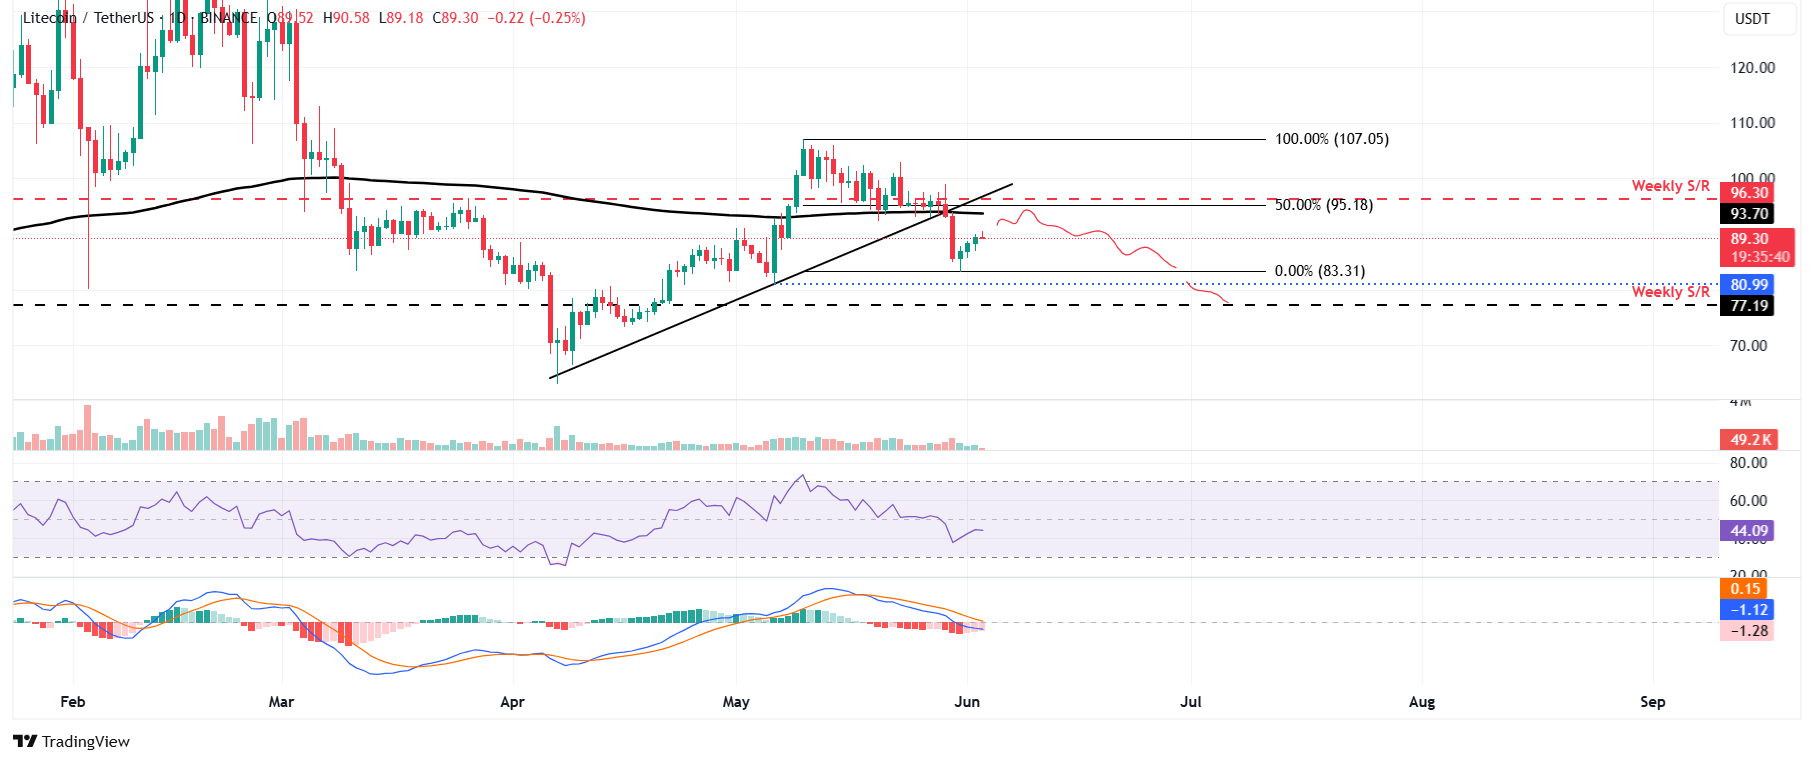
LTC/USDT daily chart
On the other hand, if the Litecoin price closes above the weekly resistance at $96.30, the bearish thesis would be invalidated. Such a scenario could extend the rally toward the May 10 high of $107.05.
추천 기사


