


Ethereum Price Forecast: ETH tackles $2,750 wall amid $1.6 billion options expiry on Deribit
Ethereum price today: $2,640
- Ethereum options worth $1.64 billion on Deribit will expire within next 24 hours, with 95% of puts potentially expiring worthless.
- The recent rising selling pressure could cause call options with strike prices at $2,700 and above to expire worthless.
- ETH bulls bow before the $2,750 resistance again amid mixed signals emerging from the daily chart technical indicators.
Ethereum (ETH) trades around $2,640 on Thursday, with volatility expected from an upcoming $1.64 billion ETH options expiry on the Deribit exchange. The top altcoin could see over 95% of put options expiring worthless if prices remain at current levels.
Ethereum options set for large expiry with puts facing pressure
Ethereum open interest (OI) on the largest options exchange, Deribit — which accounts for more than 70% of global crypto options volume — rose by over 130% in May to a record value of $6.3 billion, signaling strong interest in the top altcoin among investors. Most of these contracts are concentrated at the $3,000 strike price as investors are becoming more bullish, according to data from Amberdata.
Crypto options are financial agreements that give investors the right, but not the obligation, to buy or sell cryptocurrencies at predetermined prices.
Call options dominate the May 30 expiry, with a value of $897.8 million, compared to puts worth $746.6 million. More than 95% of these puts at the $2,600 strike price and below will expire worthless if ETH maintains its current price. The huge volume of calls at the $2,700 strike price and above also risks expiring worthless.
ETH Options Open Interest. Source: Amberdata
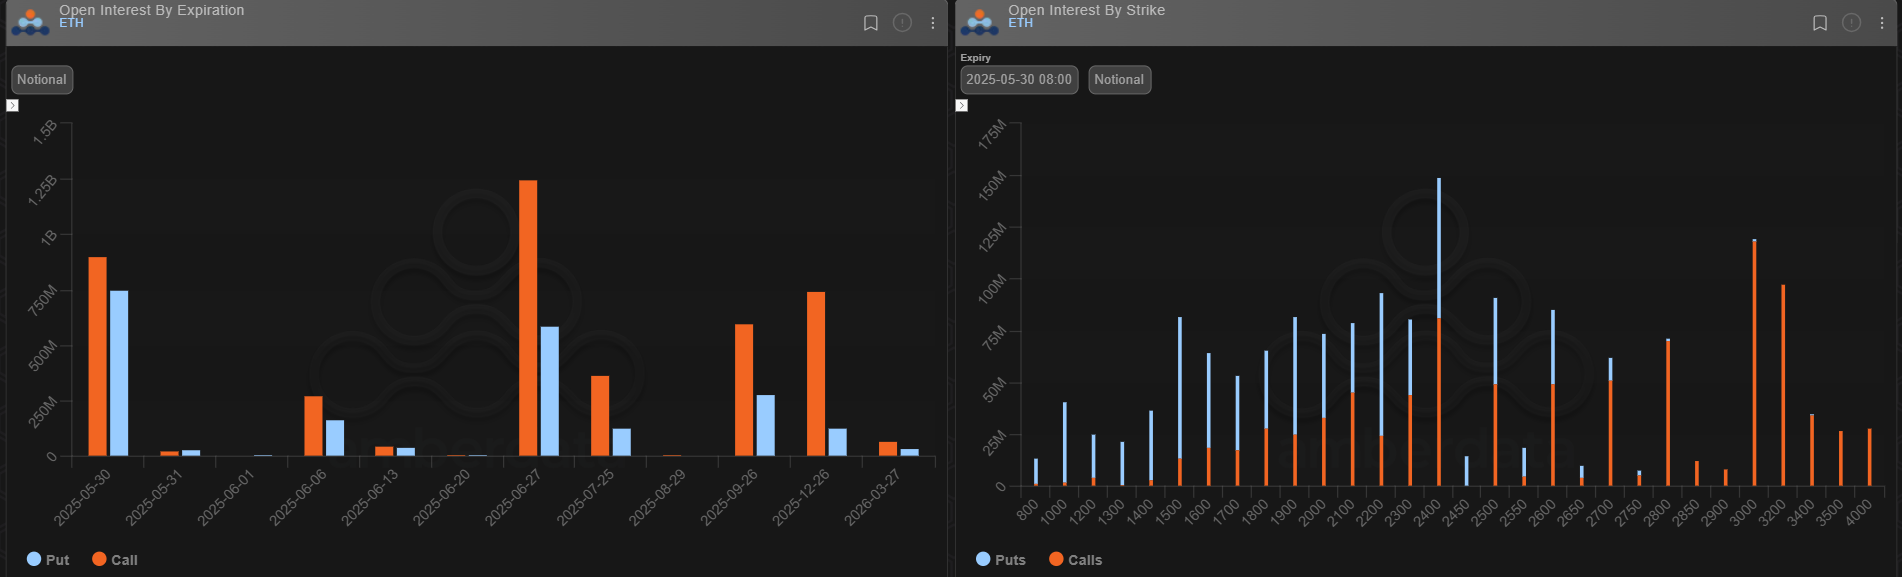
The $2,700 price is a key level to watch ahead of the May 30 expiry at 08:00 AM UTC. With prices nearing the $2,700 strike price, a push from bulls above the level could send an extra $50 million worth of calls into profit.
However, increasing selling activity on the spot market could prevent such a scenario as investors are de-risking after the recent price rise from $2,500 to above $2,700. The selling pressure is visible across global exchanges, which have recorded three consecutive days of ETH exchange net inflows totaling 254,700 ETH on Thursday. Exchange net inflows indicate selling volume outweighs buying pressure.
 - All Exchanges (5)-1748553100714.png)
ETH Exchange Netflows. Source: CryptoQuant
Ethereum Price Forecast: ETH fails to hold move above $2,750 resistance amid mixed signals in technical indicators
Ethereum experienced $112.96 million in futures liquidations over the past 24 hours, according to Coinglass data. The total amount of liquidated long and short positions is $59.94 million and $53.03 million, respectively.
ETH surged above the $2,750 resistance on Thursday, the first time since February 24. However, the historical high selling pressure between the $2,750 and $2,850 range pushed it back below the 200-day Simple Moving Average (SMA) resistance.
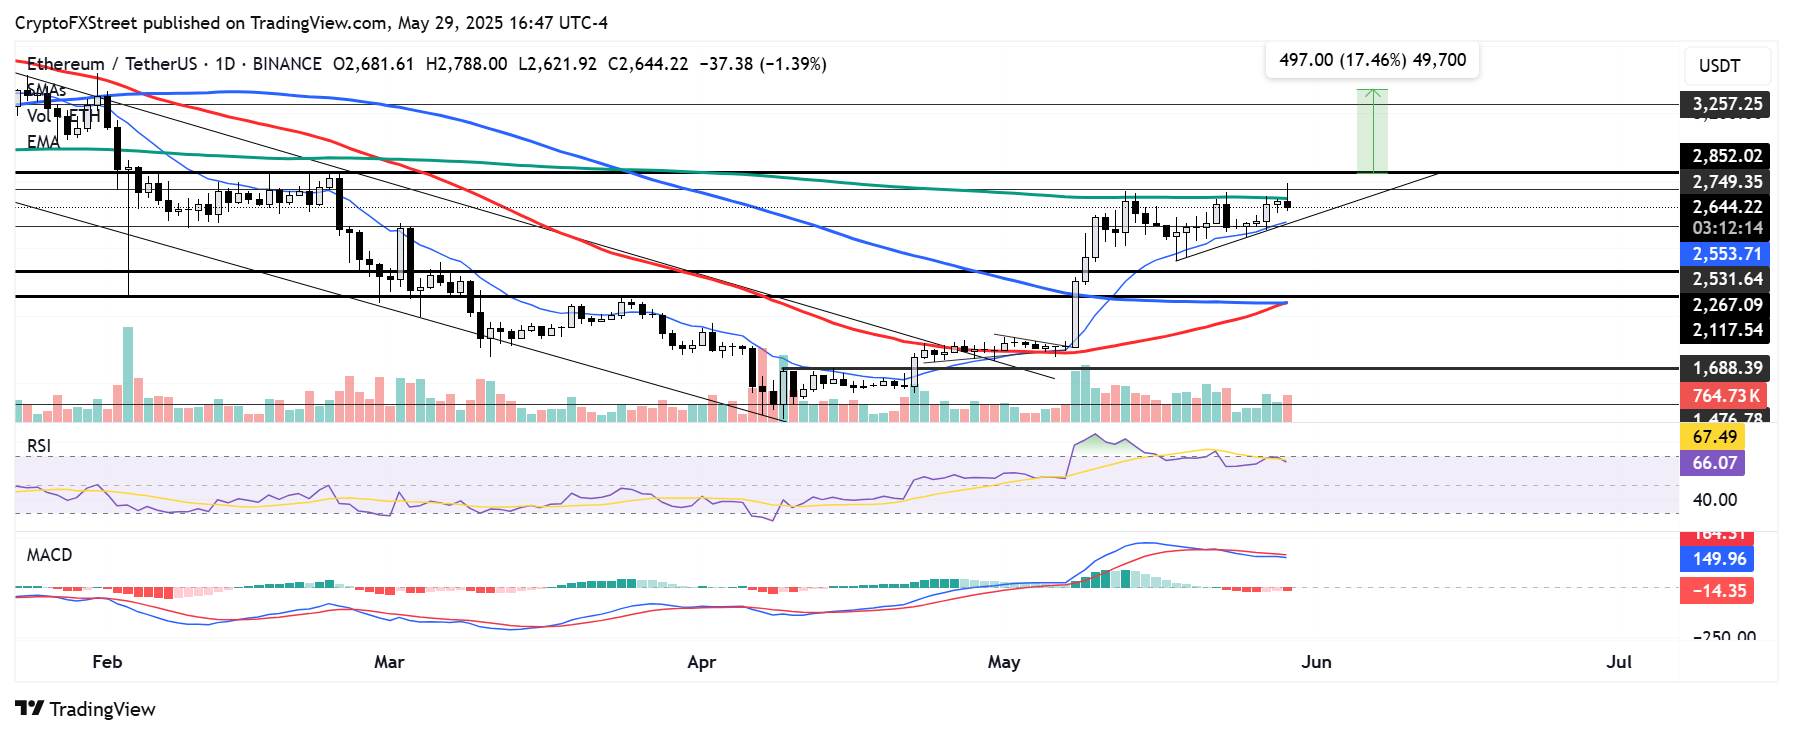
ETH/USDT daily chart
If bulls can sustain a firm move above the key range between $2,750 and $2,850 and hold it as support, ETH will validate an ascending triangle pattern. This could see its price surge past the $3,000 psychological level to test the $3,250 resistance. The target is obtained by measuring the height of the triangle and projecting it upward from the breakout point.
The likelihood of such a move is strengthened by an impending golden cross, where the 50-day SMA is about to cross above the 100-day SMA. This indicates that short-term bullish momentum is outweighing the long-term momentum.
On the downside, ETH could find support near the rising trendline of the triangle, which is strengthened by the 14-day Exponential Moving Average (EMA).
The Relative Strength Index (RSI) is above its neutral level but is currently trending slightly downward. Meanwhile, the Moving Average Convergence Divergence (MACD) posts red histogram bars. The momentum indicators signal a weakening bullish sentiment.
추천 기사


