
Crypto Today: BTC, ETH post mild gains as court ban of Trump tariffs cheers risk markets
- Bitcoin edges up slightly but remains between the $106,000 support level and the $110,000 resistance level.
- Sentiment in crypto markets improves after a US court ruled Trump tariffs are unlawful.
- BTC large volume investors holding between 1,000 and 10,000 BTC are on the rise, signaling growing confidence.
- Ethereum spot volume cools down while futures volume holds steady, hinting at potential volatility.
The cryptocurrency market is grinding higher on Thursday, with Bitcoin (BTC) and Ethereum (ETH) posting minor gains as sentiment improved after a United States (US) court ruled against President Donald Trump's tariffs.
Market overview: Crypto market reacts as court blocks President Trump's tariffs
A US trade court ruled on Wednesday that President Trump overstepped his authority in imposing sweeping tariffs on the country's trade partners. According to a Reuters report, the Court of International Trade ruled that the US Constitution grants Congress exclusive power to regulate trade with other countries, and that this authority cannot be overridden by the President's emergency powers to safeguard the economy.
"The court does not pass upon the wisdom or likely effectiveness of the President's use of tariffs as leverage," a three-judge bench said in the ruling, issuing a permanent injunction on the sweeping tariffs announced by Trump. "That use is impermissible not because it is unwise or ineffective, but because [Federal law] does not allow it," the panel added.
Global markets welcomed the ruling, with S&P futures rising by 1.55%, Dow futures by 1.12% and Nasdaq futures by nearly 2% on the day. The crypto market showed more limited gains, with Bitcoin rising by approximately 0.65% to trade at $108,440 and Ethereum extending gains by over 1.7% to exchange hands at $2,729.
Data spotlight: Large holders are accumulating Bitcoin
Bitcoin's rally to new all-time highs was majorly driven by growing institutional interest, with Exchange Traded Funds (ETFs) posting ten consecutive days of inflows. SoSoValue data shows that Bitcoin ETFs recorded approximately $433 million in net inflow volume on Wednesday, slightly higher than the $385 million posted on Tuesday. Still, the level of inflows is way below those seen earlier this month, when BTC reached the fresh ATH.
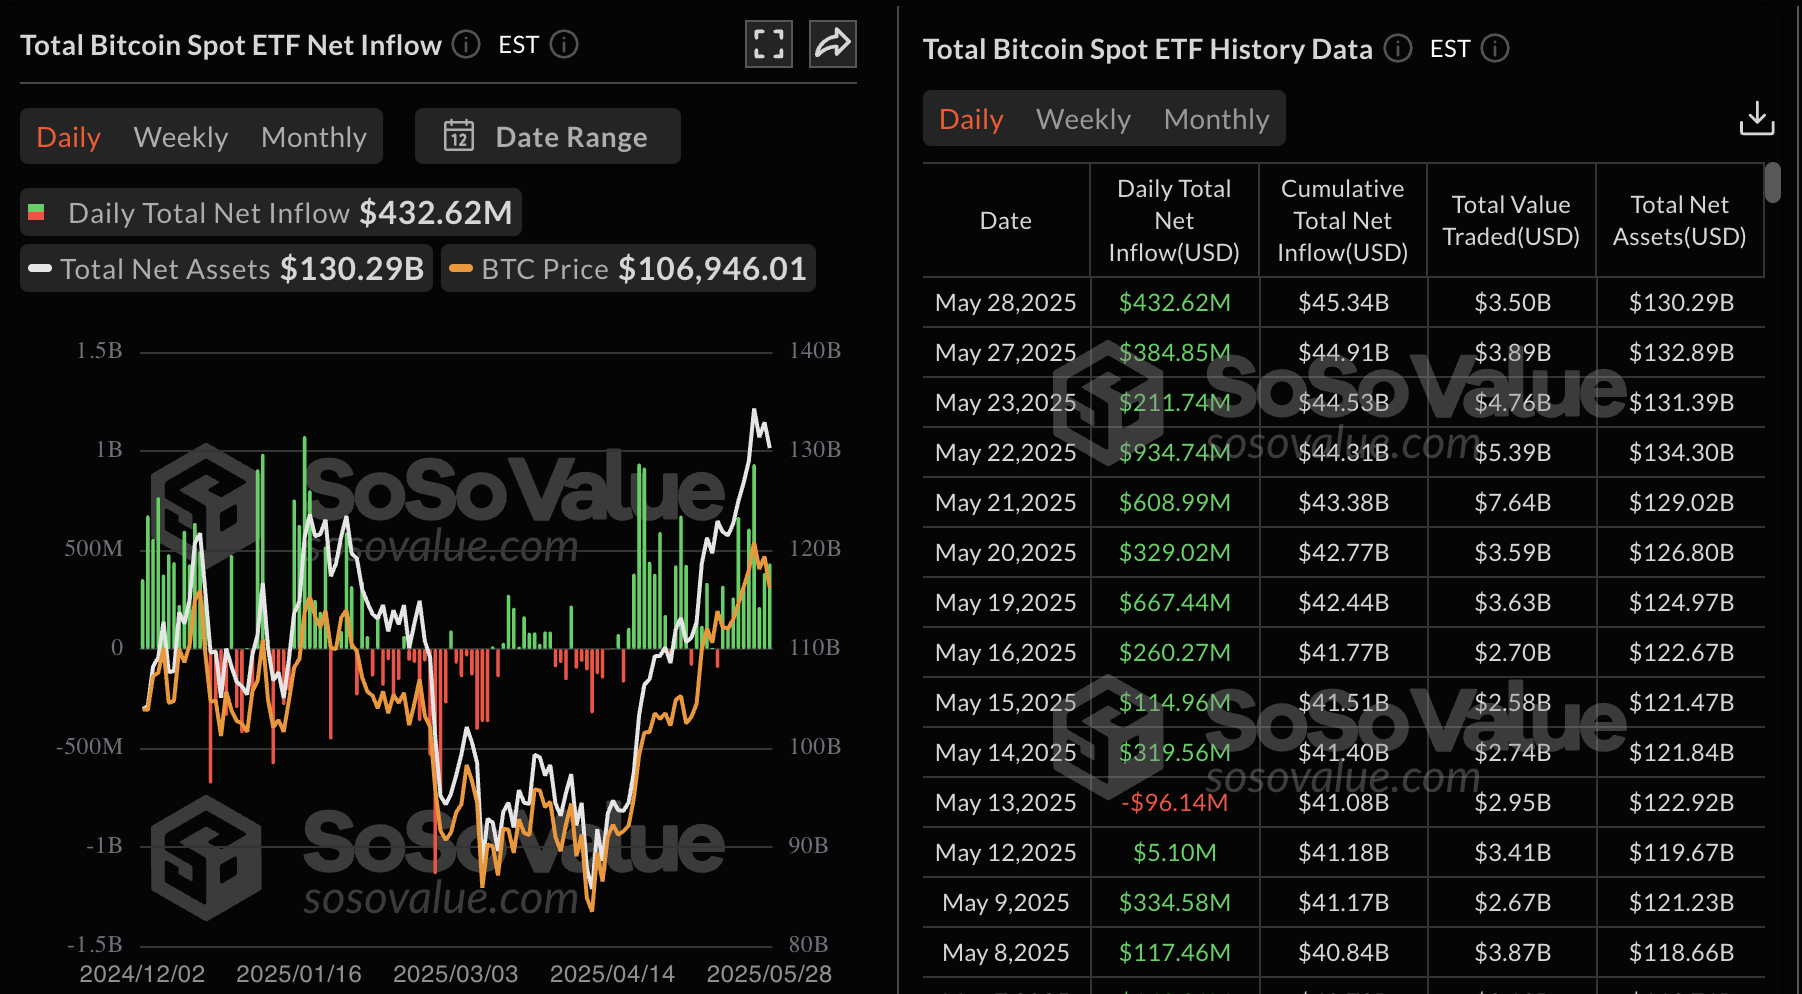
Bitcoin ETF volume | Source: SoSoValue
On-chain data from CryptoQuant indicates that large volume holders, commonly referred to as whales, have continued to accumulate Bitcoin after it reached $111,980. The chart below shows that addresses holding between 1,000 and 10,000 BTC (excluding those associated with exchanges and miners) are rising, suggesting growing confidence among investors.
Historically, an increase in large volume holders and their associated balances has been linked to higher prices.
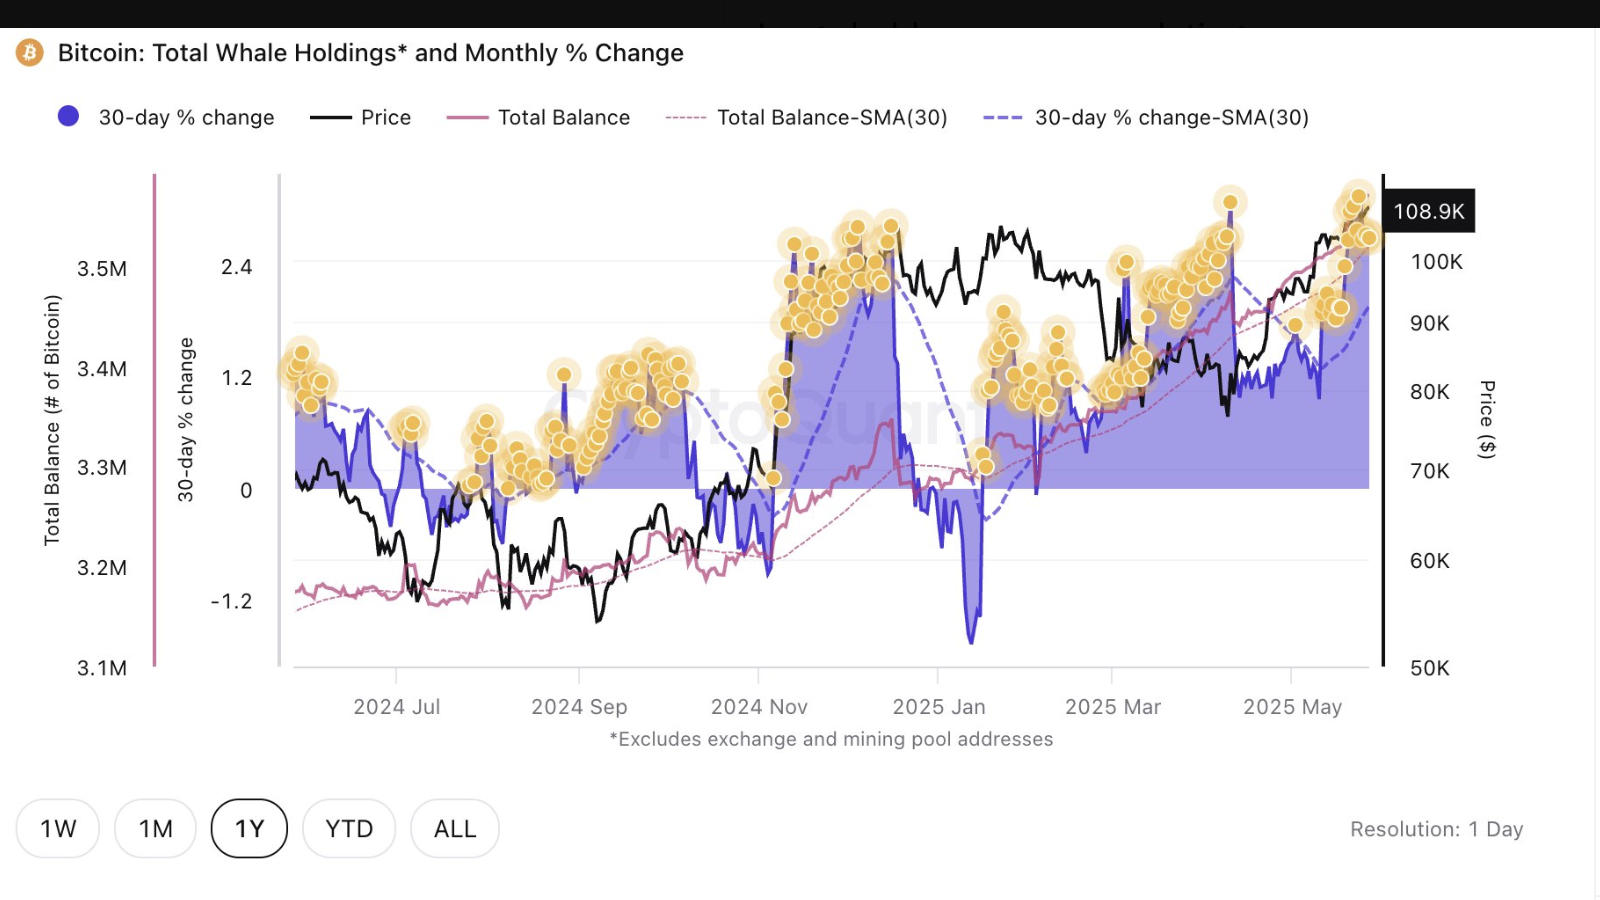
Bitcoin large volume holders stats | Source: CryptoQuant
Ethereum, on the other hand, is displaying mixed signals, with the token's spot volume cooling off while the futures contracts volume soars. Based on CryptoQuant's chart below, the ETH spot volume has turned green, indicating a cooling trend.
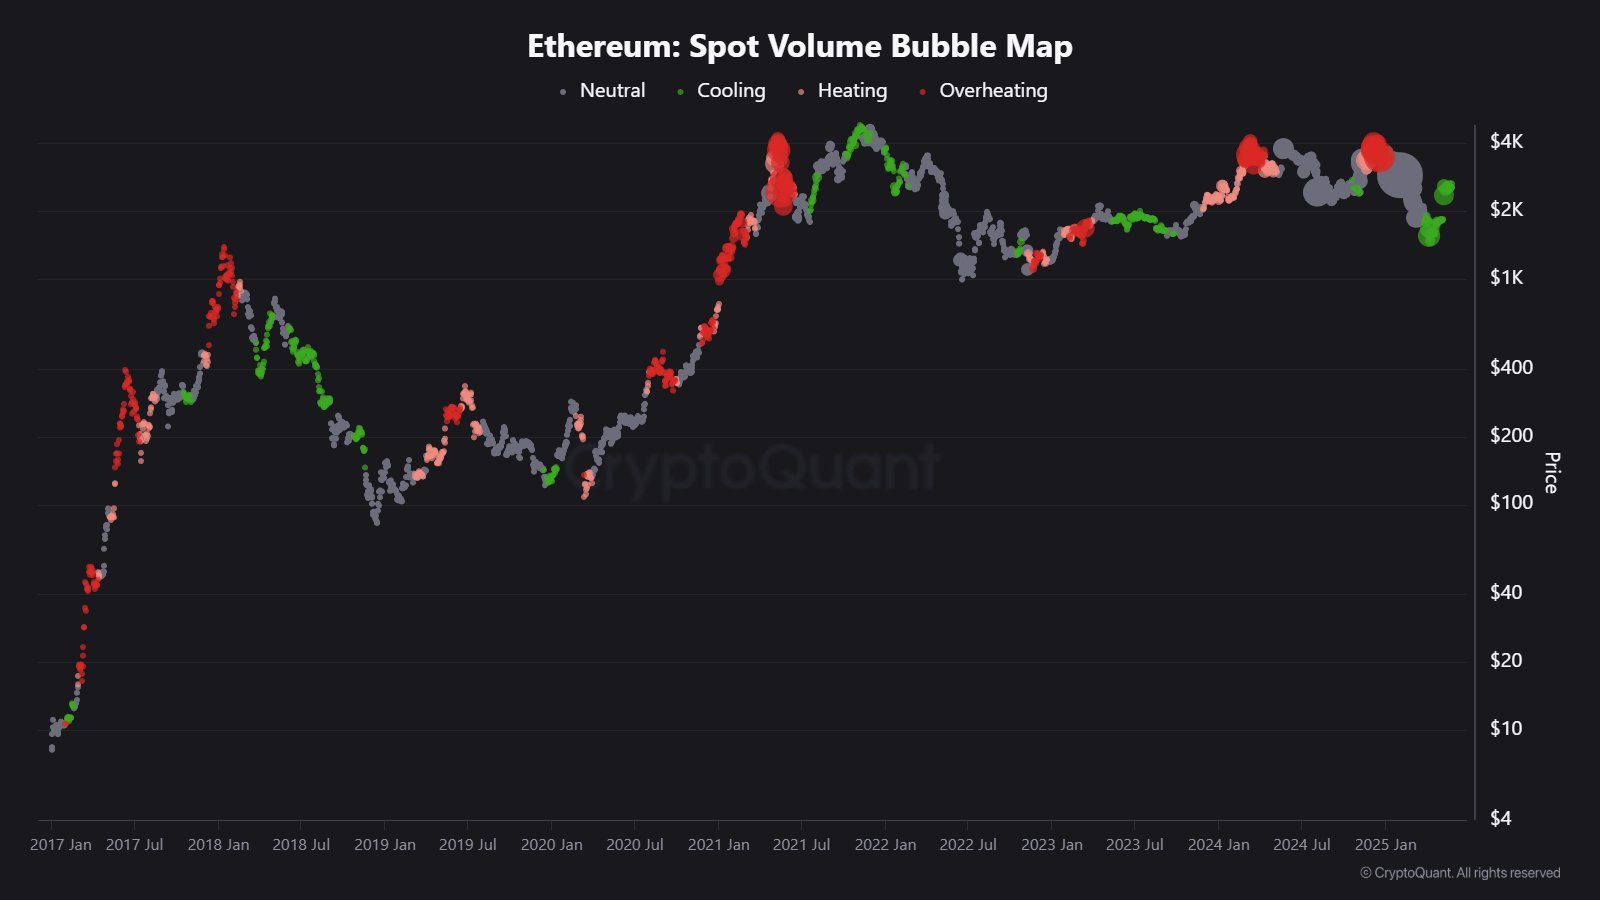
Ethereum spot volume | Source: CryptoQuant
However, with the futures volume chart below showing red (overheating), Ethereum may be heading towards a delicate situation due to potentially heightened volatility. The increase in the futures volume, especially if sudden, can contribute to higher price volatility in the spot market.
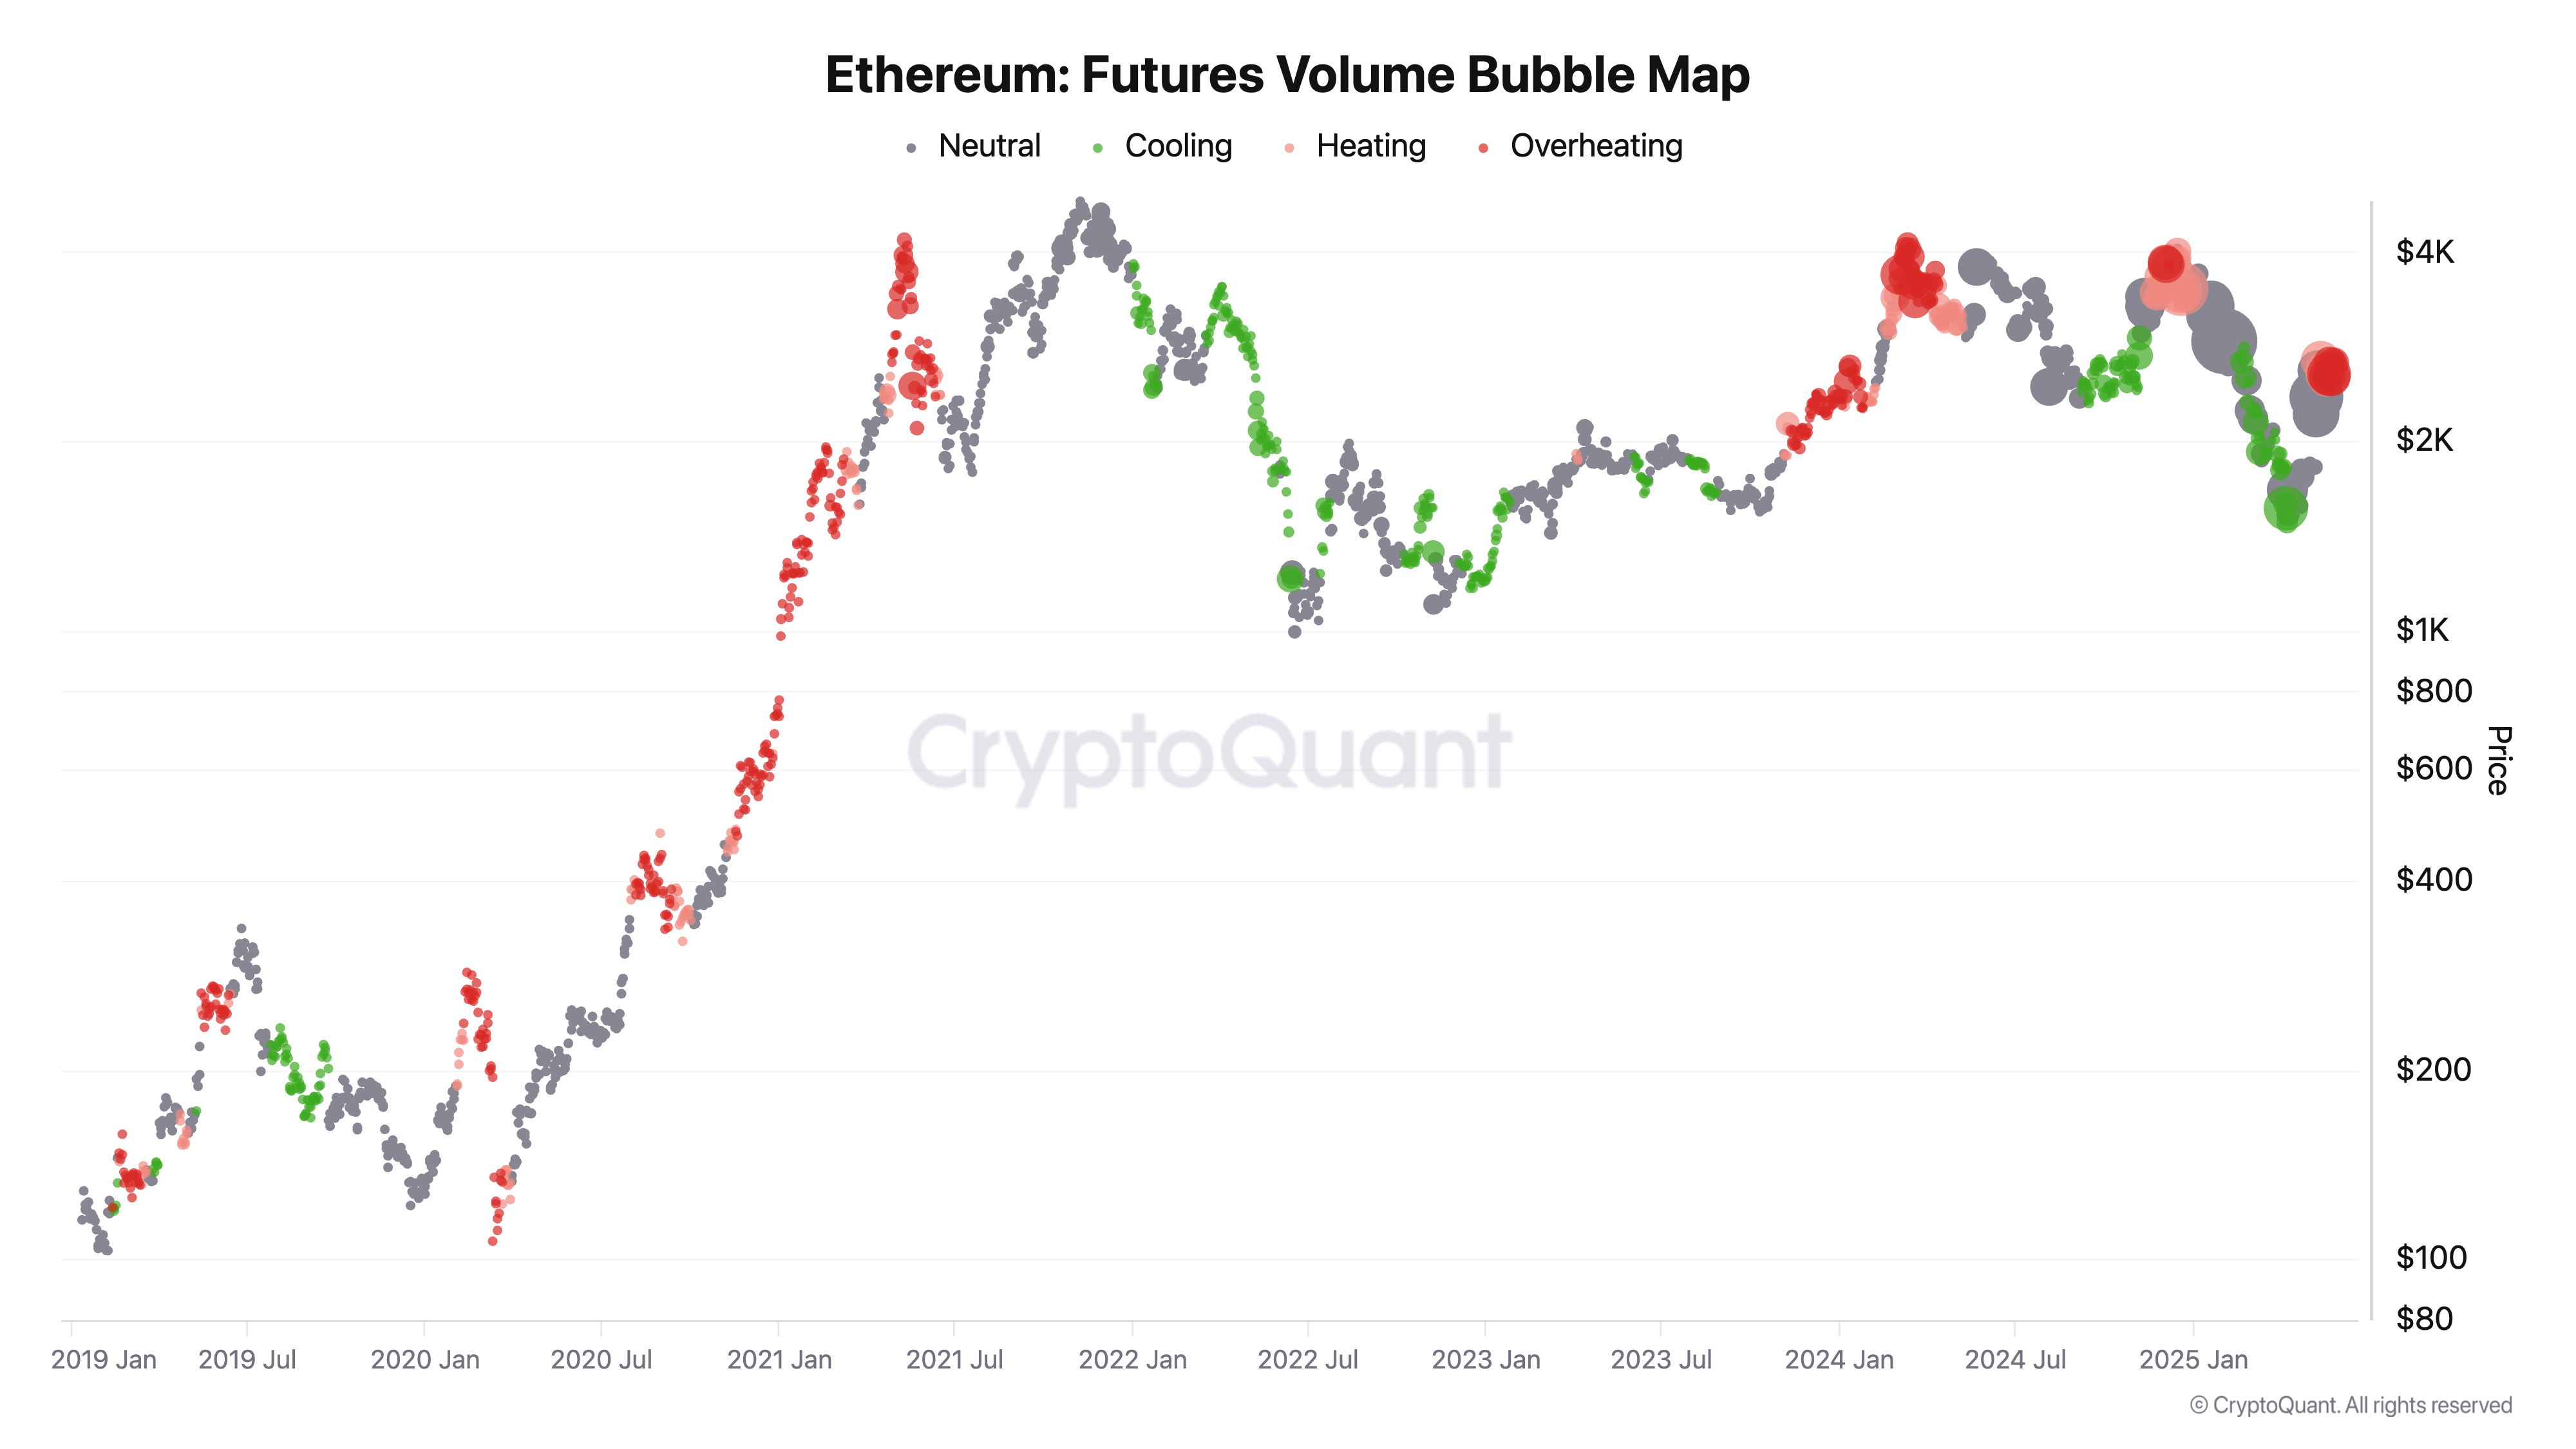
Ethereum futures volume | Source: CryptoQuant
Ethereum's price hovers around $2,729 at the time of writing as bulls push to close the gap to $3,000 in the short term. The smart contracts token sits above key moving averages, ranging from the 200-day Exponential Moving Average (EMA), which offers support at $2,455, the 100-day EMA at $2,269, and the 50-day EMA at $2,267. With the moving averages trailing the price, the path of the least resistance could stay upward in the coming days, reducing the potential for sudden pullbacks.
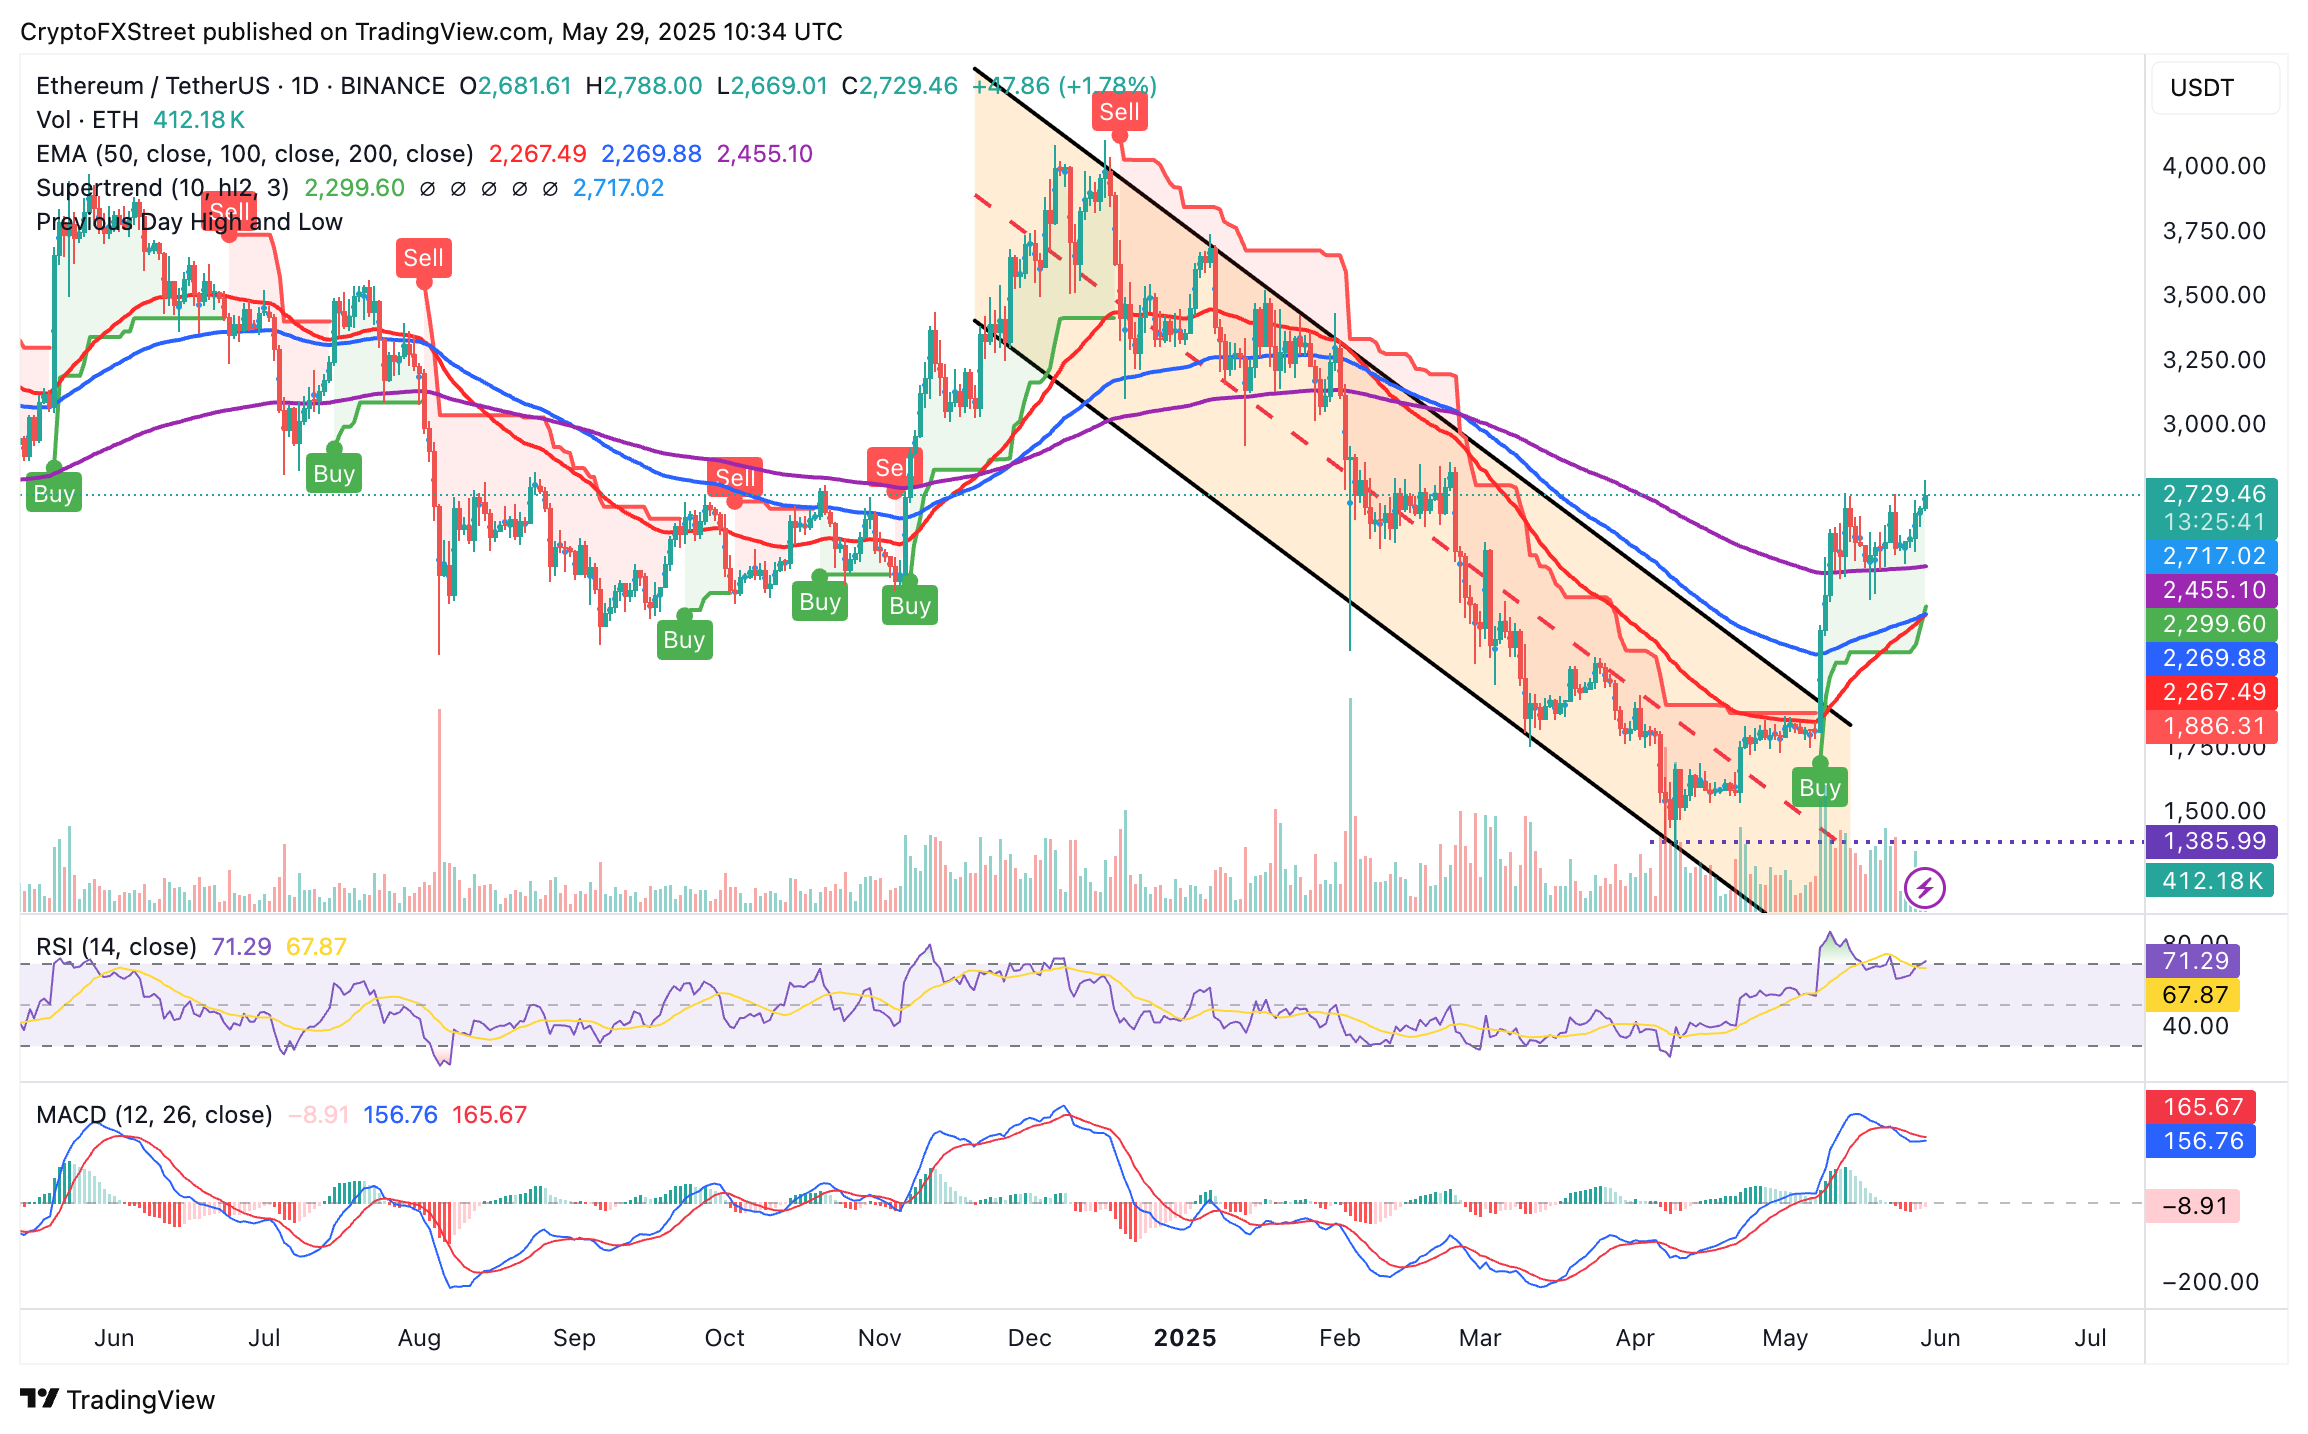
ETH/USD daily chart
Chart of the day: Bitcoin defends bullish structure
Bitcoin has been trading in a narrow range, with support at $106,000 and resistance at $110,000. Despite the uncertainty in the macroeconomic environment and increasing geopolitical tensions in Europe and the Middle East, the largest cryptocurrency by market capitalization is holding onto its recent uptrend, eyeing a break above the range resistance ahead of the weekend.
"While Bitcoin trades at all-time highs, signs of euphoria remain modest in derivatives and the spot market and are currently arguably only showing in BTC treasury companies, which currently experience thriving demand," a K33 Research market update states.
Technically, traders should be cautious in the upcoming sessions because, despite the small intraday gains, the Moving Average Convergence Divergence (MACD) indicator displays a sell signal. This signal, which encourages traders to reduce exposure, was sent on May 25, when the blue MACD line crossed below the red signal line.
At the same time, the Relative Strength Index (RSI) is sloping downward at 62 from the overbought region, signaling increasing overhead pressure.
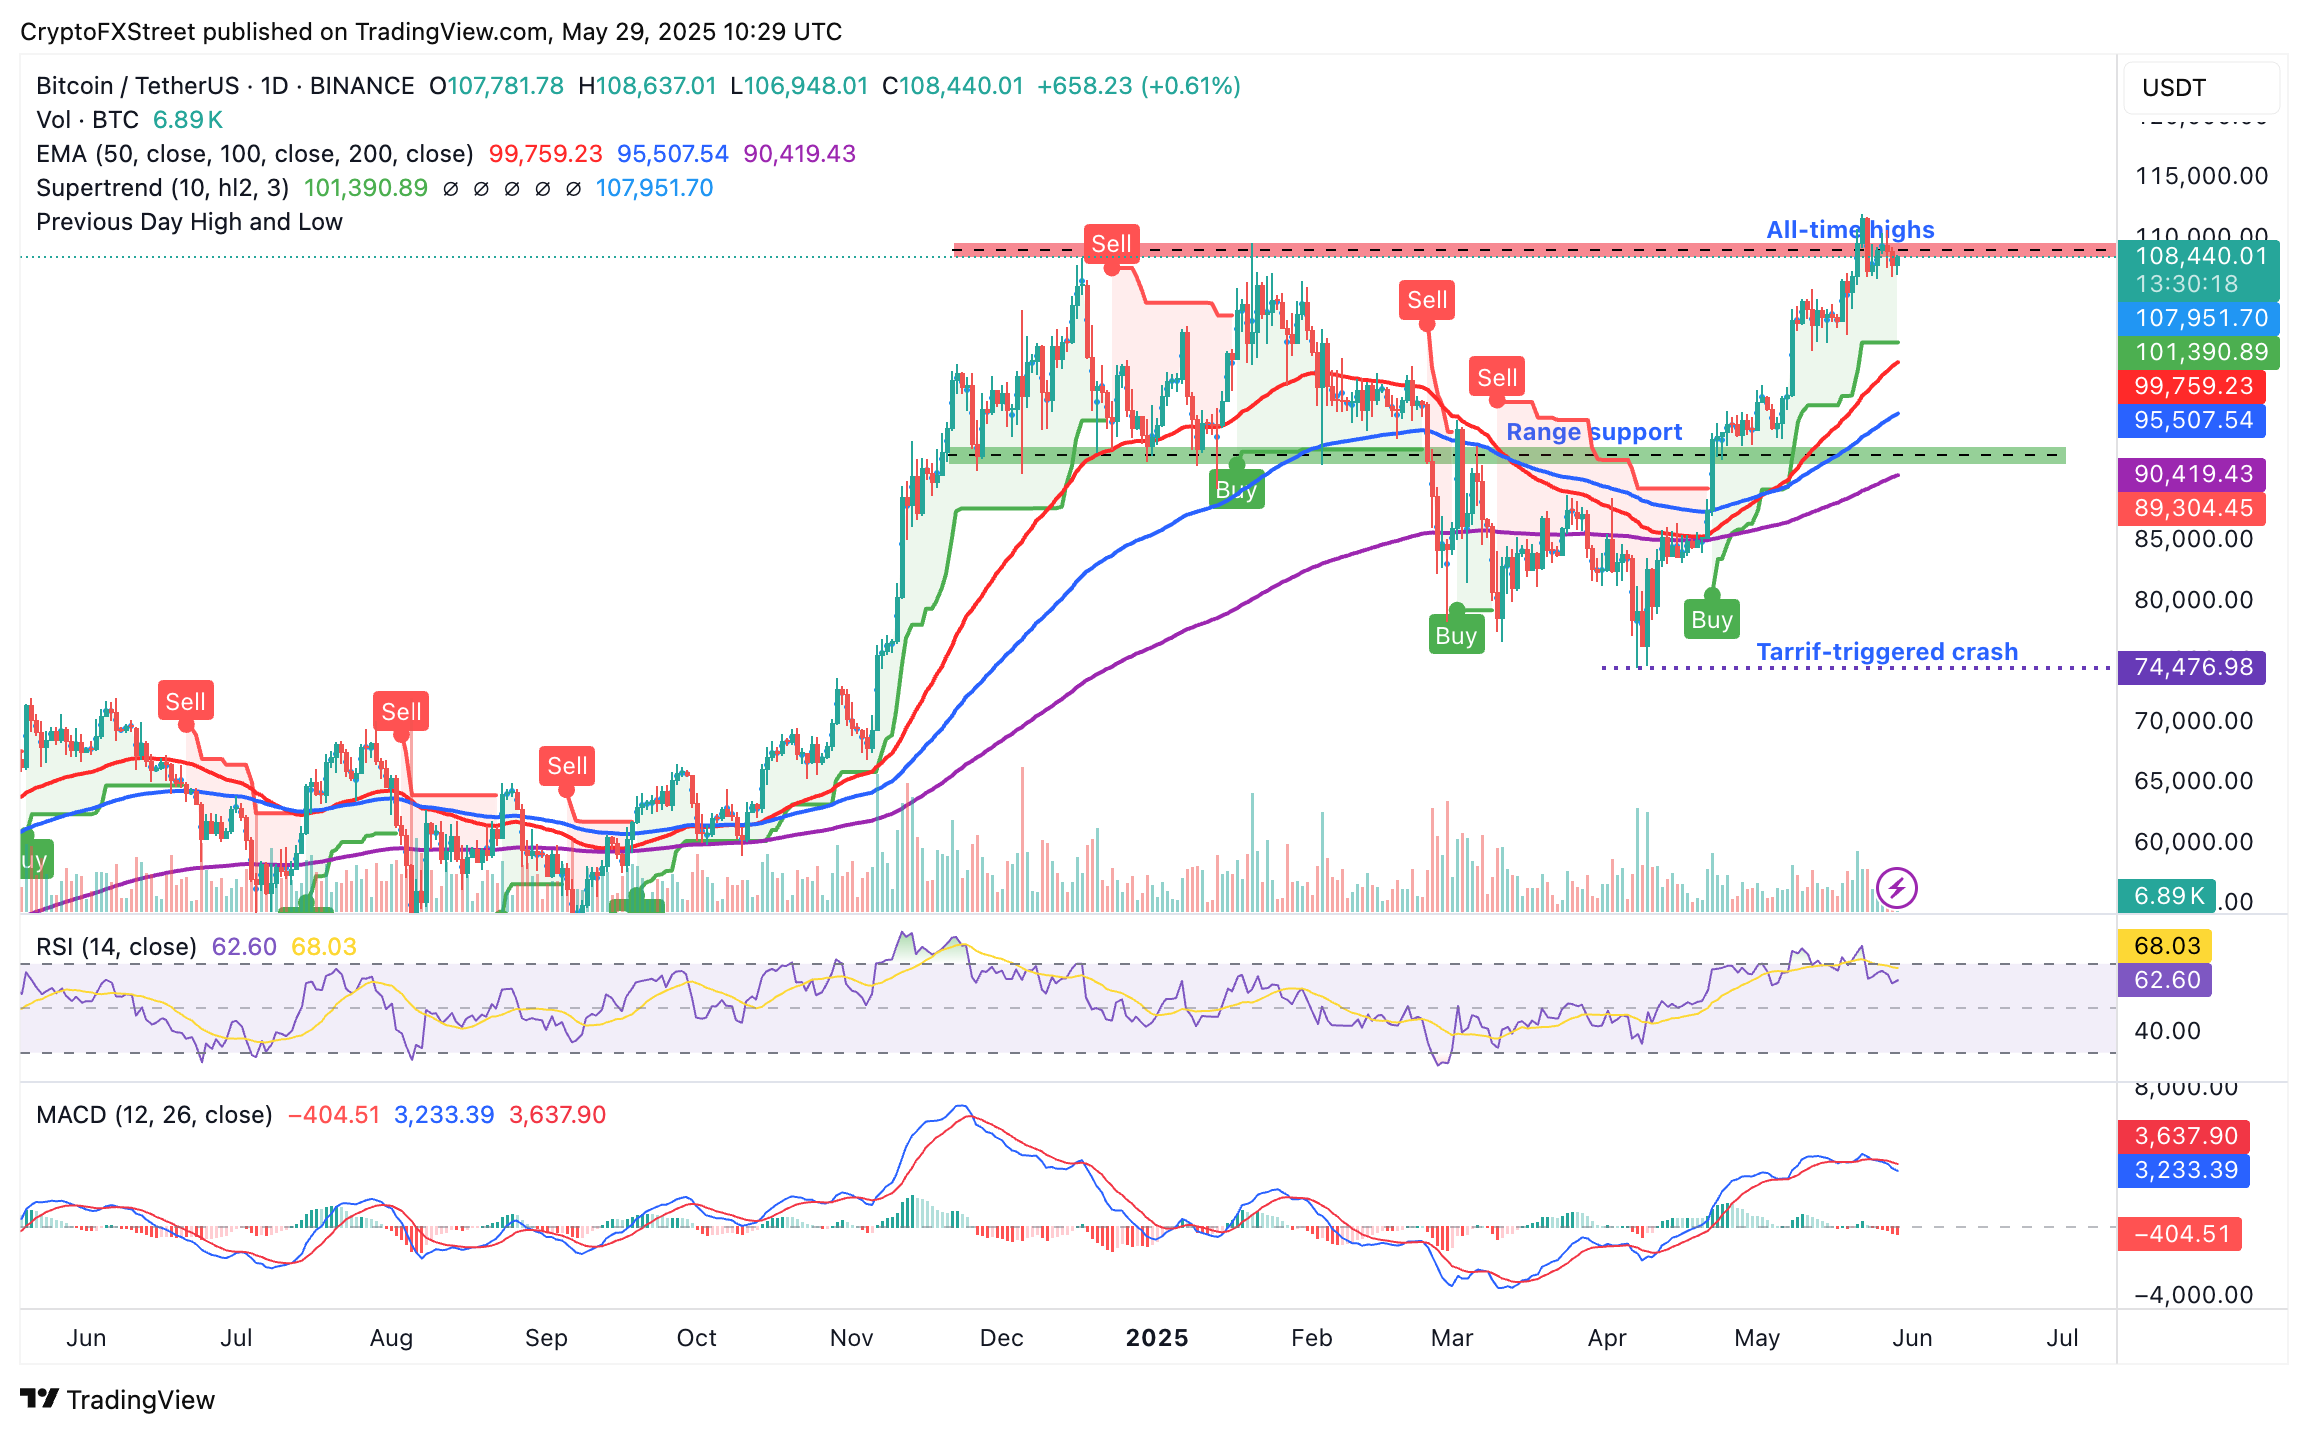
BTC/USDT daily chart
A break above the resistance marked in red on the chart around $110,000 could reignite interest in Bitcoin, as investors bet on gains extending above the all-time high. Key levels on the upside include $115,000 and $120,000, which mark Bitcoin's next price discovery phase.
Cryptocurrency prices FAQs
Token launches influence demand and adoption among market participants. Listings on crypto exchanges deepen the liquidity for an asset and add new participants to an asset’s network. This is typically bullish for a digital asset.
A hack is an event in which an attacker captures a large volume of the asset from a DeFi bridge or hot wallet of an exchange or any other crypto platform via exploits, bugs or other methods. The exploiter then transfers these tokens out of the exchange platforms to ultimately sell or swap the assets for other cryptocurrencies or stablecoins. Such events often involve an en masse panic triggering a sell-off in the affected assets.
Macroeconomic events like the US Federal Reserve’s decision on interest rates influence crypto assets mainly through the direct impact they have on the US Dollar. An increase in interest rate typically negatively influences Bitcoin and altcoin prices, and vice versa. If the US Dollar index declines, risk assets and associated leverage for trading gets cheaper, in turn driving crypto prices higher.
Halvings are typically considered bullish events as they slash the block reward in half for miners, constricting the supply of the asset. At consistent demand if the supply reduces, the asset’s price climbs.
추천 기사


