


Bitcoin Cash Price Forecast: Key levels BCH traders must watch after 45% profit last week
- Bitcoin Cash price tumbled 5% on Monday before stabilizing above the $345 mark.
- BCH price showed more resilience than BTC, which posted an excess of 8% losses on the day.
- Derivatives markets data shows BCH bull traders risk major liquidations if prices break below the $339 level.
Bitcoin Cash price retreated 5% on Monday as bulls struggled to hold the $345 support level. Derivatives markets data suggest BCH faces major downside risks if the negative sentiment lingers.
Bitcoin Cash (BCH) finds steady support at $345 as bulls sit on profits
Bitcoin Cash (BCH) suffered a notable decline on Monday after last week’s surge, which was driven by increased network activity and speculative buying.
The broader market downturn weighed on BCH, with negative sentiment emerging after the United States (US) President Donald Trump administration failed to outline a crypto budget allocation at the White House Summit on Friday. Additionally, the US Nonfarm Payrolls (NFP) data fueled further bearish pressure across global financial markets, including cryptocurrencies.
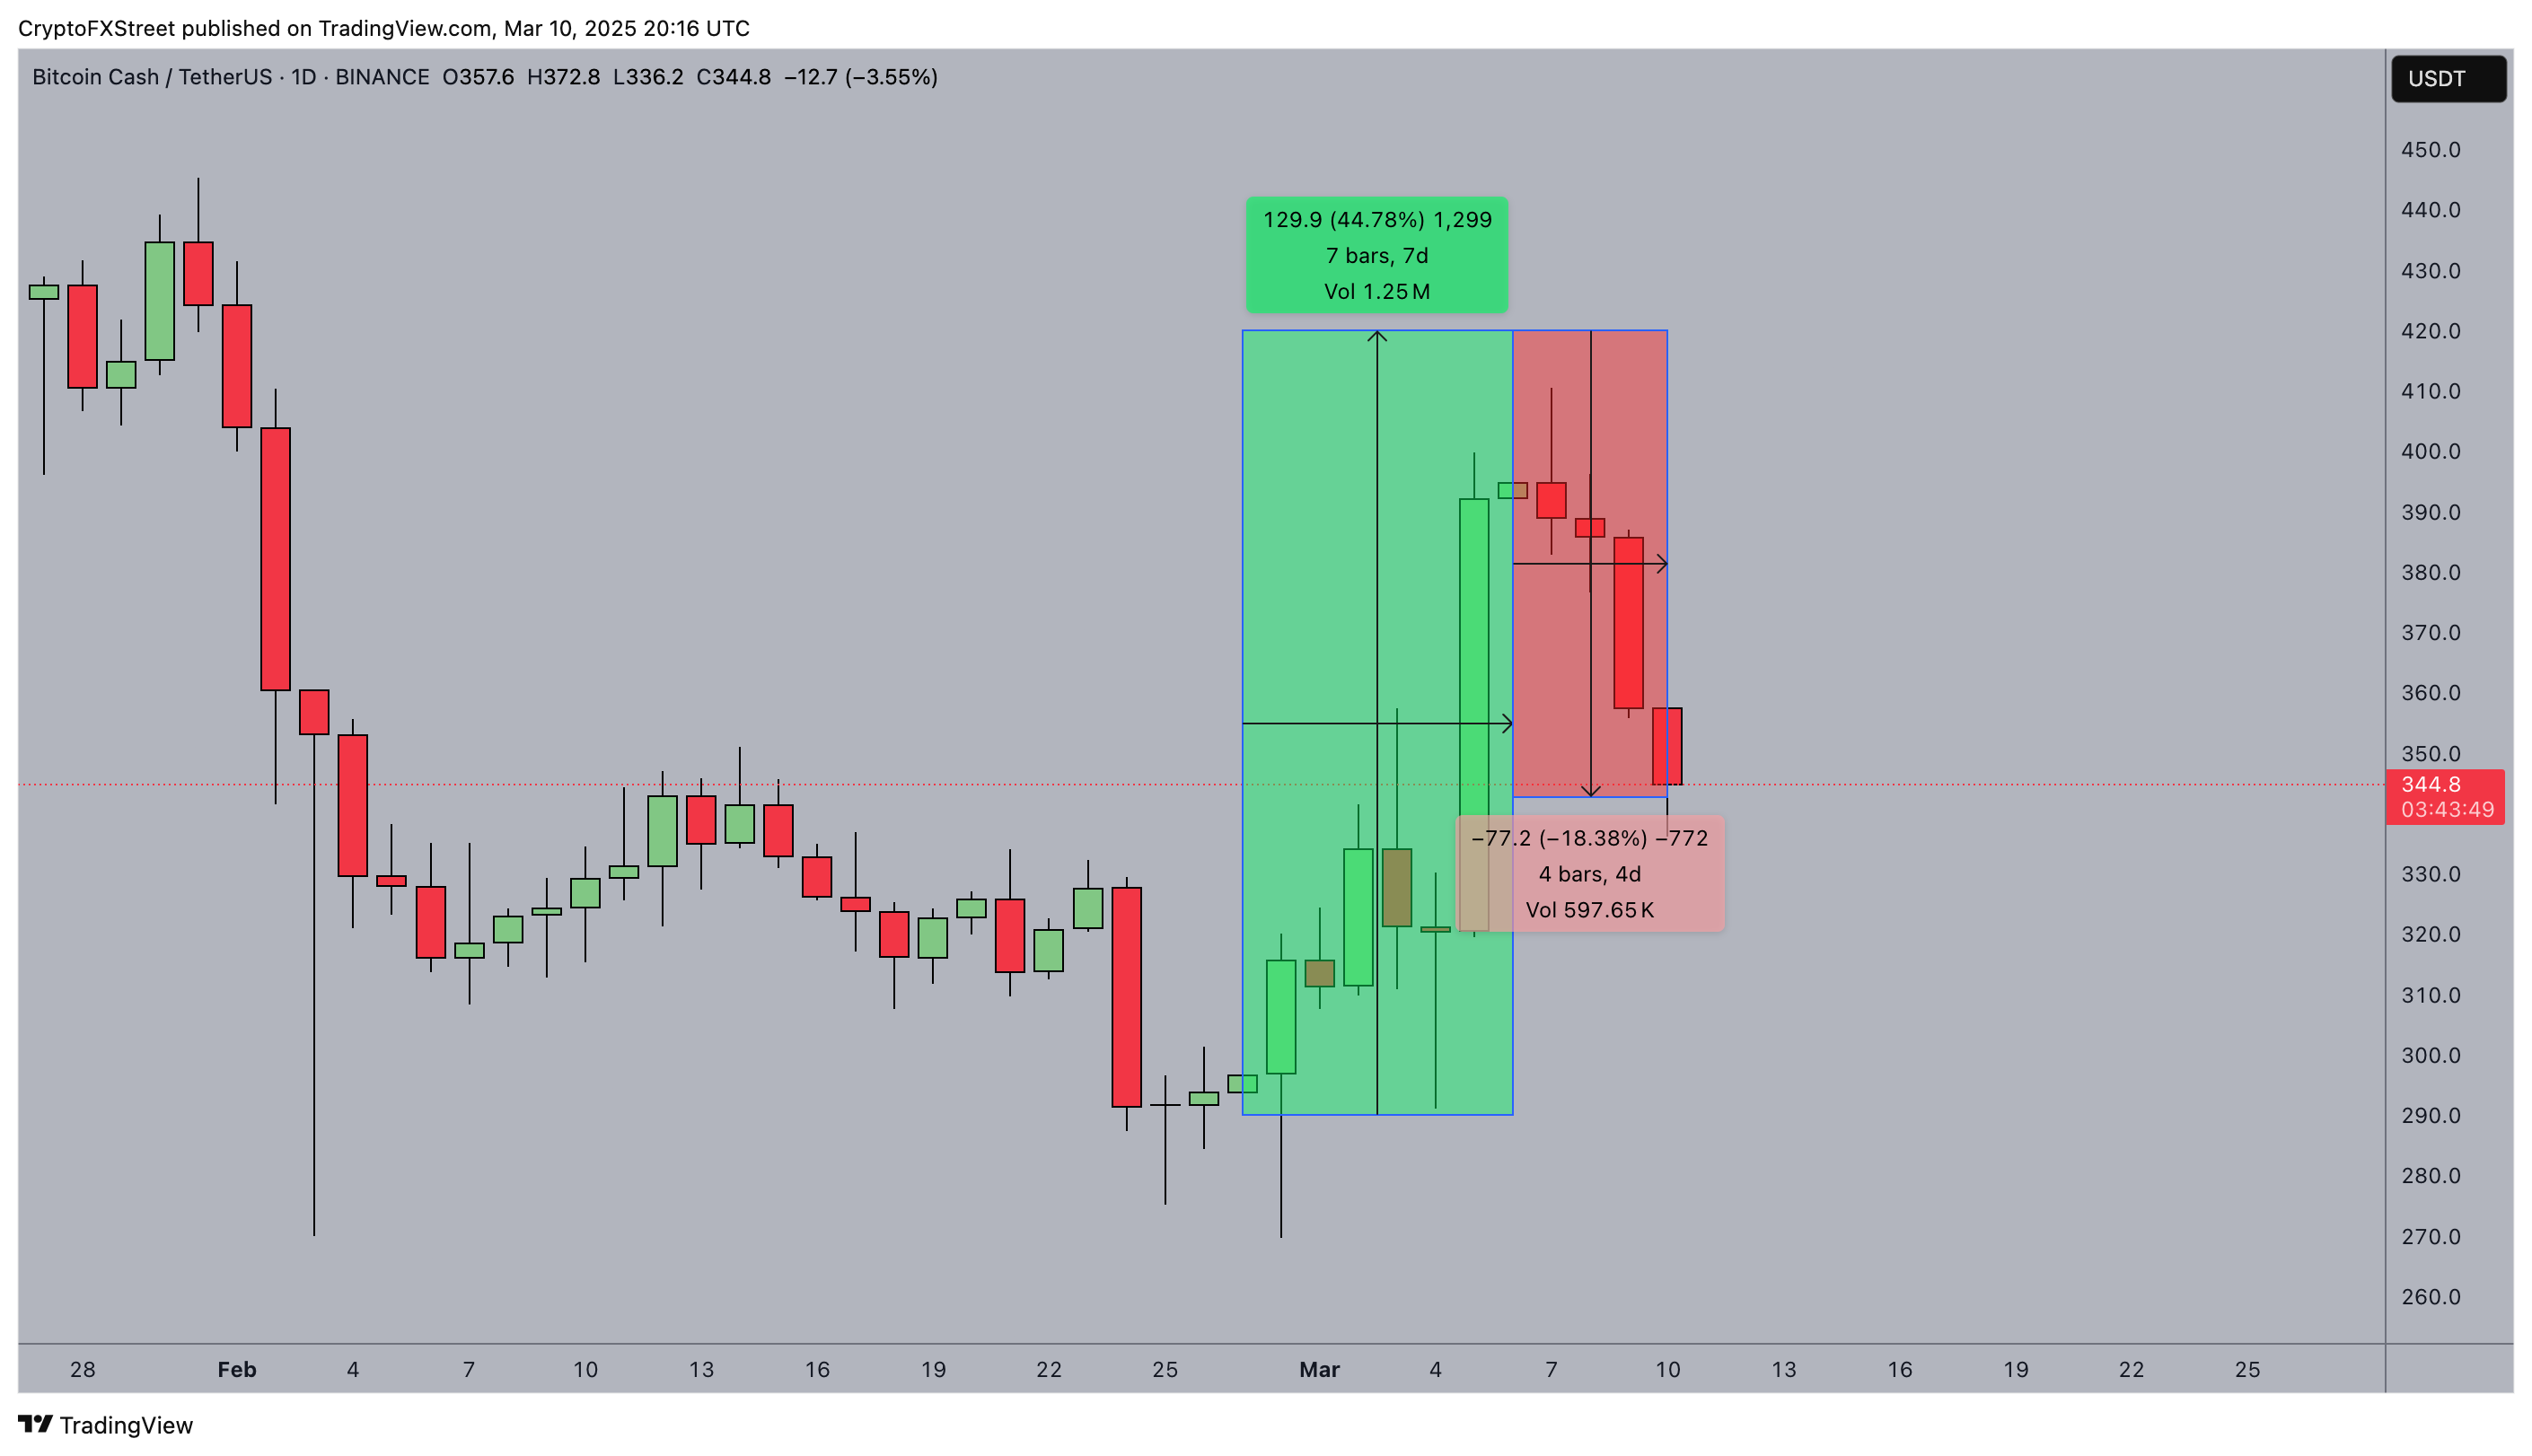
Bitcoin Cash Price Analysis | BCHUSD
Despite Monday’s pullback, BCH traders demonstrated resilience, holding onto last week’s substantial gains. The chart above shows that BCH rallied 45% last week before extending its losses over the past four days to 18%. Compared to Bitcoin’s sharp 8% decline, BCH remained relatively strong, indicating that holders were less inclined to panic sell.
Massive liquidations ahead if BCH bears breach $340 support level
The data suggests that most short-term BCH traders are sitting on double-digit profits, making them less likely to exit their positions compared to BTC holders and low-cap altcoin traders.
However, derivatives market signals indicate that BCH’s resilience could quickly turn into a sell-off if bearish sentiment intensifies.
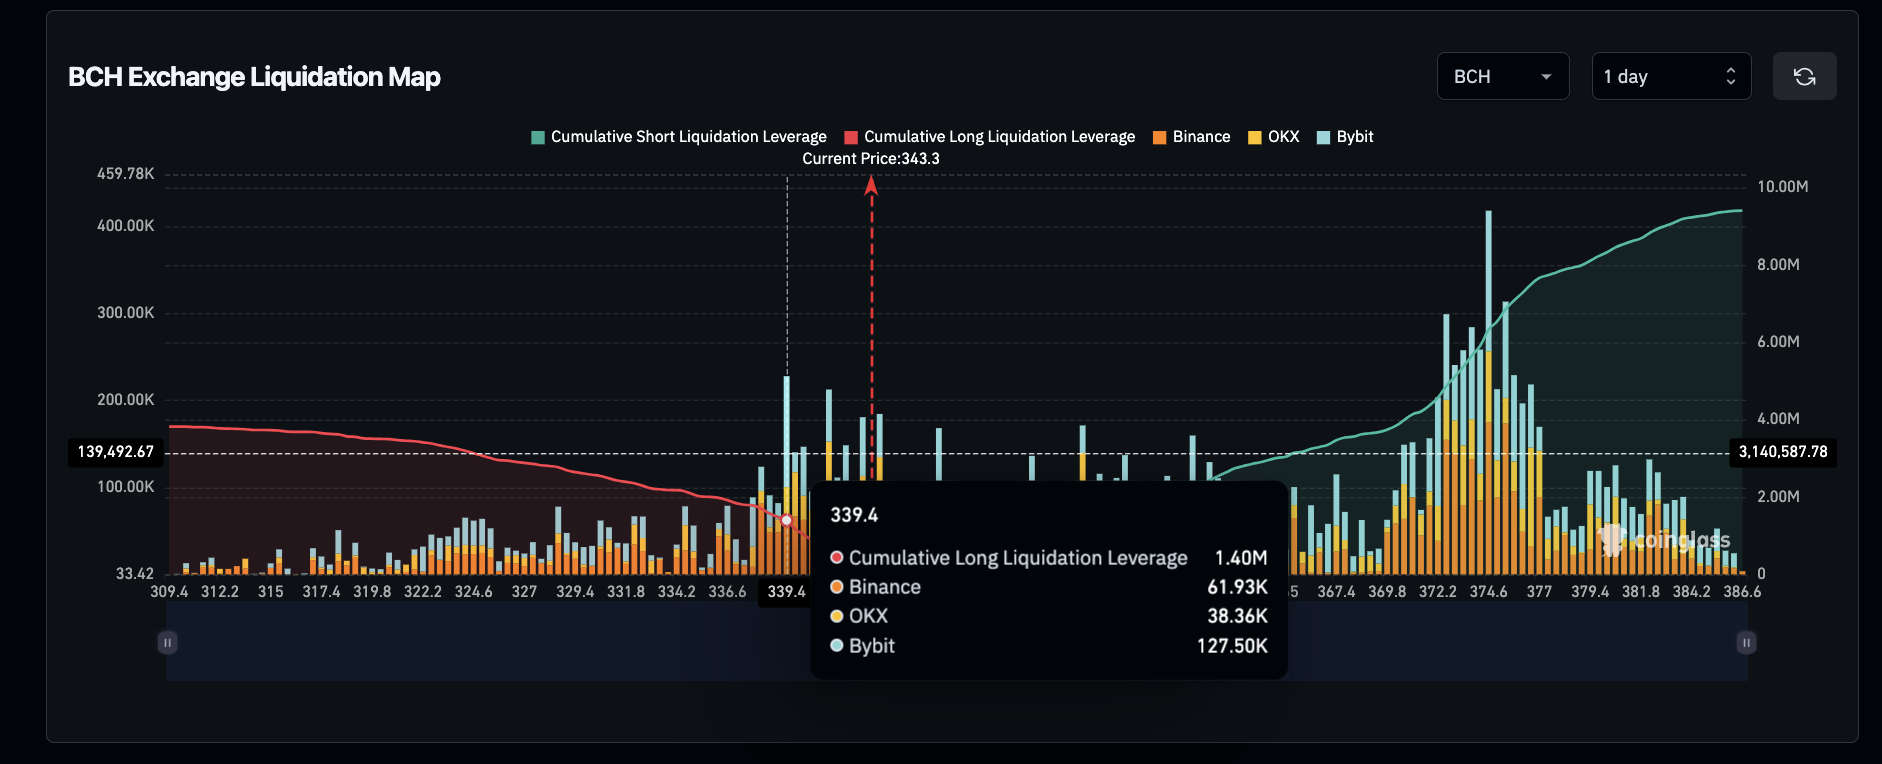
Bitcoin Cash (BCH) Liquidation Map, Coinglass
Validating this concern, Coinglass liquidation data shows that bearish traders have taken firm control of BCH markets.
At press time on Monday, Bitcoin Cash bear traders have deployed $9.4 million in short positions against just $3.8 million in total active long contracts.
This imbalance highlights bearish dominance in short-term market momentum.
However, a closer look at the chart shows that bullish traders have clustered $1.4 million—the largest long leverage positions—around the $339 mark.
This suggests that if BCH loses the $339 support level, cascading liquidations could trigger a sharp downward move, potentially extending losses further in a short time frame.
BCH Price Forecast: Prolonged bearish sentiment puts $340 support at risk
Bitcoin Cash price is leaning bearish after Monday’s 5% drop, signaling that sellers have gained control. The chart reveals a critical retest of the $340 support level, with the Bollinger Bands tightening around this region, suggesting increased volatility ahead.
BCH has already lost momentum after failing to sustain gains above $392, where a sharp rejection triggered an 18% pullback. The MACD histogram also shows a weakening bullish trend, with its blue signal line rolling over, reinforcing bearish sentiment. However, if buyers defend $340, a rebound to $450 remains possible, given the recent 45% surge.
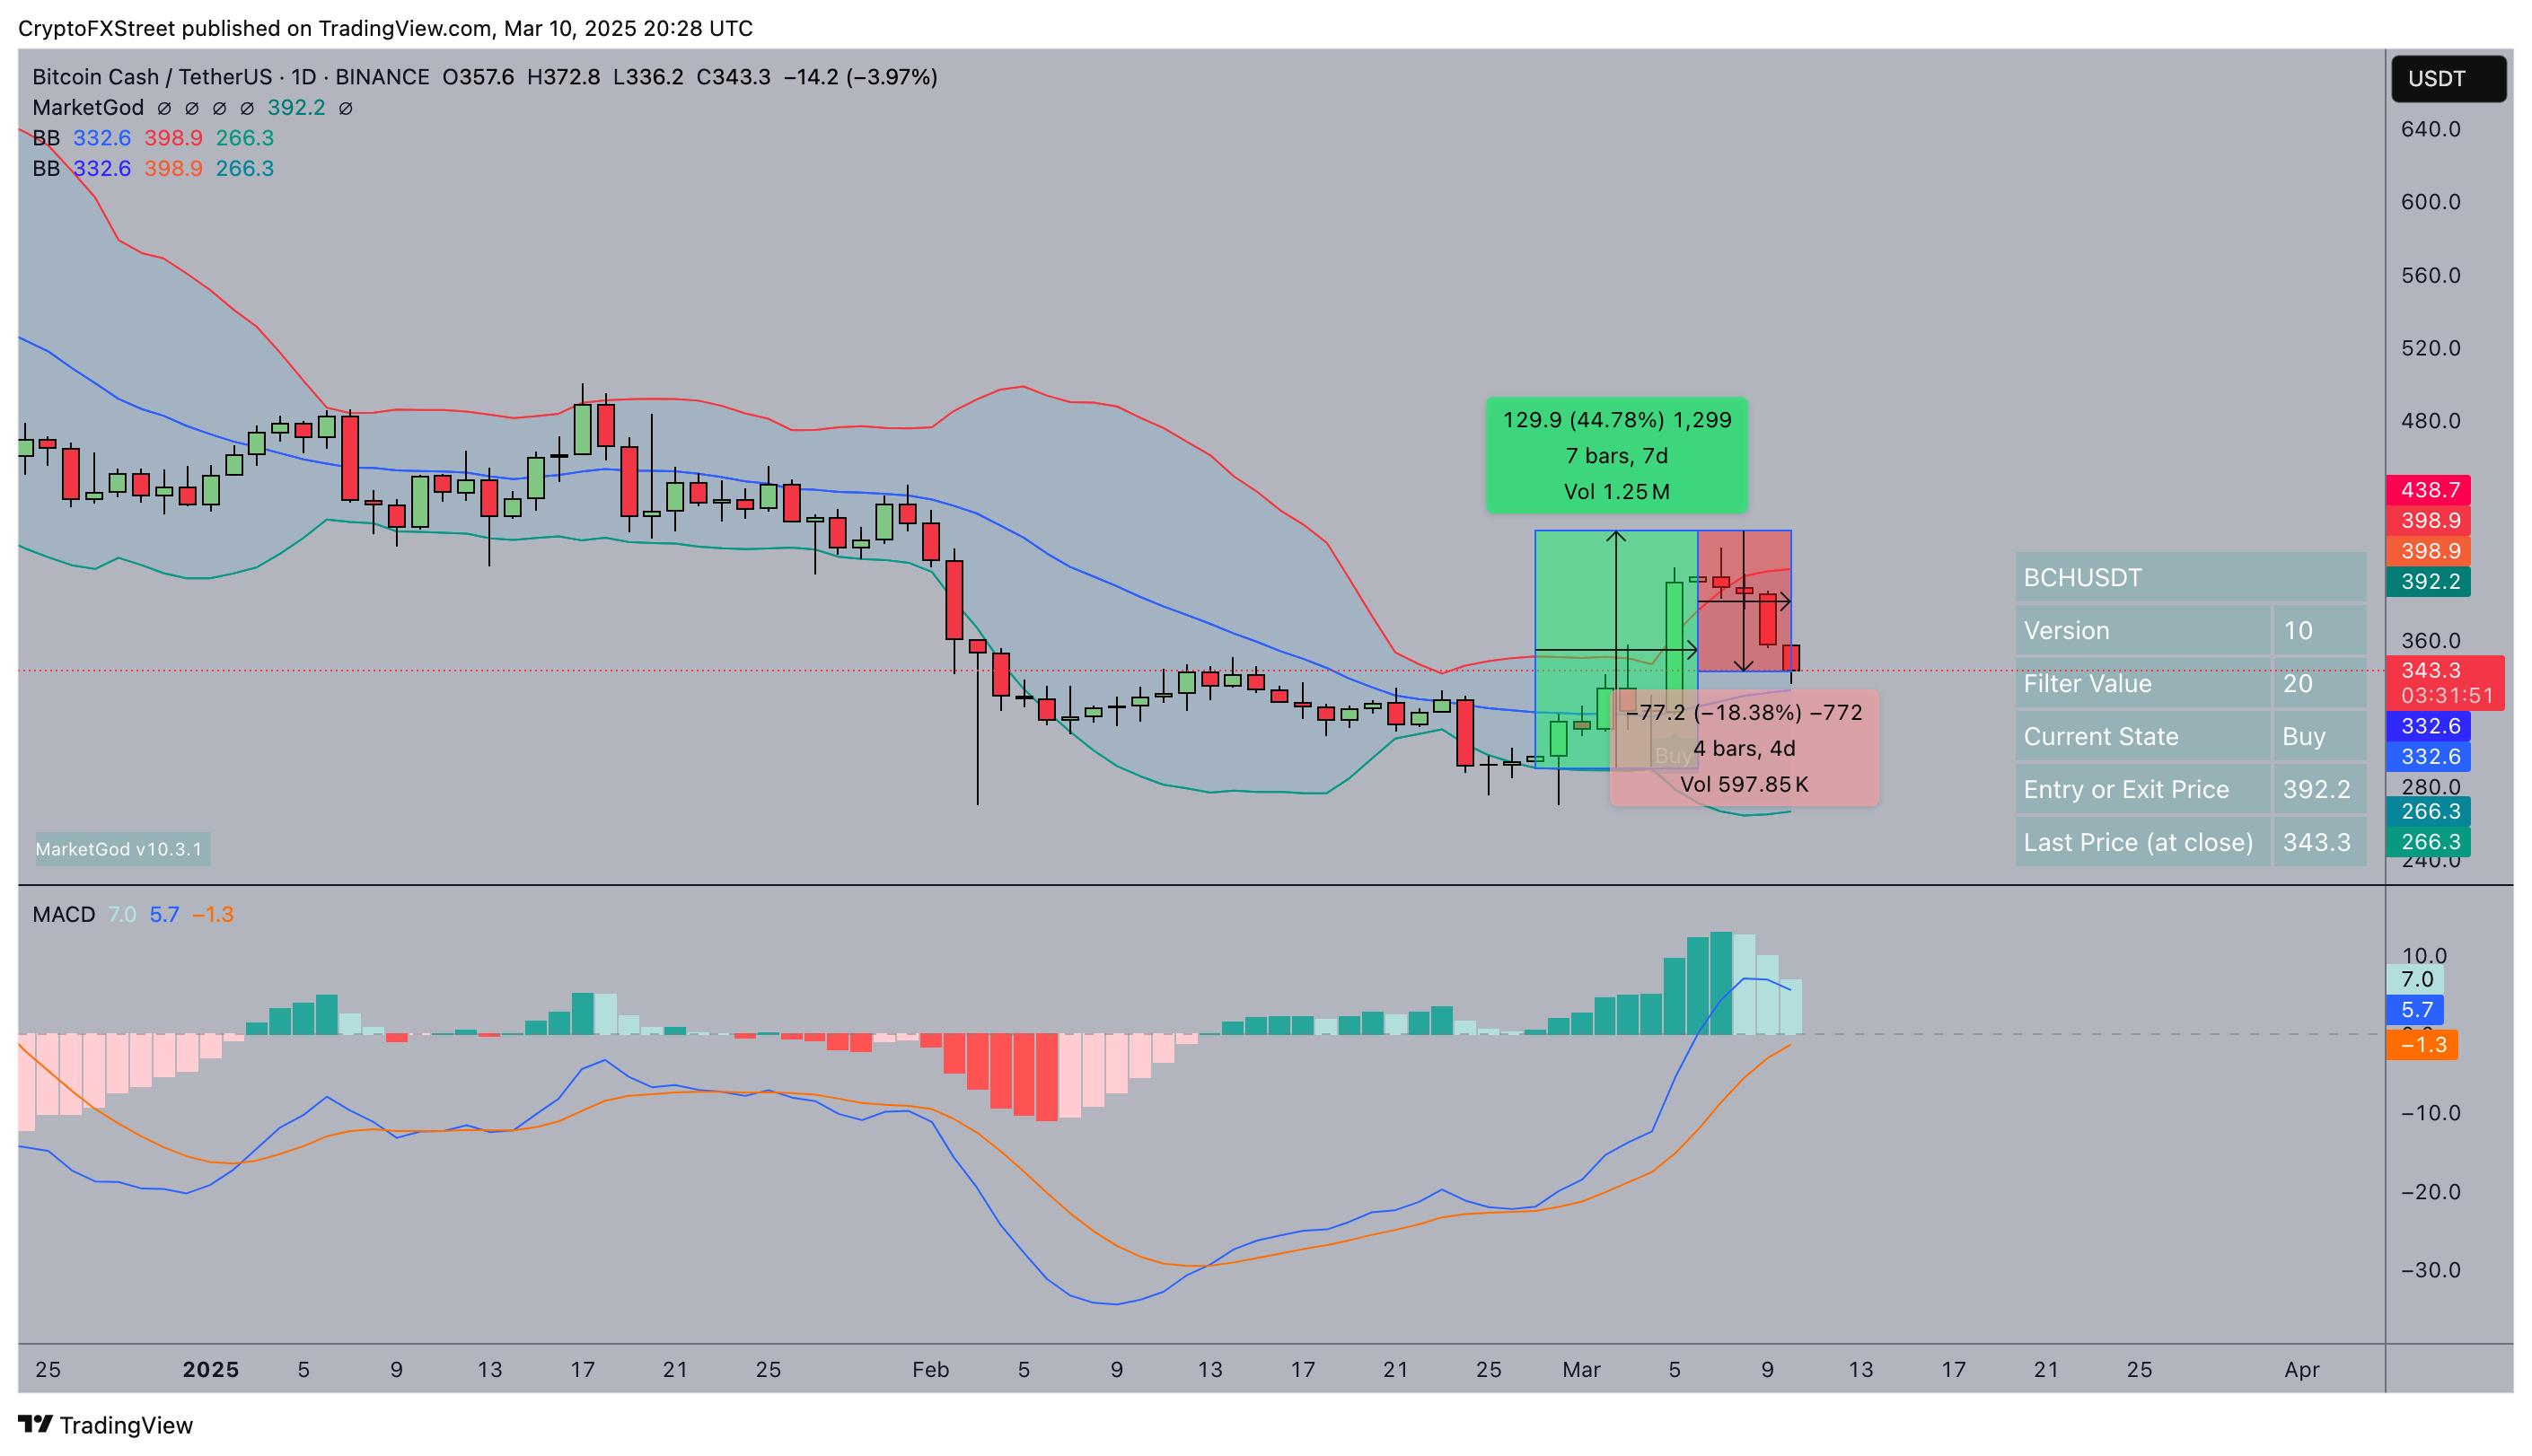
BCH Price Forecast
A key factor supporting the bearish outlook is the Death Cross formation, which occurs when the 50-day moving average crosses below the 200-day moving average.
This bearish crossover typically signals extended downside momentum.
The downward trajectory of the MACD, combined with increasing trading volume on the recent decline, suggests that short sellers are in control.
If BCH fails to hold above $340, liquidation risks could exacerbate losses, pushing the price toward $332 or even $280.
On the flip side, a short squeeze could trigger a swift reversal.
The liquidation heatmap shows that a significant cluster of long positions sits near $339, meaning that an aggressive sell-off could wipe out overleveraged traders before bouncing back.
If BCH reclaims $392, it could trigger a fresh rally toward $450, especially if market sentiment improves.
추천 기사


