

Bitcoin Price Forecast: BTC consolidates as options market awaits policy clarity
- Bitcoin price has been consolidating between $94,000 and $100,000 for almost two weeks.
- A Bitfinex report suggests that BTC continues to be more macro-correlated and shows more maturity as a risk asset.
- QCP’s report highlights how the crypto options market is just waiting on the sidelines for concrete policy changes rather than just pro-crypto rhetoric.
Bitcoin (BTC) has been consolidating between $94,000 and $100,000 for nearly two weeks, with reports from Bitfinex indicating increased macro-correlation and maturity as a risk asset. Moreover, a QCP Capital report suggests the crypto options market remains on the sidelines, awaiting concrete policy changes over pro-crypto rhetoric.
Bitcoin’s volatility at historic lows, the market remains directionless – Bitfinex report
Bitcoin price continues to trade between $94,000 and $100,000 for almost two weeks. At the time of writing on Tuesday, BTC declines towards the lower boundary of the consolidating range and trades near $95,000.
“With volatility at historic lows, the market remains directionless as geopolitical tensions and macroeconomic uncertainty weigh on sentiment,” says Bitfinex ‘Alpha’ report on Monday.
The report explains that Bitcoinʼs Inter-Exchange Flow Pulse (IFP), a useful indicator of market sentiment — has turned bearish on Saturday (shown in the graph below) for the first time since June 2024, suggesting potential downside. The IFP records move in BTC exchange flows from derivatives wallets to spot wallets, suggesting reduced risk appetite, often leading to market corrections.
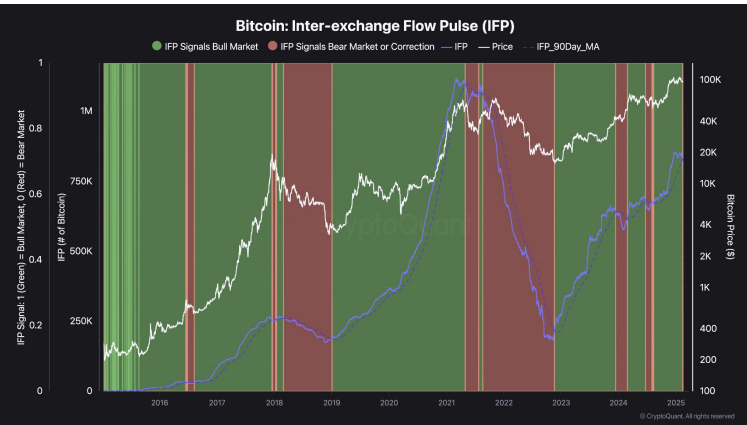
Bitcoin IFP chart. Source: CryptoQuant
Meanwhile, realized losses have spiked during recent retests of range lows, mirroring past capitulation events within the ongoing bull cycle.
In an exclusive interview with Bitfinex, analysts told FXStreet, “The lack of relative weakness in Bitcoin suggests that separation is beginning between the apex crypto asset and the rest of the digital asset landscape.”
The analyst continued that it also signals a shift in investor focus as capital flows into Bitcoin rather than other crypto assets. It suggests the commencement of a new market environment where altcoins are going through entire market cycles. At the same time, BTC continues to be more macro-correlated and shows more maturity as a risk asset.
Options traders hold back, seeking regulatory clarity
QCP’s capital report on Monday highlights that BTC is comfortably back in the middle of the range, and implied volatility continues to drift lower, which is no surprise given that the 7-day realized volatility has dipped to 36v. With no significant crypto-specific catalysts, price action appears more macroeconomic-dependent, particularly as the correlation between BTC and equities remains largely intact.
The report further explains that it is interesting to note that despite the macroeconomic uncertainties (tariffs, debt ceiling, inflation, etc.) and US President Trump’s unpredictability, the crypto implied volatility and the Chicago Board Options Exchange (CBOE) Volatility Index (VIX) are still trading at their lows. BTC has proven relatively unfazed by the recent macroeconomic data, and Open Interest (OI) has not recovered significantly since the January month-end expiry. This suggests that the crypto options market is just waiting on the sidelines for concrete policy changes rather than just pro-crypto rhetoric.
“The market remains undecided on whether it is worth paying for decay even with vols at these levels, which are reminiscent of Q2-Q3 last year when BTC struggled to break out of its multi-month range. Instead, most flows have been near-dated vol selling or trying to trade the range rather than positioning for a big breakout,” says QCP’s analyst.
Bitcoin Price Forecast: BTC is heading towards $90,000
Bitcoin price broke below the $100,000 support level on February 4 and has been consolidating between $94,000 and $100,000 since then. At the time of writing on Tuesday, BTC declines towards the lower boundary of the consolidating range.
If BTC breaks and closes below the lower boundary of the consolidating range of $94,000, it could extend the decline to test its psychologically important level of $90,000.
The Relative Strength Index (RSI) on the daily chart reads 41, consolidating after being rejected at its neutral level of 50 last week and indicating slightly bearish momentum. Moreover, the Moving Average Convergence Divergence (MACD) showed a bearish crossover and red histogram bars, hinting at further correction.
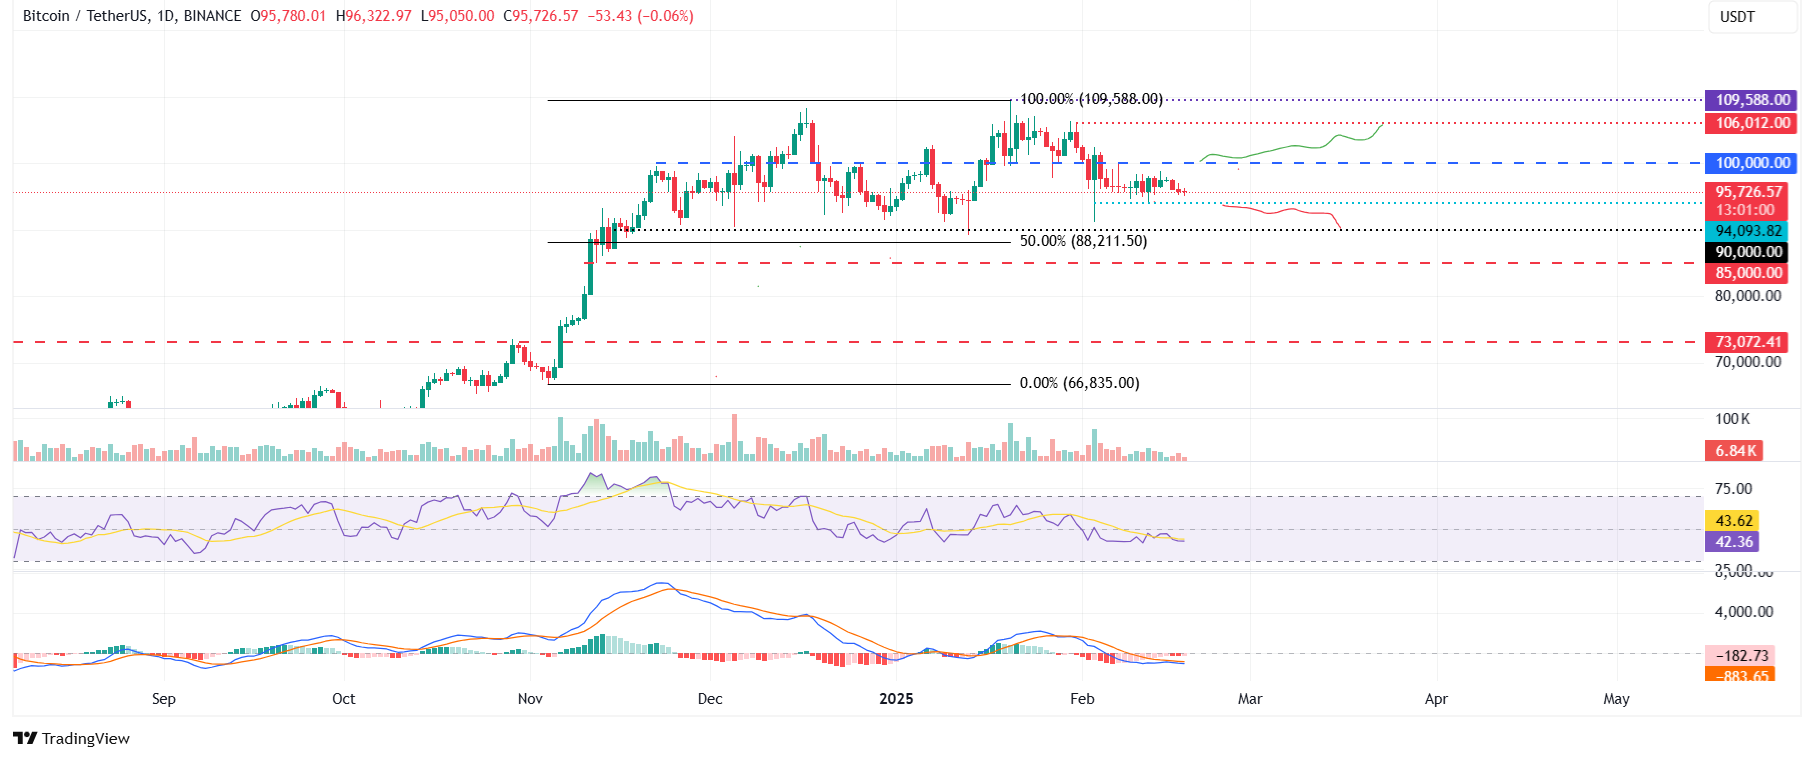
BTC/USDT daily chart
However, if BTC recovers and breaks above the upper boundary of the consolidating range of $100,000, it would extend the recovery to retest its January 31 high of $106,012.
Bitcoin, altcoins, stablecoins FAQs
Bitcoin is the largest cryptocurrency by market capitalization, a virtual currency designed to serve as money. This form of payment cannot be controlled by any one person, group, or entity, which eliminates the need for third-party participation during financial transactions.
Altcoins are any cryptocurrency apart from Bitcoin, but some also regard Ethereum as a non-altcoin because it is from these two cryptocurrencies that forking happens. If this is true, then Litecoin is the first altcoin, forked from the Bitcoin protocol and, therefore, an “improved” version of it.
Stablecoins are cryptocurrencies designed to have a stable price, with their value backed by a reserve of the asset it represents. To achieve this, the value of any one stablecoin is pegged to a commodity or financial instrument, such as the US Dollar (USD), with its supply regulated by an algorithm or demand. The main goal of stablecoins is to provide an on/off-ramp for investors willing to trade and invest in cryptocurrencies. Stablecoins also allow investors to store value since cryptocurrencies, in general, are subject to volatility.
Bitcoin dominance is the ratio of Bitcoin's market capitalization to the total market capitalization of all cryptocurrencies combined. It provides a clear picture of Bitcoin’s interest among investors. A high BTC dominance typically happens before and during a bull run, in which investors resort to investing in relatively stable and high market capitalization cryptocurrency like Bitcoin. A drop in BTC dominance usually means that investors are moving their capital and/or profits to altcoins in a quest for higher returns, which usually triggers an explosion of altcoin rallies.
추천 기사


