


Storj Price Forecast: Bulls aiming for double-digit gains
- Storj price is extending its gains on Tuesday after rallying 5% the previous day.
- On-chain metrics paint a bullish picture as STORJ’s open interest and daily trading volume are rising.
- A daily candlestick close below $0.33 would invalidate the bullish thesis.
Storj (STORJ), an open-source platform that leverages the blockchain to provide end-to-end encrypted cloud storage services, continues to trade higher by 4.4%, around $0.39 on Tuesday after rallying 5% the previous day. On-chain metrics further support the recent price rally as STORJ’s open interest and daily trading volume are rising. The technical outlook suggested a rally continuation, targeting double-digit gains ahead.
Storj price action suggests rally continuation
Storj price trades inside a descending trendline (drawn by connecting multiple highs since early December). On Monday, STORJ’s price faced rejection from the descending trendline after reaching a high of $0.47 and gaining 5%. At the time of writing on Tuesday, it continues to trade higher by 4.4%, around $0.39.
If Storj continues its upward momentum, it could extend the rally by 18% from its current level to retest its weekly resistance level at $0.46. A successful close above this level would extend an additional gain by 35% to reach its January 6 high of $0.62.
The Relative Strength Index (RSI) on the daily chart reads 53, above its neutral level of 50 and points upwards, indicating bullish momentum. Moreover, the Moving Average Convergence Divergence (MACD) also showed a bullish crossover last week, giving buy signals and an upward trend.
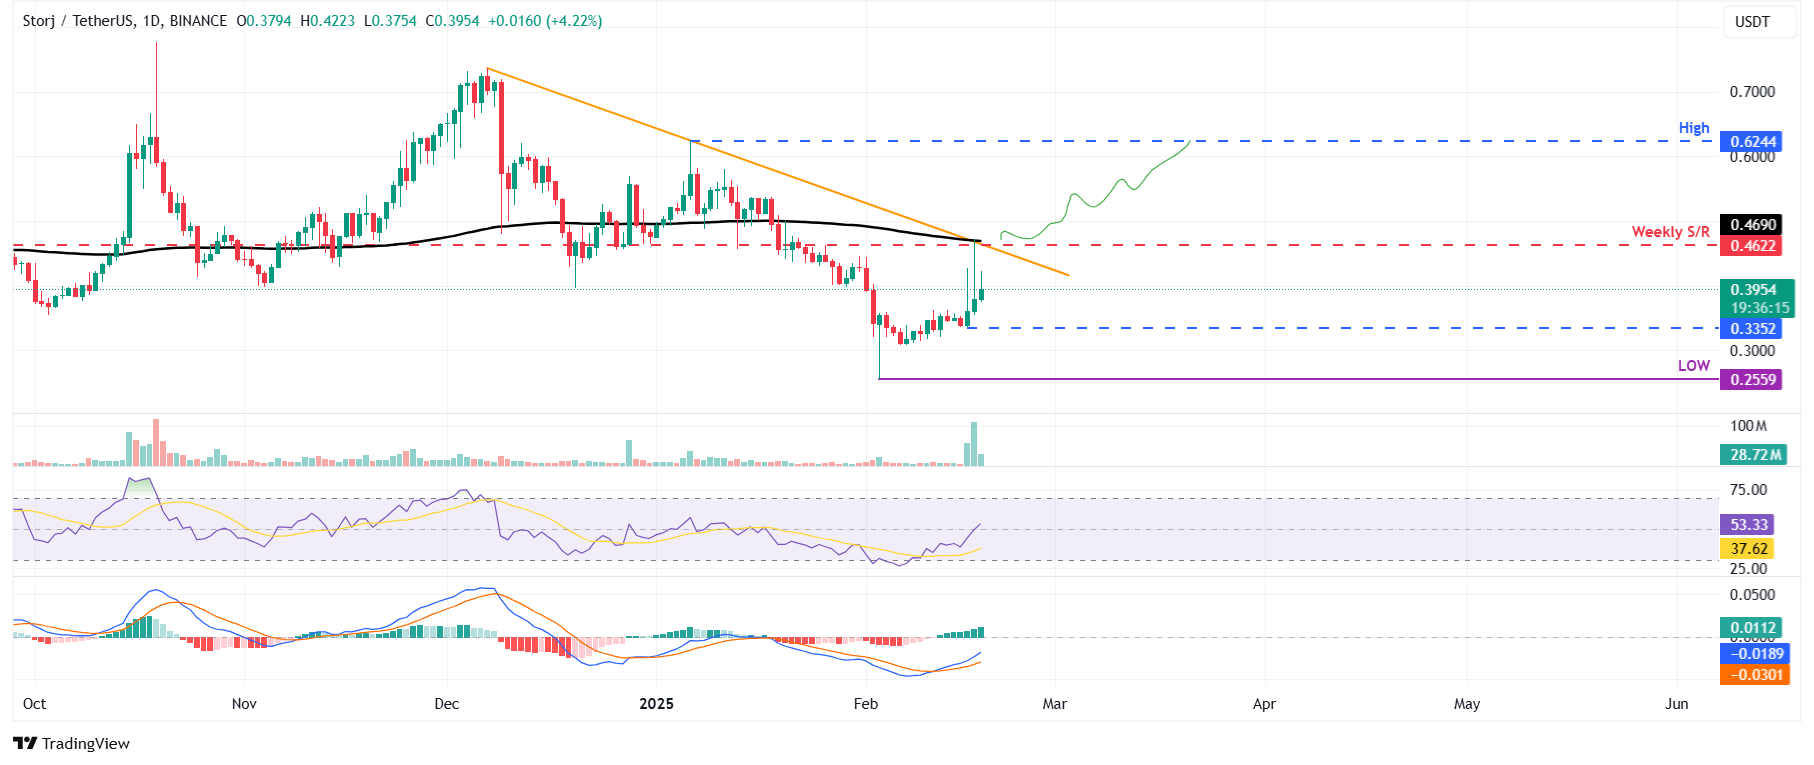
STORJ/USDT daily chart
STORJ’s Open Interest (OI) further supports the bullish outlook. Coinglass’s data shows that the futures’ OI in Storj at exchanges rose from $13.32 million on Sunday to $43.70 million on Tuesday, the highest level since October 22, 2024. An increasing OI represents new or additional money entering the market and new buying, which suggests a rally ahead in the STORJ price.
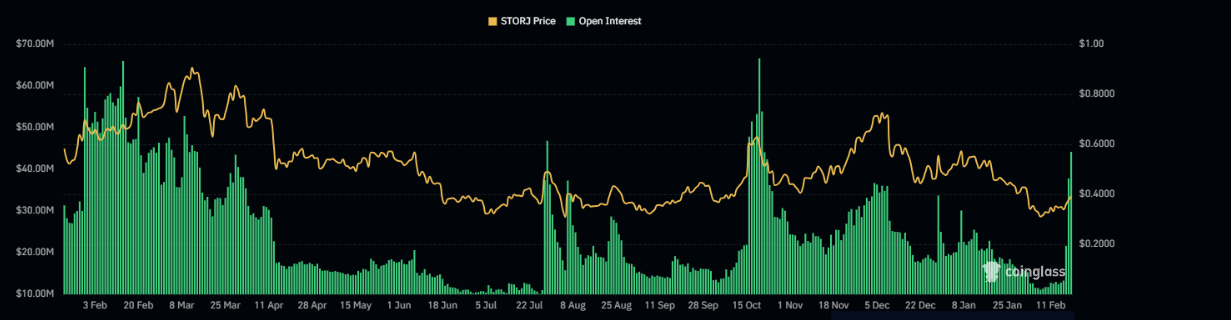
STORJ open interest chart. Source: Coinglass
Another aspect bolstering the platform’s bullish outlook is a recent surge in traders’ interest and liquidity in the STORJ network. Santiment data shows that Storj’s trading volume rose from $10.52 million on Saturday to $387.48 million on Tuesday, the highest since mid-October.
 [09.16.25, 18 Feb, 2025]-638754510424641355.png)
Storj Volume chart. Source: Santiment
However, if Storj’s daily candlestick closes below $0.33, the bullish thesis would be invalidated, which leads to a downward movement to retest its February 3 low of $0.25.
추천 기사


