


Ethereum Price Forecast: ETH bounces back after week-long bearish pressure
Ethereum price today: $3,330
- Ethereum exchange reserve has risen by over 434,000 ETH in the past nine days following increased negative sentiment.
- ETH's futures open interest remained fairly stable, indicating the market sentiment didn't move derivatives traders.
- Ethereum's 20% rally is restricted by a symmetrical triangle resistance and a $3,550 hurdle.
Ethereum (ETH) is up 4% on Friday as it looks to bounce back from week-long bearish pressure that saw investors depositing over 434,000 ETH in exchanges. With the recent recovery and derivatives traders holding their positions firm, ETH could complete a 20% rally if it overcomes a symmetrical triangle resistance.
Ethereum on-chain metrics reveal impact of ETH's bearish sentiment
Ethereum faced one of its highest negative sentiment volumes in the past few days.
Community members blasted the Ethereum Foundation's leadership and criticized its priorities following Solana's rally upon hosting the TRUMP meme coin. The criticism potentially saw investors jumping ship into other assets, as evidenced by key trends in ETH's on-chain metrics:
Ethereum exchange reserve, which measures the total amount of ETH on exchanges, increased by over 434,000 ETH in the past nine days, following the high negative sentiment surrounding the top altcoin. An increase in the amount of coins held in exchanges indicates higher selling pressure.
-638733501336284262.png)
ETH Exchange Reserve. Source: CryptoQuant
A similar trend is evident in ETH's total value staked, which declined to a six-month low of 34.15 million ETH. A decline in total value staked signifies investors are not opting to hold ETH over the long term and could quickly sell off their assets during periods of high volatility.
-638733501829902003.png)
ETH Total Value Staked. Source: CryptoQuant
Notably, the bearish pressure that saw ETH briefly decline below $3,200 came from both short-term and long-term holders considering the Dormant Circulation across both cohorts saw a slight uptick. Dormant Circulation measures the amount of coins within specific age cohorts that switched addresses.
 [22.00.55, 24 Jan, 2025]-638733502256512162.png)
ETH Dormant Circulation. Source: Santiment
However, periods of high negative sentiment for top crypto assets have often coincided with a price bottom. This could partly explain why ETH has quickly recovered and risen above the $3,300 level in the past 24 hours.
On the other hand, Ethereum's futures open interest saw a slight increase in the past two days, reaching an all-time high of 9.50 million ETH on Friday.
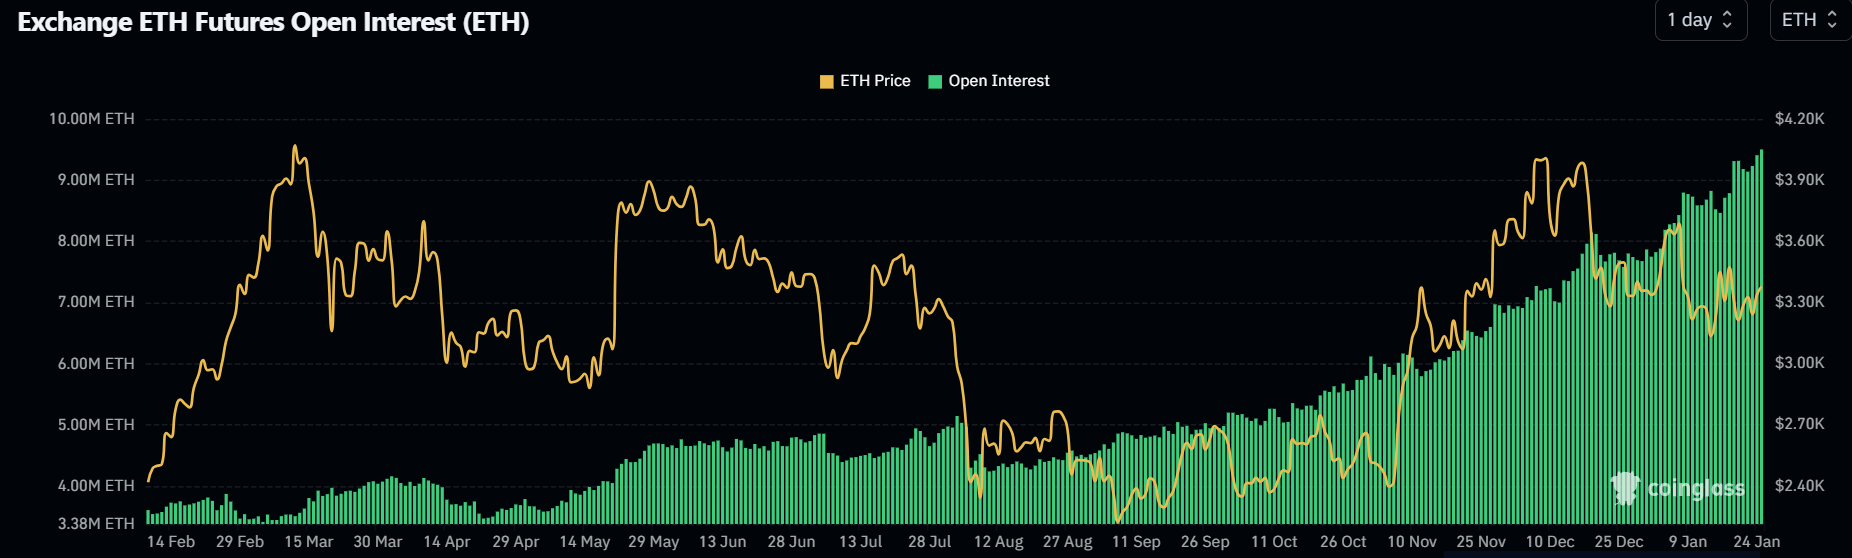
Ethereum Open Interest. Source: Coinglass
Open interest is the total amount of unsettled contracts in a derivatives market.
Despite the negativity surrounding ETH, its open interest was fairly stable, indicating derivatives traders maintained their positions.
Meanwhile, Ethereum exchange-traded funds (ETFs) ended their six-day inflow streak after recording net outflows of $14.90 million on Thursday, per Coinglass data.
Ethereum Price Forecast: ETH eyes move above symmetrical triangle and $3,550 resistance
Ethereum experienced $35.24 million in liquidations in the past 24 hours, per Coinglass data. The total amount of liquidated long and short positions accounted for $13.95 and $21.29 million, respectively.
On the 8-hour chart, Ethereum bounced off a symmetrical triangle's lower boundary support line. Notably, ETH has struggled near the 200-day and 50-day Simple Moving Averages (SMAs) in the past nine days before seeing a 4% rise on Friday.
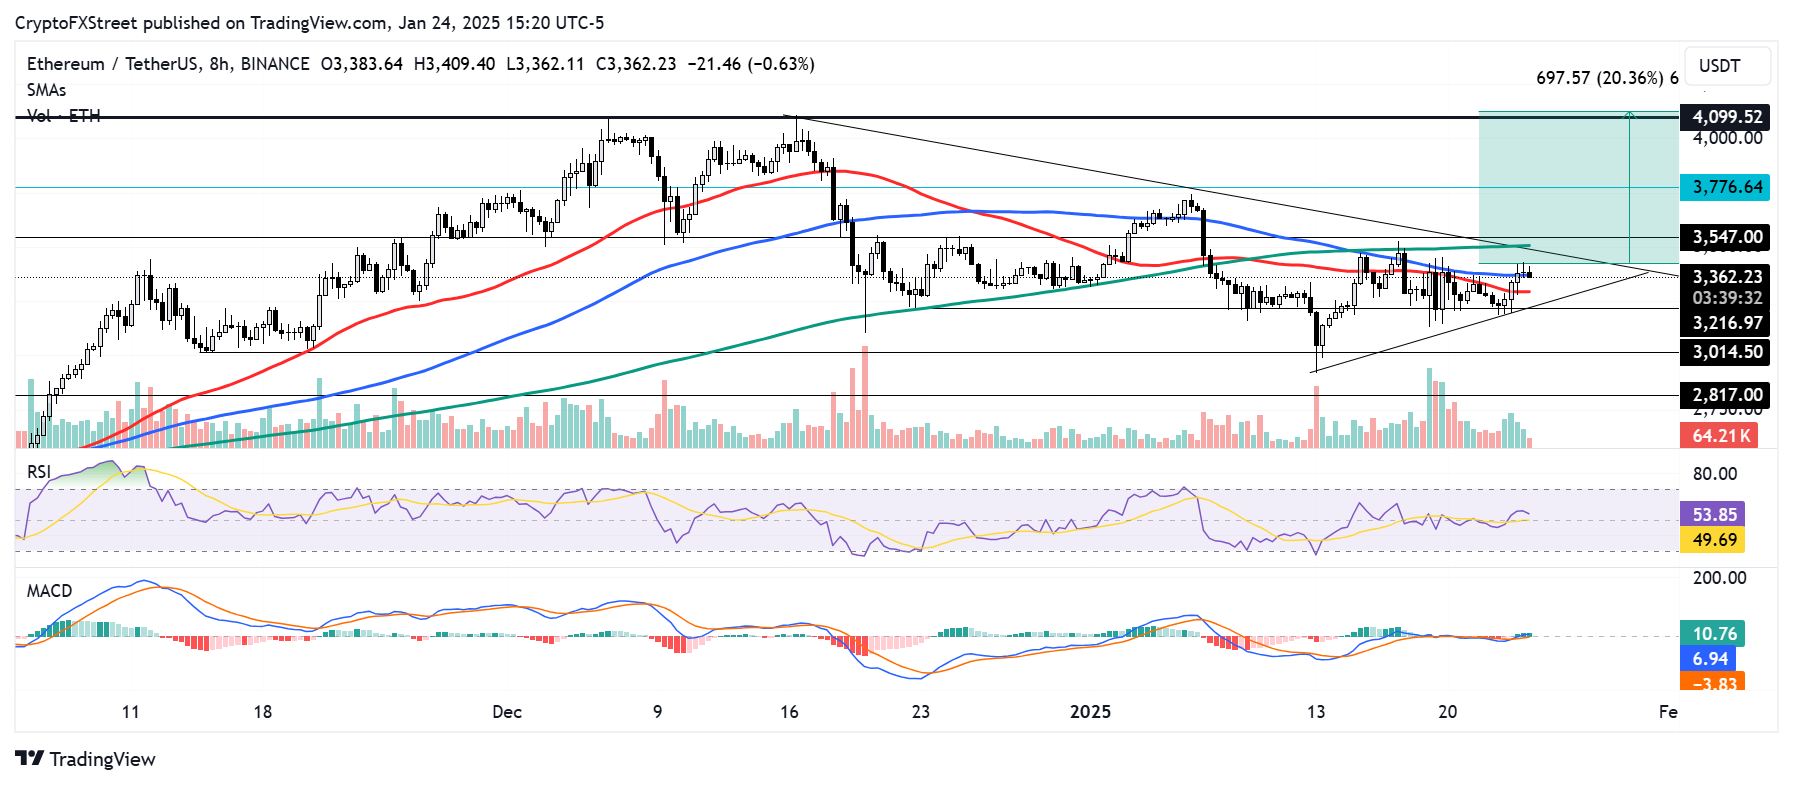
ETH/USDT 8-hour chart
On the upside, ETH faces the upper boundary resistance of a symmetrical triangle — strengthened by the 100-day SMA. If ETH clears this hurdle and flips the $3,550 resistance to a support level, it could rally nearly 20% to tackle the $4,100 critical resistance.
On the downside, ETH could find support near the $3,000 psychological level if it declines below the triangle's lower boundary support line. A sustained move below $3,000 will validate a Head-and-Shoulders (H&S) pattern that could spark a mega-bearish trend for ETH.
The Relative Strength Index (RSI) and Moving Average Convergence Divergence (MACD) are above their neutral levels, indicating rising bullish pressure.
Ethereum FAQs
Ethereum is a decentralized open-source blockchain with smart contracts functionality. Its native currency Ether (ETH), is the second-largest cryptocurrency and number one altcoin by market capitalization. The Ethereum network is tailored for building crypto solutions like decentralized finance (DeFi), GameFi, non-fungible tokens (NFTs), decentralized autonomous organizations (DAOs), etc.
Ethereum is a public decentralized blockchain technology, where developers can build and deploy applications that function without the need for a central authority. To make this easier, the network leverages the Solidity programming language and Ethereum virtual machine which helps developers create and launch applications with smart contract functionality.
Smart contracts are publicly verifiable codes that automates agreements between two or more parties. Basically, these codes self-execute encoded actions when predetermined conditions are met.
Staking is a process of earning yield on your idle crypto assets by locking them in a crypto protocol for a specified duration as a means of contributing to its security. Ethereum transitioned from a Proof-of-Work (PoW) to a Proof-of-Stake (PoS) consensus mechanism on September 15, 2022, in an event christened “The Merge.” The Merge was a key part of Ethereum's roadmap to achieve high-level scalability, decentralization and security while remaining sustainable. Unlike PoW, which requires the use of expensive hardware, PoS reduces the barrier of entry for validators by leveraging the use of crypto tokens as the core foundation of its consensus process.
Gas is the unit for measuring transaction fees that users pay for conducting transactions on Ethereum. During periods of network congestion, gas can be extremely high, causing validators to prioritize transactions based on their fees.
추천 기사


