


Bitcoin Weekly Forecast: Long-awaited $100K milestone meets profit taking
- Bitcoin price hovers around $98,000 at the end of a week in which it surpassed the $100K milestone to correct sharply afterward.
- BTC institutional demand and whale accumulation remain strong, supporting Bitcoin’s rally.
- Traders should be cautious due to the move of funds from Mt.Gox, US government transfers, and holders booking profits.
Bitcoin (BTC) ends the working week hovering around $98,000 after a very volatile Thursday when it surpassed the $100K milestone and underwent a sharp correction. Strong institutional demand, whale accumulation, and the choice of a pro-crypto figure to lead the US Securities and Exchange Commission (SEC) fueled the rally this week.
However, traders should be cautious about a possible correction ahead as on-chain data shows holders booking profits at the top. Moreover, any moves from Mt.Gox funds and US government transfers could add to the selling pressure.
Bitcoin institutional demand, whale accumulation remain strong
Bitcoin surged past the $100K milestone on Thursday, reaching a peak of $104,088 before experiencing a sharp drop to $90,500. It ultimately recovered to close above $96,900. As of Friday, it is trading slightly above $98,000.
This week, institutional demand supported Bitcoin’s rally. According to Coinglass, Bitcoin Spot Exchange Traded Funds (ETF) data saw an inflow totaling $2.4 billion until Thursday, compared to a $136.5 million outflow last week. If this inflow trend persists or accelerates, it could provide additional momentum to the ongoing Bitcoin price rally.
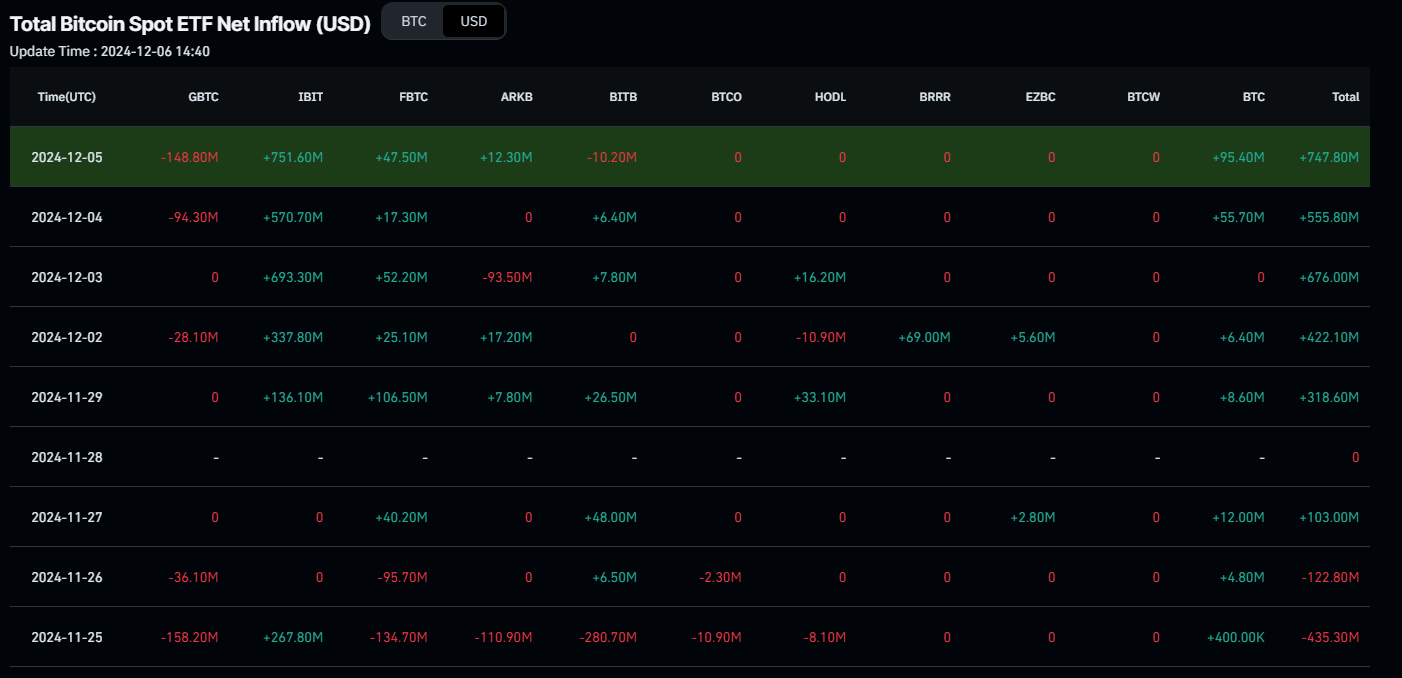
Total Bitcoin Spot ETF Inflow chart. Source: Coinglass
Bitcoin mining company MARA Holdings has added more BTC this week. According to data from the crypto intelligence tracker Arkham, MARA holdings increased from 17,000 BTC on Monday to 22,000 BTC on Friday, bringing its total holding to an amount worth $2.17 billion.
The potential incorporation of Bitcoin as a reserve asset by firms like MARA is good news for Bitcoin as it shows increasing adoption from big players.
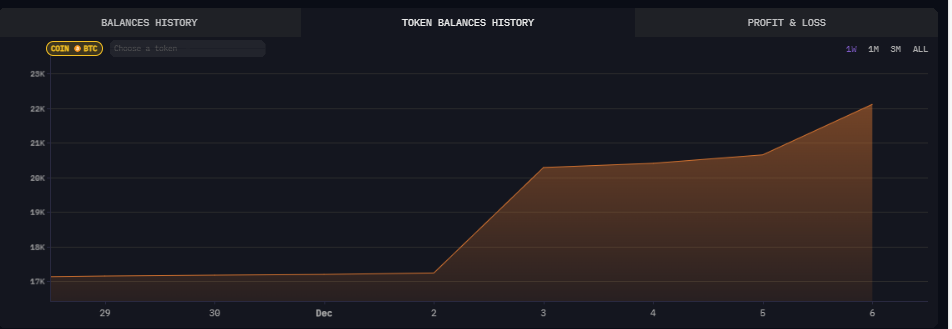
MARA BTC holdings chart. Source: Arkham
As Bitcoin dropped from $100K on Thursday, a whale seized the opportunity and bought 600 BTC worth $58.85 million, according to Lookonchain data. Over the past two weeks, this whale has accumulated 1,300 BTC, worth $127 million.
After $BTC dropped from $100,000, a whale seized the opportunity and bought 600 $BTC($58.85M)!
— Lookonchain (@lookonchain) December 6, 2024
Over the past 2 weeks, this whale has accumulated a total of 1,300 $BTC($127M).https://t.co/Ihi2UaKgpP pic.twitter.com/uhwYTpFCdm
More optimistic signs for Bitcoin
Multiple optimistic news and events have supported BTC’s rise towards the $100K milestone this week. Starting with Michael Saylor, co-founder of MicroStrategy, who delivered a presentation to Microsoft’s board on why the tech giant should buy Bitcoin.
“Microsoft can’t afford to miss the next technology wave, and Bitcoin is that wave,” Saylor said.
Microsoft’s shareholders are scheduled to vote on a proposal to add BTC to its balance sheet on December 10, according to a report from QCP Capital. “If the proposal passes, it would be bullish not only for BTC but also for their other investments,” the report notes.
Wednesday’s announcement of who would be the new chair of the US SEC added more bullish momentum to Bitcoin. President-elect Donald Trump confirmed that he had nominated Paul Atkins, CEO of Patomak Global Partners, to take the role. This announcement positively impacted the market as Atkins is considered pro-crypto.
On the same day, Bitcoin also got the endorsement of another prominent figure: Vladimir Putin.
“Who can ban Bitcoin? Nobody. And who can prohibit the use of other electronic means of payment? Nobody,” the Russian President said on Wednesday at an investment forum in Moscow, according to a Watcher.Guru Twitter post.
Some bearish signs to watch for
After BTC rallied above the $100K mark this week, the COO of Bitget Wallet, Alvin Kan, told FXStreet that he expects a “healthy correction” shortly.
“As market volatility could continue to increase, users should be cautious about leverage in futures contracts to avoid liquidation risks from sudden downturns. After the correction, it’s important to focus on sector rotation, as altcoin seasons are likely to continue,” Kan said.
Profit-taking is another short-term risk for Bitcoin price after the recent rally. Santiment’s Network Realized Profit/Loss (NPL) indicator suggests holders book profits at the top. BTC’s NPL metric spiked on Thursday, indicating that holders are, on average, selling their bags at a significant profit. A similar spike was seen on November 21, which led to a correction of over 7% in the next five days. If history repeats, BTC could see a similar fall in the short term.
 [17.40.10, 06 Dec, 2024]-638690869555691533.png)
BTC NPL chart. Source: Santiment
According to data from crypto intelligence tracker Arkham, a wallet related to the US government, moved on Monday 10K BTC worth $962.88 million from the Silk Road seized address to Coinbase Prime. On Tuesday, the US government wallet carried out a similar move, which moved many altcoins like Ethereum, Compound, Axie Infinity, and others worth $33.59 million into new wallets.
Moreover, as BTC prices rose to six figures on Thursday, defunct exchange Mt.Gox transferred 24,052 BTC worth $2.43 billion to a new wallet, according to Lookonchain data. Similarly, on Friday, the Mt. Gox wallet transferred 3,620 BTC worth $352.69 million to two new wallets.
If any of the above wallets intend to sell or distribute these coins, they can create bearish sentiment as market participants anticipate increased supply.
20 minutes ago, #MtGox transferred 3,620 $BTC($352.69M) to 2 new wallets.https://t.co/4gzbLEeR5a pic.twitter.com/1s0m2K7LHE
— Lookonchain (@lookonchain) December 6, 2024
Technical outlook: BTC rise toward $120K or a drop to $85K?
Bitcoin price broke above the $100K milestone, reaching a high of $104,088, then fell sharply to make a daily low of $90,500 but recovered and closed above $96,900 on Thursday. At the time of writing on Friday, it hovers around $98,000.
Despite the recovery from Thursday’s fall, Bitcoin’s Relative Strength Index (RSI) flashes warning signs. The higher high formed on Thursday does not reflect the RSI chart for the same period, indicating a formation of a bearish divergence, which often leads to a short-term correction.
If this bearish divergence plays out, traders could expect a small rise towards the recent high of $104,088 (grabbing liquidity or trapping longs), to then fall sharply towards the $90,000 support level. A successful close below this level could extend an additional decline towards the next support level of $85,000.
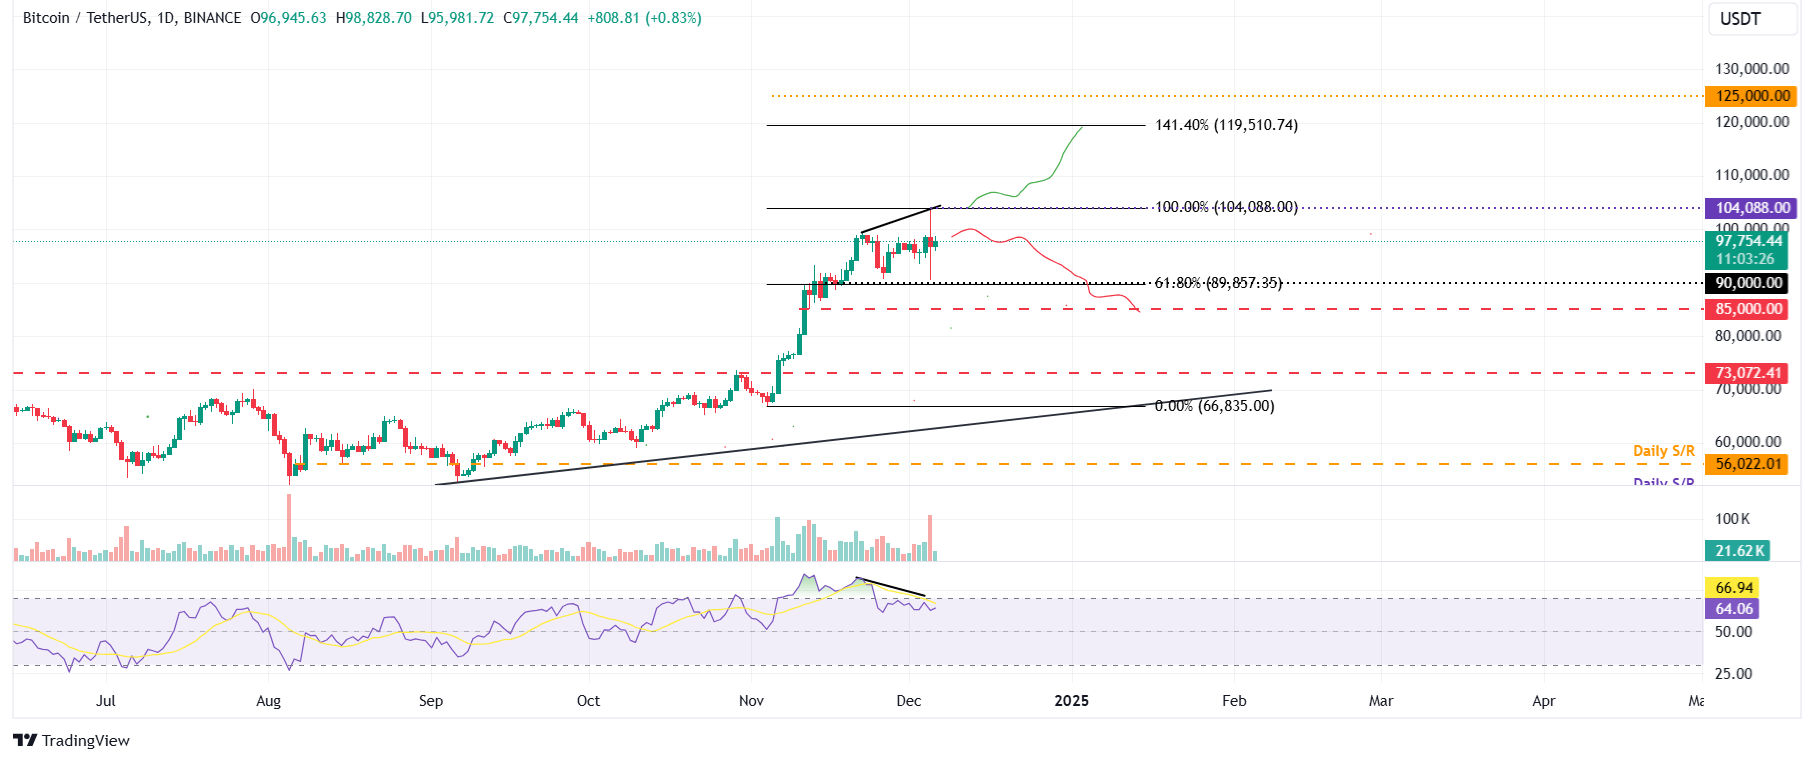
BTC/USDT daily chart
Conversely, if BTC continues its uptrend and closes above $104,088, it could extend the rally towards the new all-time high of $119,510, a level that aligns with the 141.4% Fibonacci extension line drawn from the November 4 low of $66,835 to Thursday’s all-time high of $104,088.
Bitcoin, altcoins, stablecoins FAQs
Bitcoin is the largest cryptocurrency by market capitalization, a virtual currency designed to serve as money. This form of payment cannot be controlled by any one person, group, or entity, which eliminates the need for third-party participation during financial transactions.
Altcoins are any cryptocurrency apart from Bitcoin, but some also regard Ethereum as a non-altcoin because it is from these two cryptocurrencies that forking happens. If this is true, then Litecoin is the first altcoin, forked from the Bitcoin protocol and, therefore, an “improved” version of it.
Stablecoins are cryptocurrencies designed to have a stable price, with their value backed by a reserve of the asset it represents. To achieve this, the value of any one stablecoin is pegged to a commodity or financial instrument, such as the US Dollar (USD), with its supply regulated by an algorithm or demand. The main goal of stablecoins is to provide an on/off-ramp for investors willing to trade and invest in cryptocurrencies. Stablecoins also allow investors to store value since cryptocurrencies, in general, are subject to volatility.
Bitcoin dominance is the ratio of Bitcoin's market capitalization to the total market capitalization of all cryptocurrencies combined. It provides a clear picture of Bitcoin’s interest among investors. A high BTC dominance typically happens before and during a bull run, in which investors resort to investing in relatively stable and high market capitalization cryptocurrency like Bitcoin. A drop in BTC dominance usually means that investors are moving their capital and/or profits to altcoins in a quest for higher returns, which usually triggers an explosion of altcoin rallies.
추천 기사


