


Why Ethereum could break all-time high after Bitcoin's rally to $104,000
- Ethereum rallied nearly 20% against Bitcoin in the past two weeks.
- Ethereum supply held by whales climbed nearly 7% in the same timeframe.
- As Bitcoin hits $104,000 and traders take profits, capital rotation signals a potential altcoin season.
Ethereum (ETH) is hovering close to the $4,000 level early on Thursday. The second-largest cryptocurrency is gearing to test its 2021 peak at $4,868. Technical indicators support a bullish thesis for Ethereum.
Ethereum and altcoins in the top 50 rallied alongside Bitcoin (BTC) as the cryptocurrency hit the $100,000 milestone and climbed to an all-time high above $104,000.
On-chain indicators signal increased Ethereum accumulation by whales and a decline in exchange supply, both conducive for further gains in ETH.
Ethereum marches against Bitcoin, gains 20% in two weeks
Ethereum gained nearly 20% against Bitcoin in the past two weeks, as seen in the ETH/BTC price chart on Tradingview. Even as Bitcoin breaks the $100,000 milestone and extends its rally, Ethereum covers ground against the largest cryptocurrency.
The ETH/BTC pair faces resistance at 0.04382 and the August 2024 peak of 0.05019. Traders should keep their eyes peeled for further gains in Ethereum in the short term.
Technical indicators Relative Strength Index (RSI) and Moving Average Convergence Divergence (MACD) support the bullish thesis. RSI is sloping upward, with no sign of divergence, and reads 57.
MACD flashes green histogram bars above the neutral line, consistent with underlying positive momentum in ETH price trend.
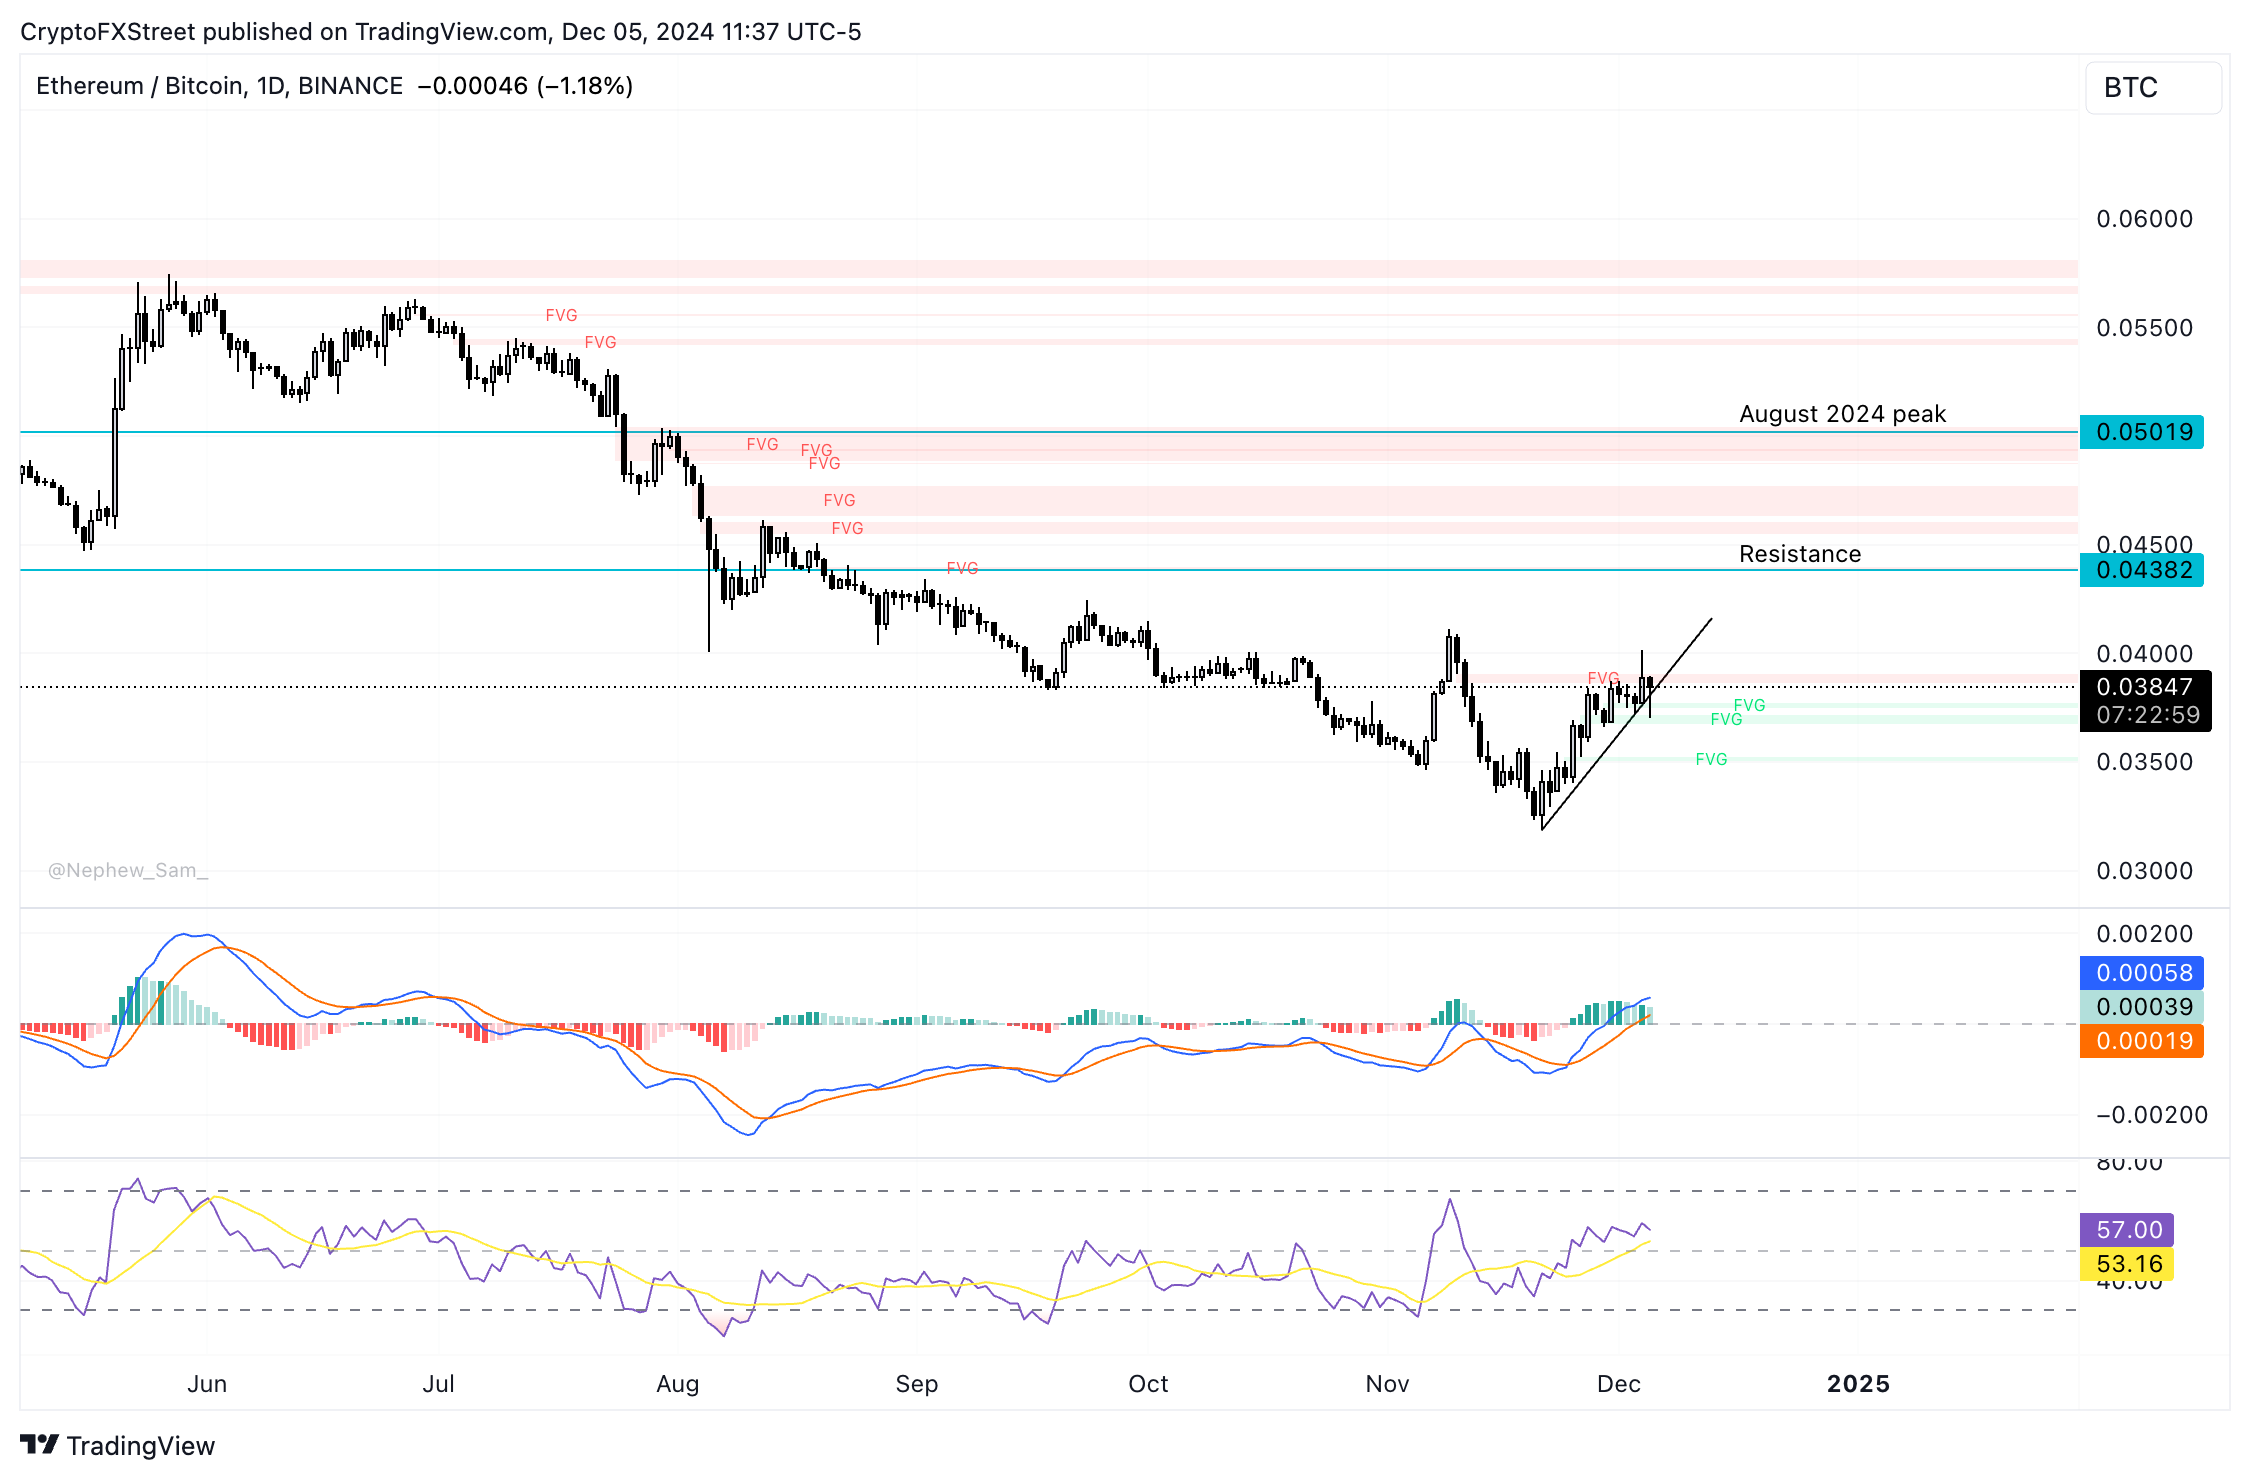
ETH/BTC daily price chart
If Ethereum fails to close above 0.03907, it could invalidate the bullish thesis. A correction in the pair could send ETH to collect liquidity in the Fair Value Gap (FVG) between 0.03054 and 0.03524.
Ethereum supply held by whales rises with a decline in exchange reserves
Santiment data shows that whales added nearly 7% ETH tokens to their holdings (exchange wallets are excluded) in the past two weeks. In the past week, exchange reserves dipped a 2% decline from the November 28 peak of 10.79 million to 10.57 million on Thursday.
When whales increase their holdings of a token it is typically considered a bullish sign, large wallet investors likely anticipate gains in the token. Dwindling exchange reserves are correlated with reduced selling pressure and support the price gain thesis for a token.
 [19.00.39, 05 Dec, 2024]-638690160590412029.png)
Ethereum supply held by whales vs. price | Source: Santiment
 [22.17.02, 05 Dec, 2024]-638690160837967183.png)
Ethereum supply on exchanges vs. price | Source: Santiment
Ethereum price prediction
Ethereum climbed to a peak of $3,956, inching closer to the $4,000 level, a key psychological barrier for ETH. The altcoin’s previous all-time high is $4,888 and Ethereum is currently trading nearly 25% below the 2021 peak.
Technical indicators RSI and MACD support Ethereum gains with RSI sloping upward, reading 65, and MACD signaling underlying positive momentum in ETH price trend.
If Ethereum successfully breaks $4,000, it faces a resistance zone where traders could take profits and likely usher a correction in ETH price.
IntoTheBlock data shows that 1.23 million wallet addresses bought 434,130 Ether between $4,030 and $4,145. The In/Out of the Money (IOMAP) metric is used to identify resistance zones where a large count of addresses bought the token, useful in predicting price movement.
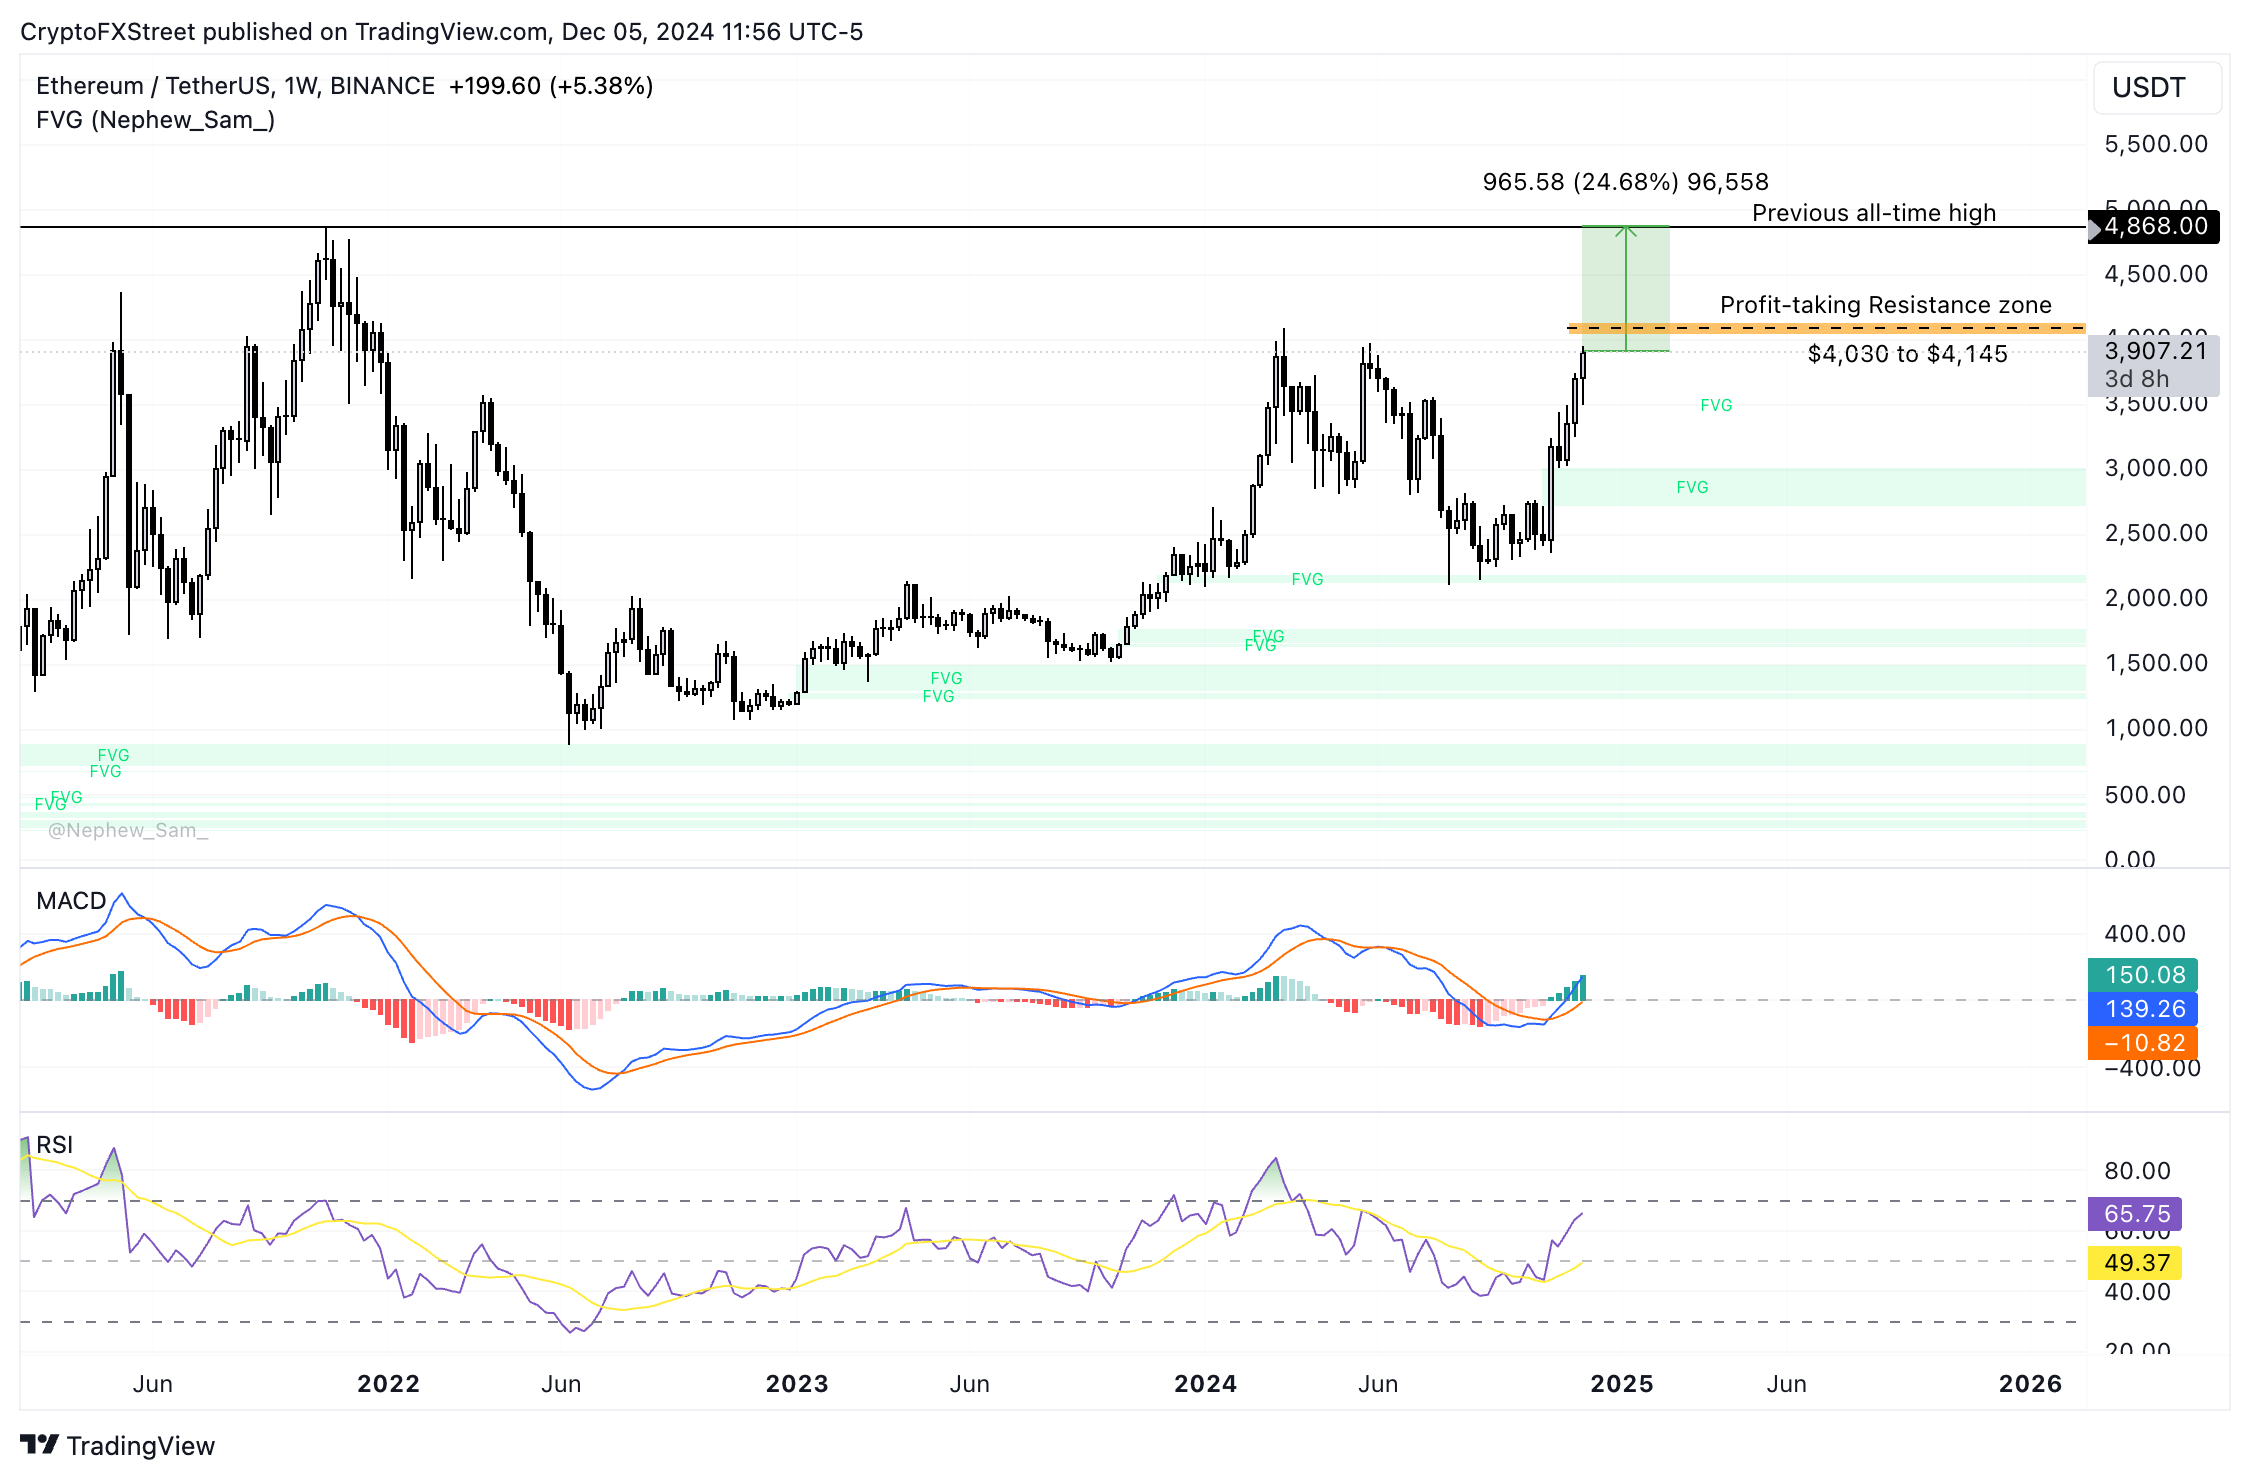
ETH/USDT daily price chart
If Ethereum corrects, the altcoin could find support at $3,500 and further decline could push ETH to the imbalance zone between $2,722 and $3,014.
Traders should note that the correlation between Ethereum and Bitcoin is 0.81 as of December 5, according to data from Macroaxis.com. If Bitcoin price trend reverses, it could negatively impact Ethereum and the top 50 altcoins and result in a correction in the short term.
추천 기사


