

Bitcoin Price Forecast: Rally stalls as traders opt to take profits
Bitcoin price today: $72,400
- Bitcoin price hovers around $72,000 amid increasing signs of profit-taking.
- US spot Bitcoin ETFs posted almost $900 million in inflows on Wednesday, the second-largest single-day volume since their launch in January.
- MicroStrategy announced its plans to raise $42 billion of capital to acquire more Bitcoin.
Bitcoin (BTC) trades broadly stable around $72,000 on Thursday after a four-day rally. However, institutional demand remains robust, as evidenced by the over $896 million in inflows into US spot Bitcoin ETFs on Wednesday. Business intelligence firm MicroStrategy revealed plans to raise $42 billion to acquire more Bitcoin. Nevertheless, traders should exercise caution, as Santiment data indicates that some are taking profits following the recent rally.
Bitcoin sees strong institutional demand as BlackRock fund takes the lead
Institutional demand rises despite the slight decline in prices seen on Wednesday. Coinglass ETF data shows that US spot Exchange Traded Funds (ETFs) saw an inflow of $896.30 million, the second-largest single-day inflow. The BlackRock ETF (IBIT) contributed $875 million in inflows in the same period. If this trend continues, it could further fuel the ongoing Bitcoin price rally.
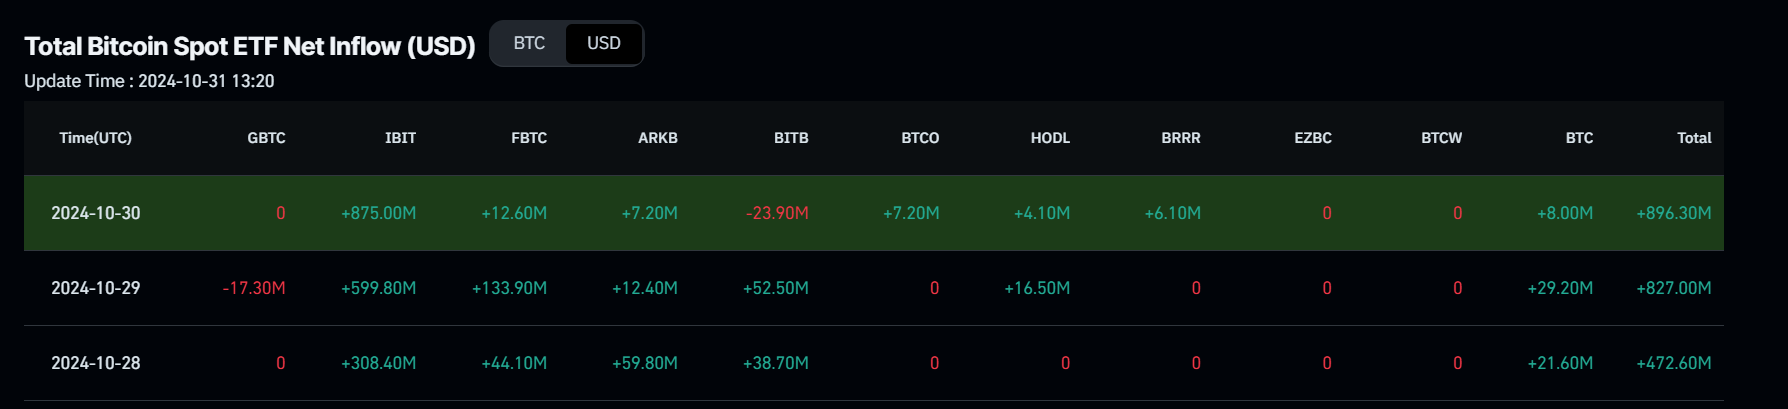
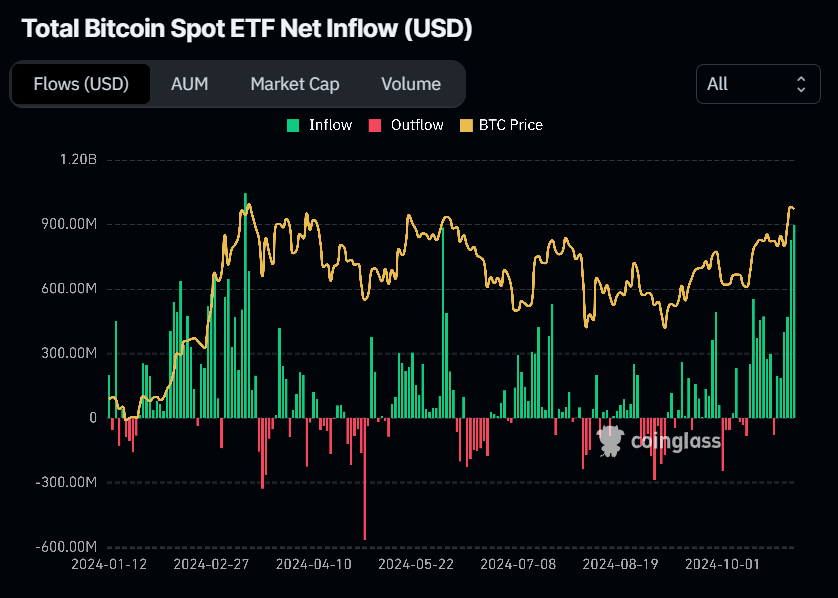
Total Bitcoin Spot ETF Net Inflow chart. Source: Coinglass
On Wednesday, Business intelligence firm MicroStrategy announced a $42 billion capital plan, including a $21 billion ATM equity offering and a target of raising $21 billion in fixed-income securities in its financial results for the three-month period ended September 30.
MicroStrategy announces $42 billion capital plan including $21 billion ATM equity offering and a target of raising $21 billion in fixed-income securities. Join us at 5pm ET as we discuss our quarterly results and #Bitcoin Treasury Company plans. $MSTR https://t.co/eXYELbN1Dm
— Michael Saylor⚡️ (@saylor) October 30, 2024
“As a Bitcoin Treasury Company, we plan to use the additional capital to buy more bitcoin as a treasury reserve asset in a manner that will allow us to achieve higher BTC Yield,” said Phong Le, President and Chief Executive Officer (CEO) of MicroStrategy.
“The company continues to show an increased desire to become the leading treasury firm for Bitcoin, as it is currently the largest corporate holder of the digital asset.”, says Michael Ebiekutan, an analyst at FXStreet.
Despite rising institutional demand and MicroStrategy’s plan for capital injection in Bitcoin, traders should be cautious as some holders have recently opted to book profits in Bitcoin. The Santiment’s Network Realized Profit/Loss (NPL) indicator showed a positive spike on Tuesday, as the metric rose from 590.2 million to 1.39 billion from Monday to Tuesday. This spike indicates that the holders were, on average, taking profits, a move that could increase the selling pressure.
 [14.36.53, 31 Oct, 2024]-638659708075425655.png)
Bitcoin Network Realized Profit/Loss chart. Source: Santiment
Additionally, the movement of funds by the Government of Bhutan to centralized exchanges should also be monitored; if sold, it could increase the selling pressure.
Bitcoin Price Forecast: Hovers around $72,000
Bitcoin price consolidates after rallying over 4% on Tuesday, reaching a daily high of $73,620. At the time of writing on Thursday, it trades slightly above around $72,400.
If BTC sustains its upward momentum, it could soon approach its next critical resistance at $73,777, the all-time high from mid-March. A successful close above this level may set the stage for a rally toward the 141.40% Fibonacci extension level of $78,777 (calculated from July’s high of $70,079 to August’s low of $49,072).
The Relative Strength Index (RSI) on the daily chart is currently at an overbought level of 70 and trending downward, signaling a potential weakening of bullish momentum. If the RSI declines from these overbought conditions, the likelihood of a deeper price pullback may rise, while an alternative scenario could see the rally persist, pushing the RSI even higher into overbought territory.
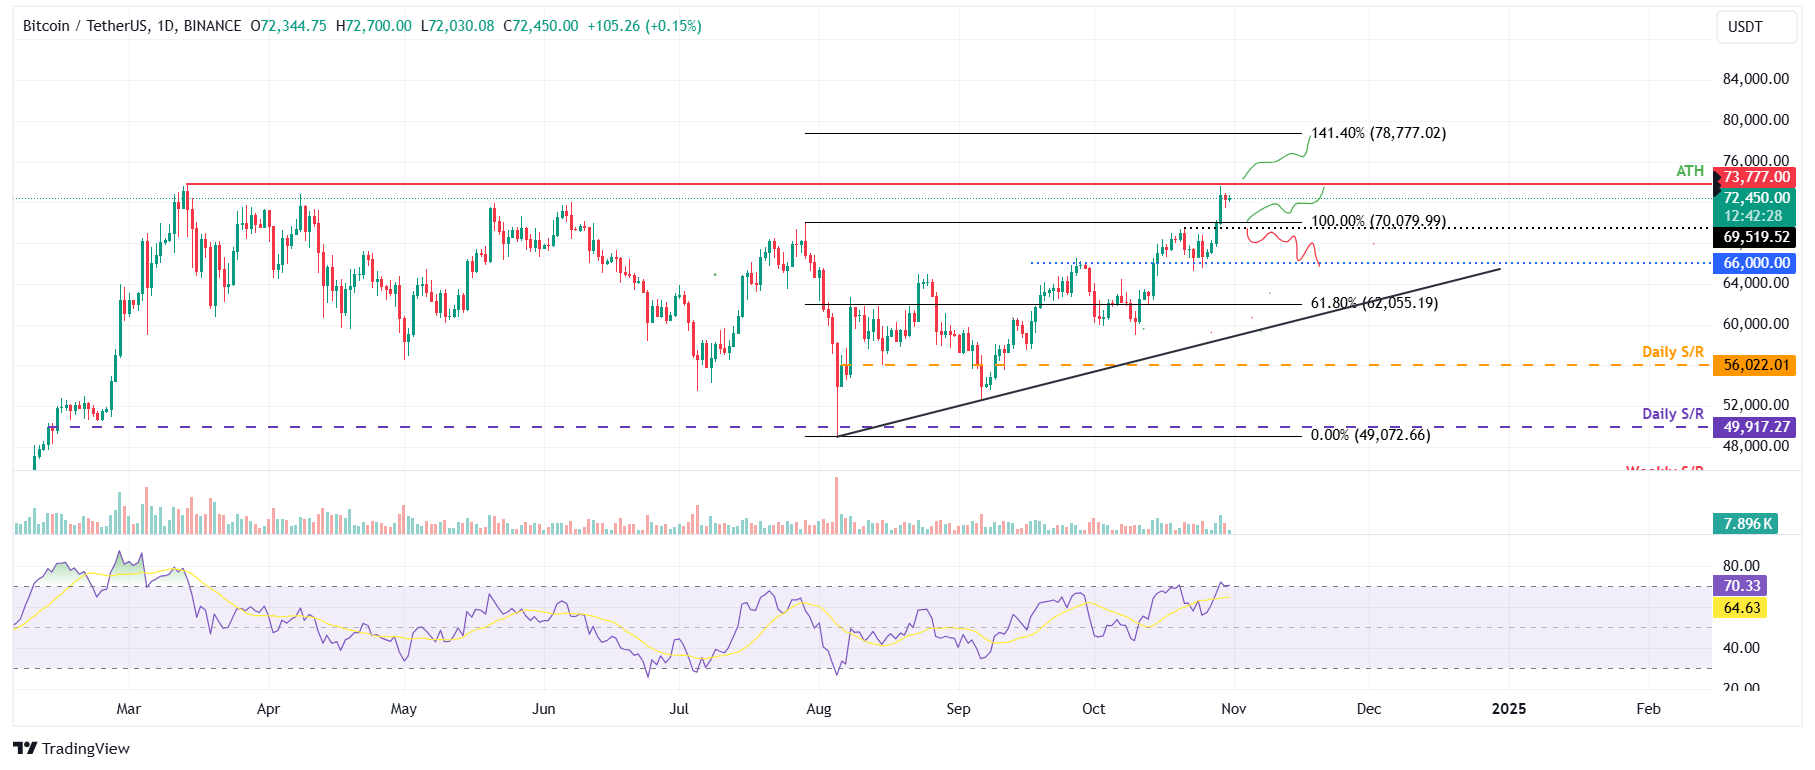
BTC/USDT daily chart
On the other hand, if BTC falls and closes below its psychologically important level of $70,000, it could decline by an additional 5.7% and retest its next support at $66,000.
Bitcoin, altcoins, stablecoins FAQs
Bitcoin is the largest cryptocurrency by market capitalization, a virtual currency designed to serve as money. This form of payment cannot be controlled by any one person, group, or entity, which eliminates the need for third-party participation during financial transactions.
Altcoins are any cryptocurrency apart from Bitcoin, but some also regard Ethereum as a non-altcoin because it is from these two cryptocurrencies that forking happens. If this is true, then Litecoin is the first altcoin, forked from the Bitcoin protocol and, therefore, an “improved” version of it.
Stablecoins are cryptocurrencies designed to have a stable price, with their value backed by a reserve of the asset it represents. To achieve this, the value of any one stablecoin is pegged to a commodity or financial instrument, such as the US Dollar (USD), with its supply regulated by an algorithm or demand. The main goal of stablecoins is to provide an on/off-ramp for investors willing to trade and invest in cryptocurrencies. Stablecoins also allow investors to store value since cryptocurrencies, in general, are subject to volatility.
Bitcoin dominance is the ratio of Bitcoin's market capitalization to the total market capitalization of all cryptocurrencies combined. It provides a clear picture of Bitcoin’s interest among investors. A high BTC dominance typically happens before and during a bull run, in which investors resort to investing in relatively stable and high market capitalization cryptocurrency like Bitcoin. A drop in BTC dominance usually means that investors are moving their capital and/or profits to altcoins in a quest for higher returns, which usually triggers an explosion of altcoin rallies.
추천 기사


