

Solana Price Forecast: SOL gears up for double-digit gains as demand for meme coins jumps
Solana price today: $151.73
- Solana price increases 3% on Monday, posting a four-consecutive day of gains.
- The number of holders of Solana-based meme coins has jumped in the past 30 days, as have transactions and active addresses in the network.
- SOL could extend gains by nearly 12% to target resistance at $169.
Solana (SOL) continues its upward trend this week, rising above the $150 level on Monday. The token of the Ethereum-alternative smart contract chain has gained 3% on the day and is gathering positive momentum at the time of writing.
On-chain metrics and a rising number of holders of meme coins issued on the SOL blockchain are key market movers that indicate the potential for a price rally in Solana.
Solana could rally with bullish on-chain metrics, rise in meme coin demand
Solana-based meme coins Daddy Tate (DADDY), Mother Iggy (MOTHER), Billy (BILLY), Ponke (PONKE), Retardio (RETARDIO), Michi (MICHI), Sad Hamster (HAMMY), among others have observed a rise in the number of token holders in the past 30-days.
Meme coin analyst Murad, behind the X handle @MustStopMurad shared the statistics in a recent tweet.
Memecoins Growing on both Solana and Ethereum
— Murad (@MustStopMurad) October 13, 2024
We are in the early stages of the Memecoin Supercycle. pic.twitter.com/VUk1SxzWsq
Typically, a rise in the number of token holders is considered a bullish sign for an asset as it is indicative of increasing demand for the digital currency among investors.
Key on-chain metrics, such as the number of transactions and active addresses on Solana, climbed in the last 30 days, according to data from The Block.
The number of transactions and active addresses on the SOL chain climbed nearly 7% in the last 30 days. Growth in the two on-chain metrics signals higher demand and likely an increase in the relevance of the asset among market participants in the same timeframe.
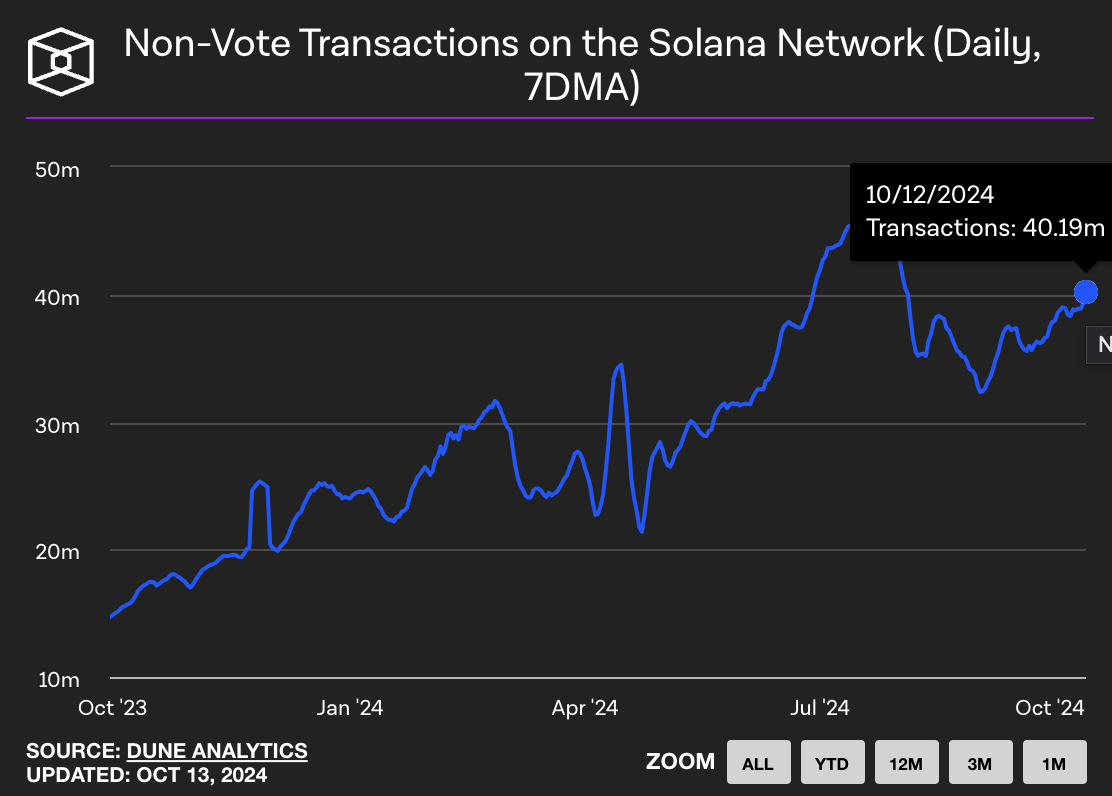
Number of non-vote transactions on Solana
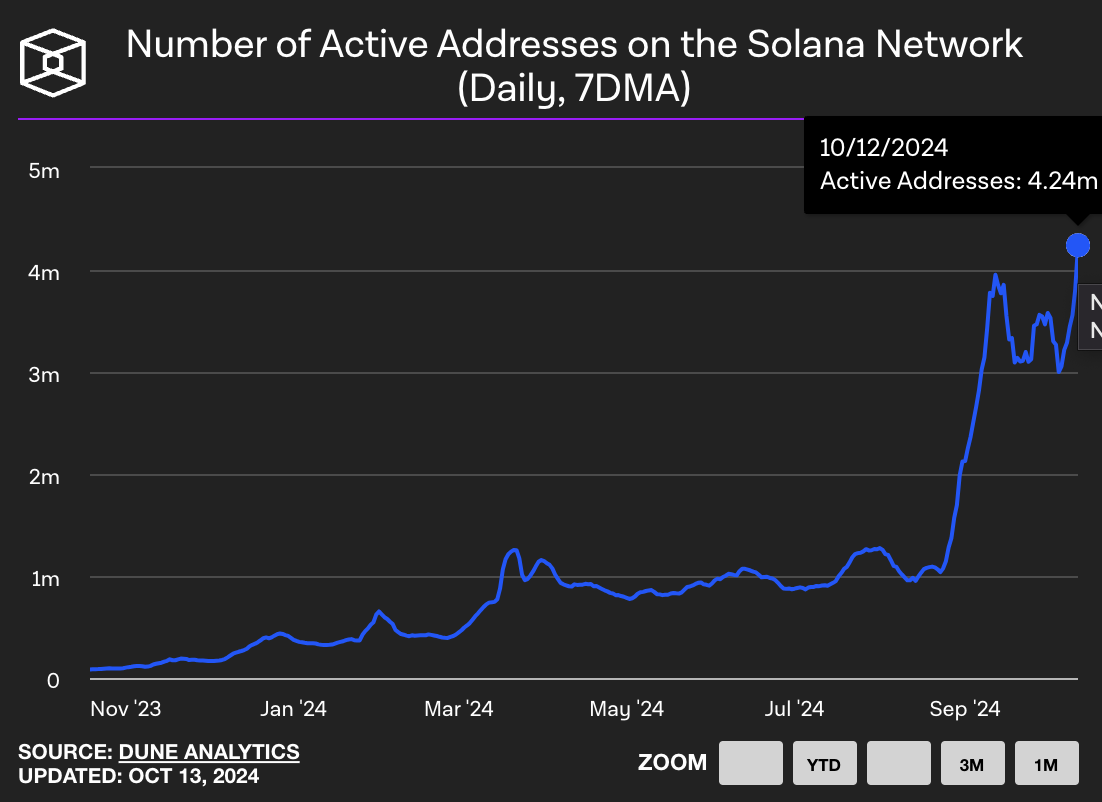
Number of active addresses on Solana
Solana Price Forecast: SOL could gain nearly 12%
Solana started an upward trend in October 2023. Since then, the altcoin has formed higher highs and higher lows until its March 2024 peak of $210.18. SOL has traded in a range-bound manner for over six months since. Key support levels are $134.27 and $144.71, the September 19 and October 12 lows, respectively. These levels coincide with the upper/lower boundaries of imbalance zones, as observed in the daily price chart below.
Two momentum indicators, the Relative Strength Index (RSI) and the Moving Average Convergence Divergence (MACD), support the bullish thesis. While the RSI reads 58.11 on Monday, above the neutral level at 50 and far below the overbought zone, the green histogram bars above the neutral line on the MACD indicator point towards a positive underlying momentum in SOL price.
SOL could rally 11.70% from the current level of $151.73 towards the key resistance at $169.43; this marks the August 2 high and coincides with the lower boundary of the Fair Value Gap (FVG) between $169.43 and $171.61.
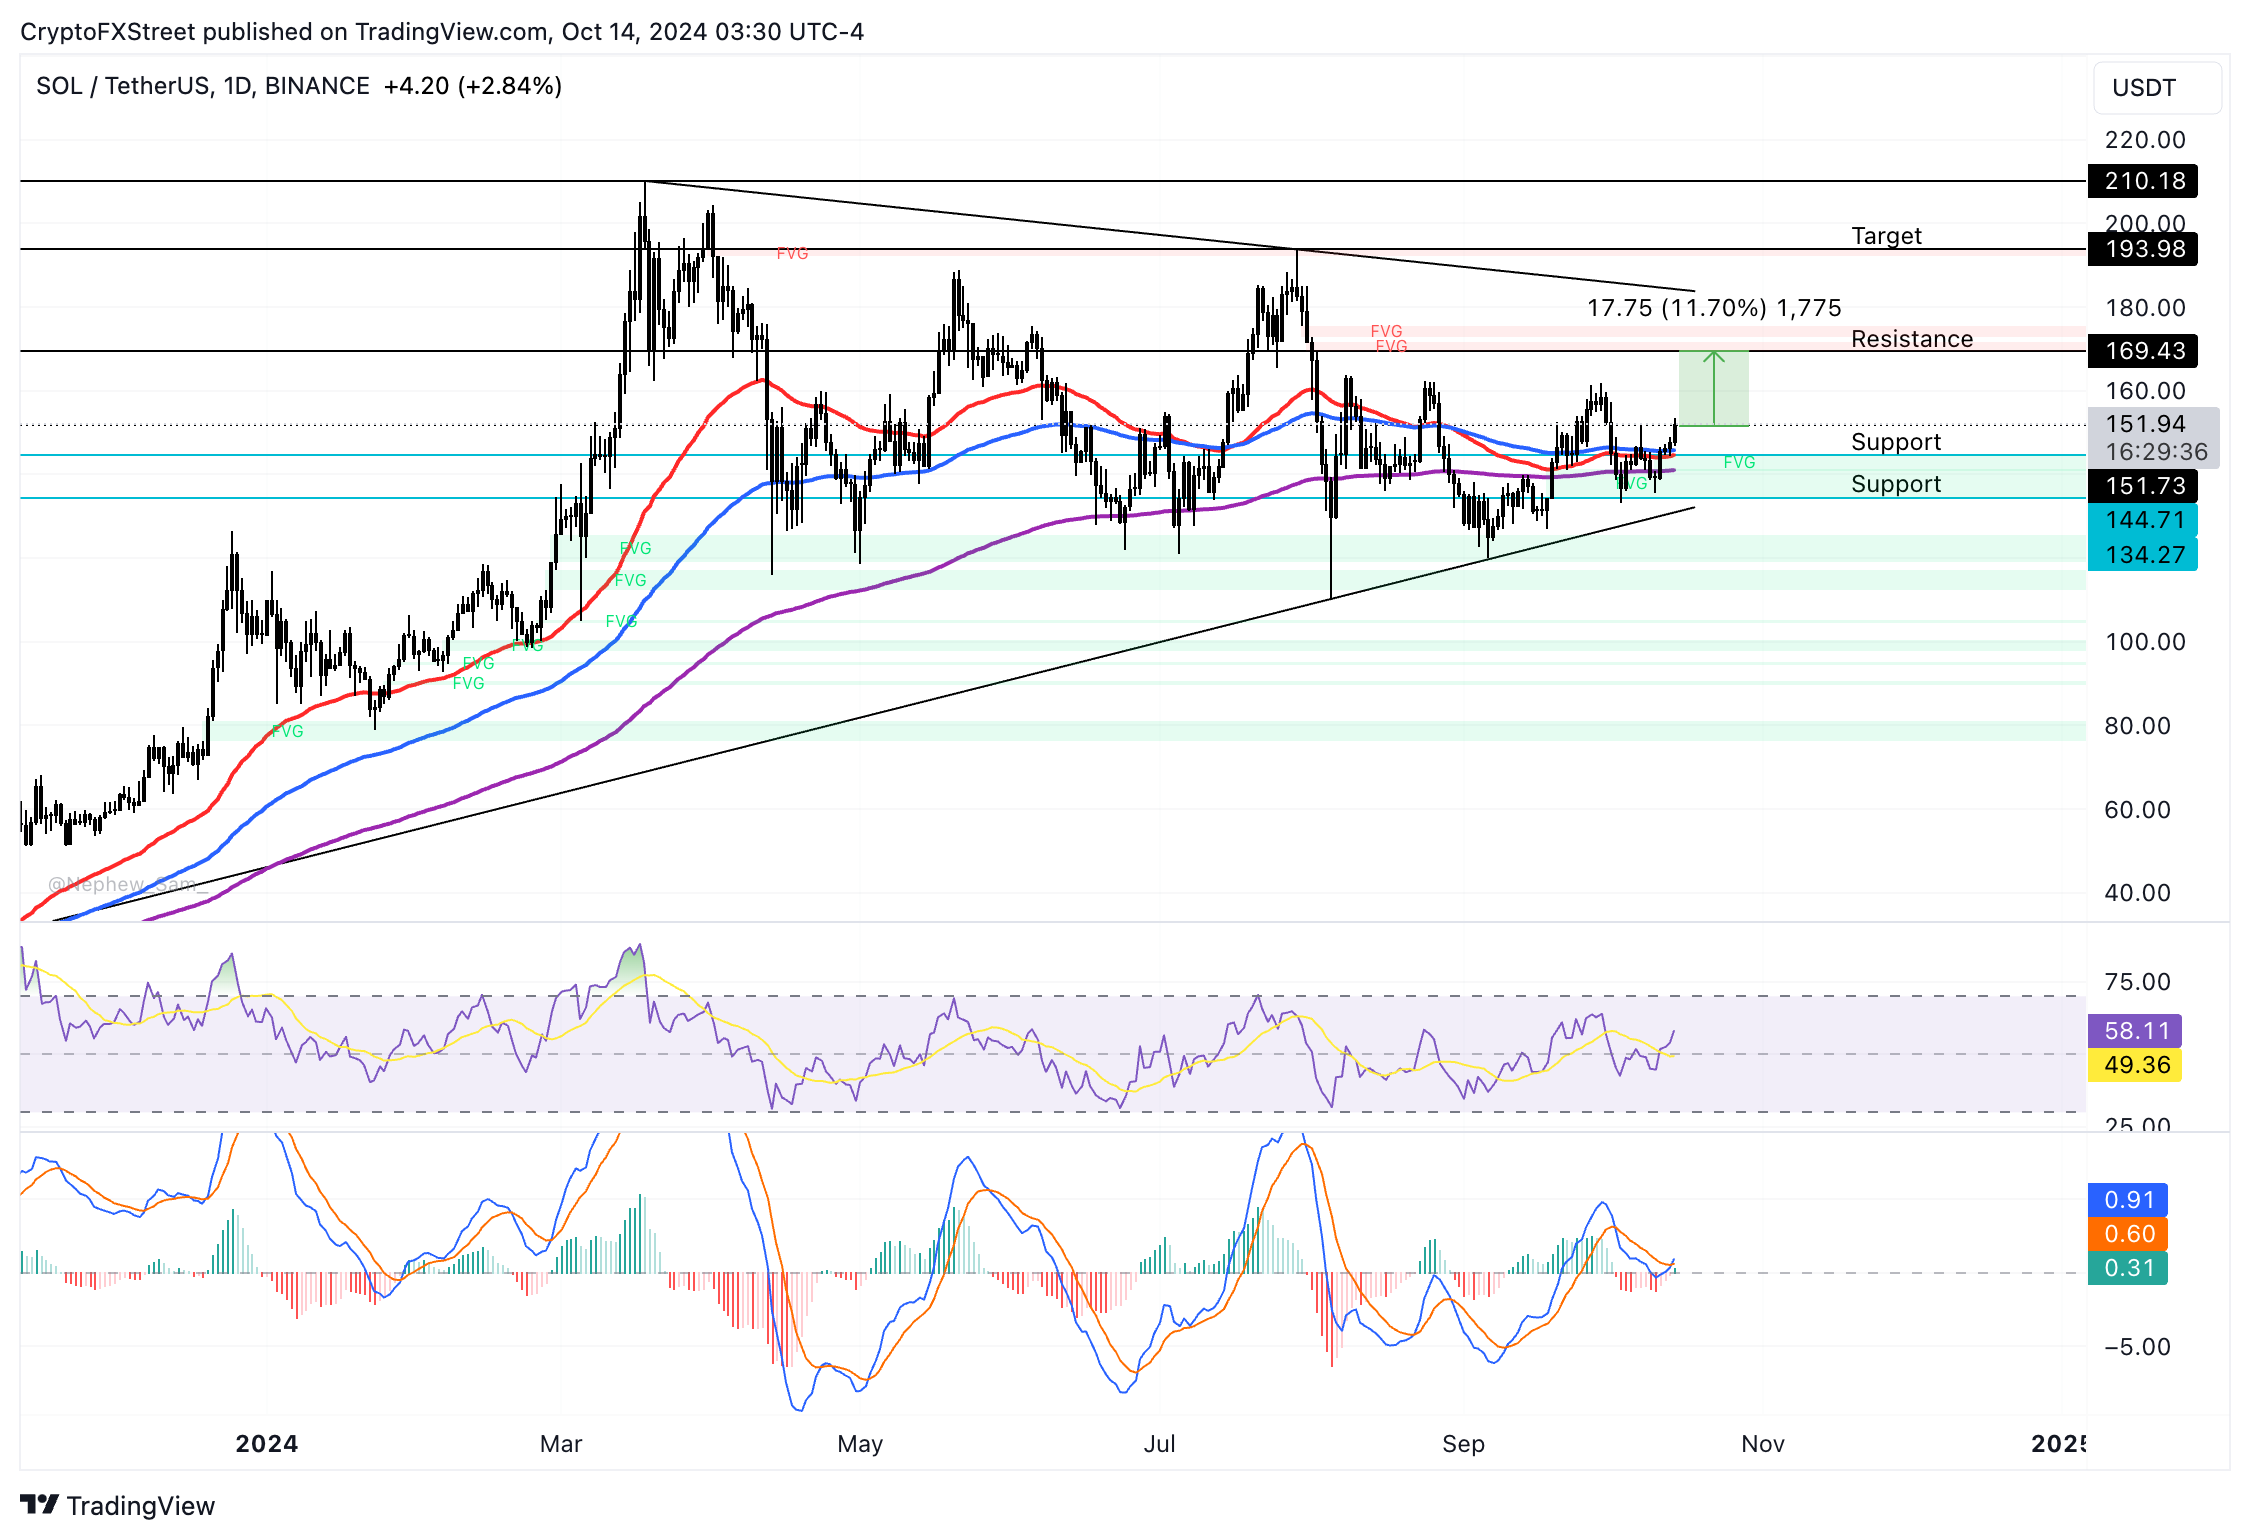
SOL/USDT daily chart
A daily candlestick close under support at $144.71 could invalidate the bullish thesis. If SOL suffers a correction, it could sweep liquidity at the $134.27 support.
Bitcoin, altcoins, stablecoins FAQs
Bitcoin is the largest cryptocurrency by market capitalization, a virtual currency designed to serve as money. This form of payment cannot be controlled by any one person, group, or entity, which eliminates the need for third-party participation during financial transactions.
Altcoins are any cryptocurrency apart from Bitcoin, but some also regard Ethereum as a non-altcoin because it is from these two cryptocurrencies that forking happens. If this is true, then Litecoin is the first altcoin, forked from the Bitcoin protocol and, therefore, an “improved” version of it.
Stablecoins are cryptocurrencies designed to have a stable price, with their value backed by a reserve of the asset it represents. To achieve this, the value of any one stablecoin is pegged to a commodity or financial instrument, such as the US Dollar (USD), with its supply regulated by an algorithm or demand. The main goal of stablecoins is to provide an on/off-ramp for investors willing to trade and invest in cryptocurrencies. Stablecoins also allow investors to store value since cryptocurrencies, in general, are subject to volatility.
Bitcoin dominance is the ratio of Bitcoin's market capitalization to the total market capitalization of all cryptocurrencies combined. It provides a clear picture of Bitcoin’s interest among investors. A high BTC dominance typically happens before and during a bull run, in which investors resort to investing in relatively stable and high market capitalization cryptocurrency like Bitcoin. A drop in BTC dominance usually means that investors are moving their capital and/or profits to altcoins in a quest for higher returns, which usually triggers an explosion of altcoin rallies.
추천 기사


