


Top 3 Price Prediction Bitcoin, Ethereum, Ripple: Bitcoin faces potential decline if it falls below $56,000 threshold
- Bitcoin price hovers around the key support level at $56,000; a close below could see its downtrend persist.
- Ethereum price approaches the $2,300 level; a firm close below would suggest a decline ahead.
- Ripple price hovers around its daily support level at $0.544, with a break below signaling a bearish trend ahead.
Bitcoin (BTC) and Ripple (XRP) prices approach their key support levels, a close below these levels could signal a decline ahead. Ethereum (ETH) also follows a similar trajectory, with a breach of the $2,300 level potentially forecasting a bearish trend.
Bitcoin price is poised for a decline if it closes below $56,000 support level
Bitcoin was rejected after retesting its 50% price retracement level at $59,560 (drawn from a high in late July to a low in early August) on Monday and dropped 5% the next three days. As of Friday, it trades slightly higher by 1% at $56,740 after retesting the daily support level around $56,022.
If BTC closes below the $56,022 daily support level, it could decline by 3.5% to retest the psychological level of $54,000.
The Relative Strength Index (RSI) and the Awesome Oscillator (AO) momentum indicators on the daily chart trade below their respective neutral levels of 50 and zero, respectively. Both indicators suggest weak momentum and a continuation of its downward trend.
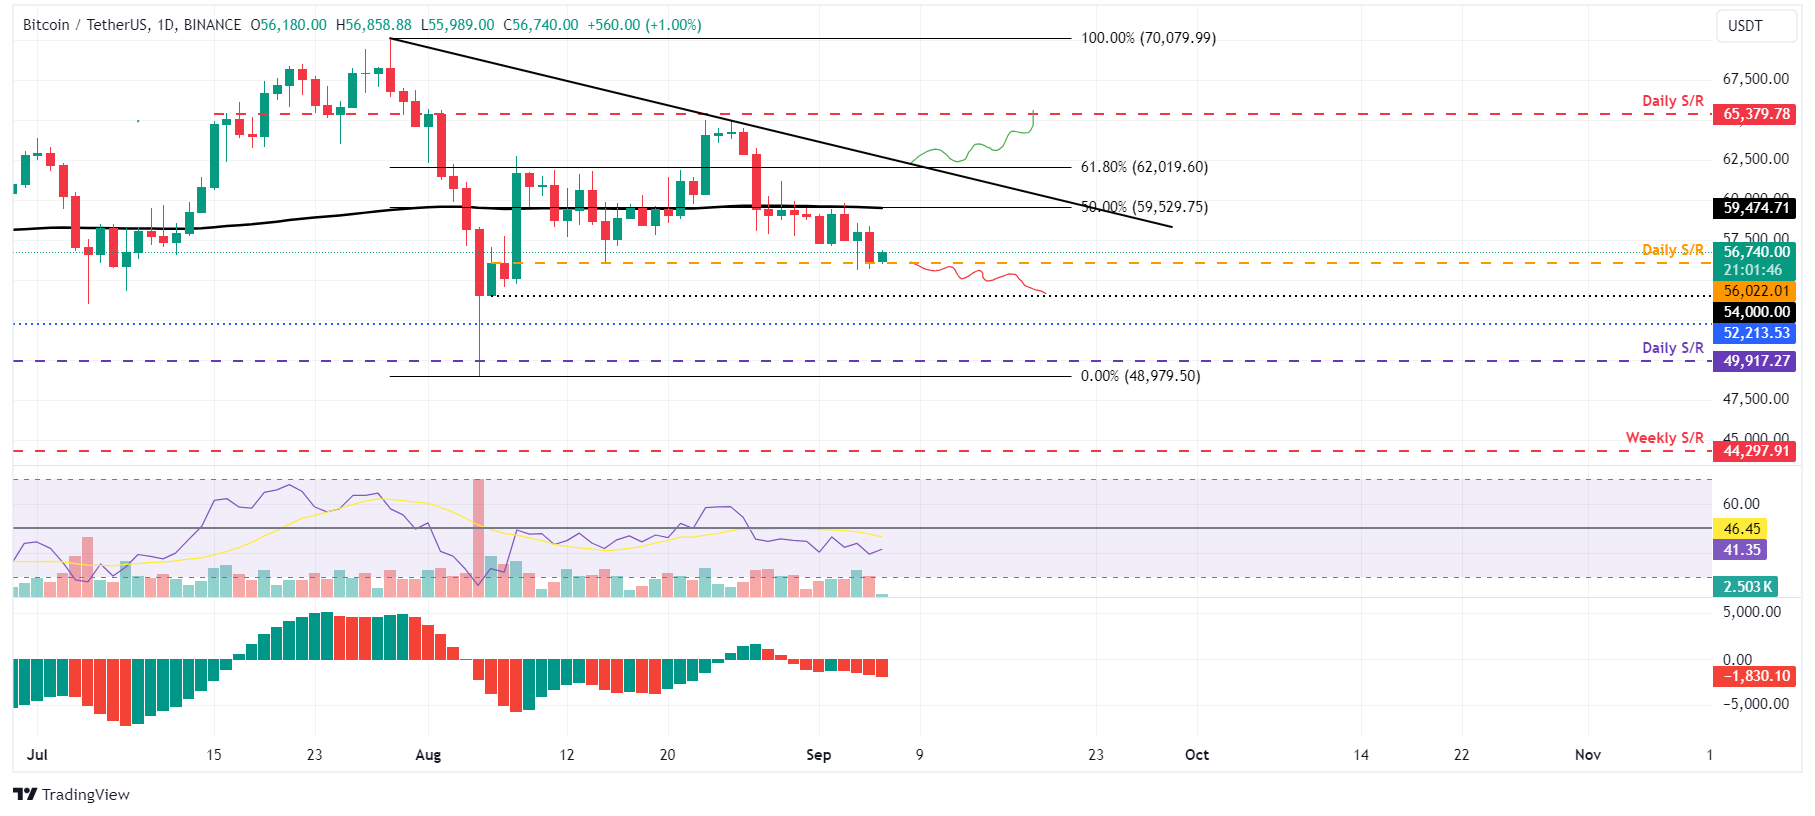
BTC/USDT daily chart
However, if Bitcoin’s price breaks above the $59,560 resistance and closes above $62,019, the 61.8% Fibonacci retracement level, the bearish thesis will be invalidated. In this scenario, BTC could extend the positive move by 5.5% to revisit its daily resistance level at $65,379.
Ethereum price is set for downward trend after closing below the $2,300 level
Ethereum price was rejected around its previously broken ascending trendline (formed by connecting multiple low levels from August 7), which was around $2,619 on Monday. It dropped 7% the next three days, finding support around its August 8 low of $2,327. As of Friday, it trades slightly higher by 1.35% at $2,400.
If ETH closes below the $2,327 level, it could decline by 8.5% to retest its weekly support at $2,118.
The RSI and AO are trading below the neutral levels of 50 and zero on the daily chart. These momentum indicators signal a continuation of the bearish dominance and impending fall in prices on the horizon.
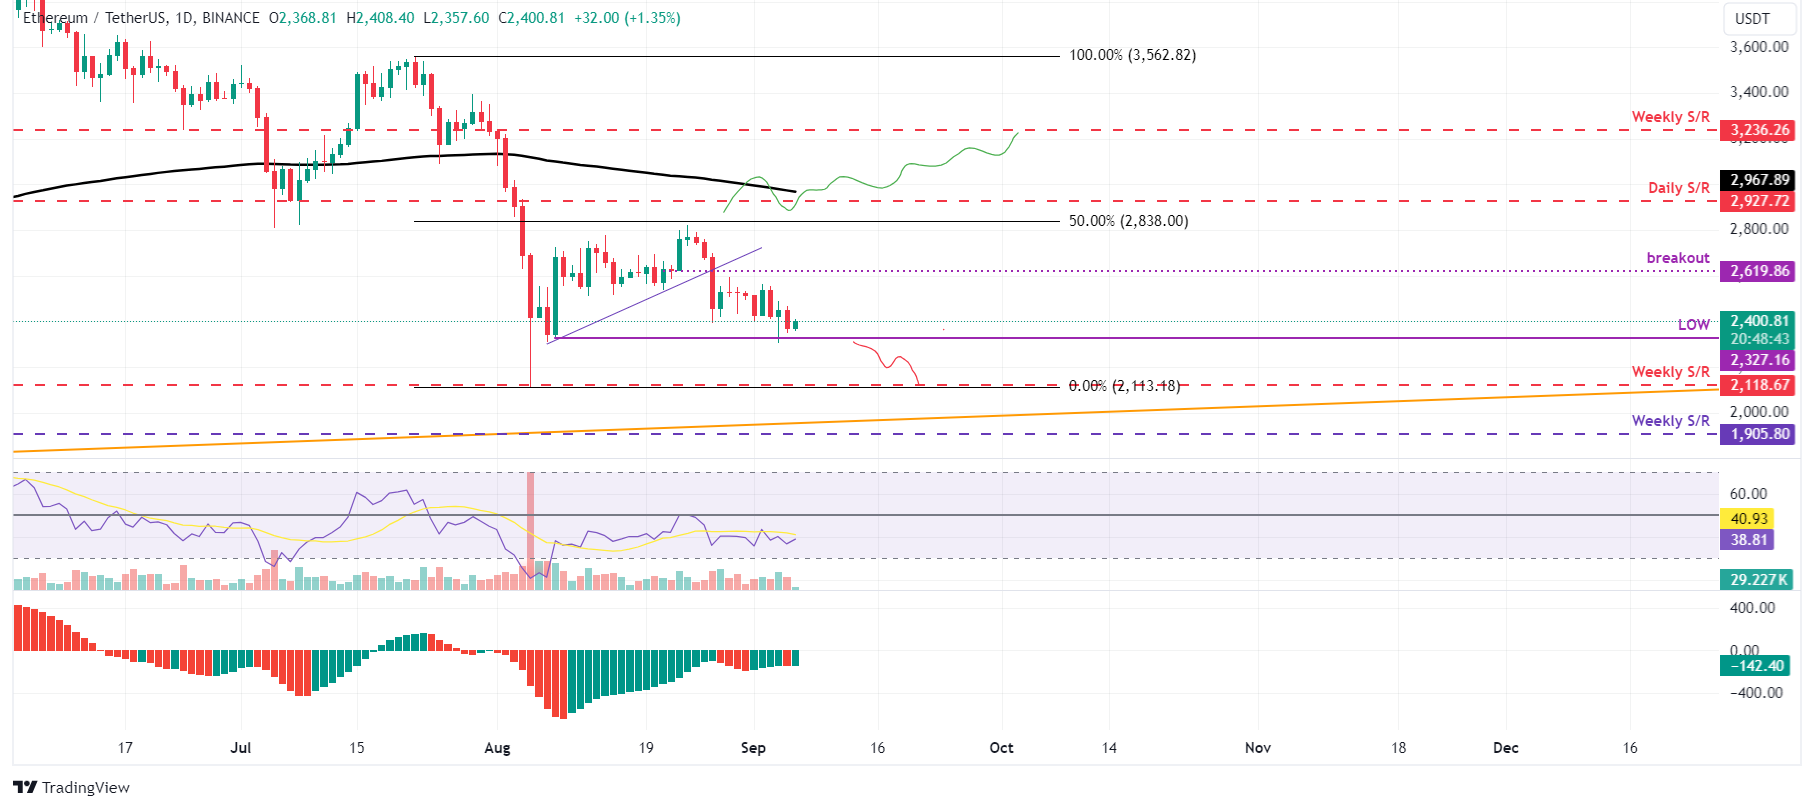
ETH/USDT daily chart
On the other hand, if ETH breaks above the $2,619 level and closes above the daily resistance at $2,927, forming a higher high on the daily chart, this would invalidate the bearish thesis, and it could rally 11% to retest its weekly resistance level at $3,236.
Ripple price is poised for a downturn after closing below key support level
Ripple price broke below the 200-day EMA, hovering around $0.549 on Thursday, but found support around its daily support level at $0.544. On Friday, it trades slightly higher by 0.46% at $0.546. If XRP breaks below the $0.544 level, it could drop by 10% to retest the August 7 low of $0.492.
The daily chart’s RSI and AO are trading below the neutral levels of 50 and zero. These momentum indicators strongly indicate bearish dominance.
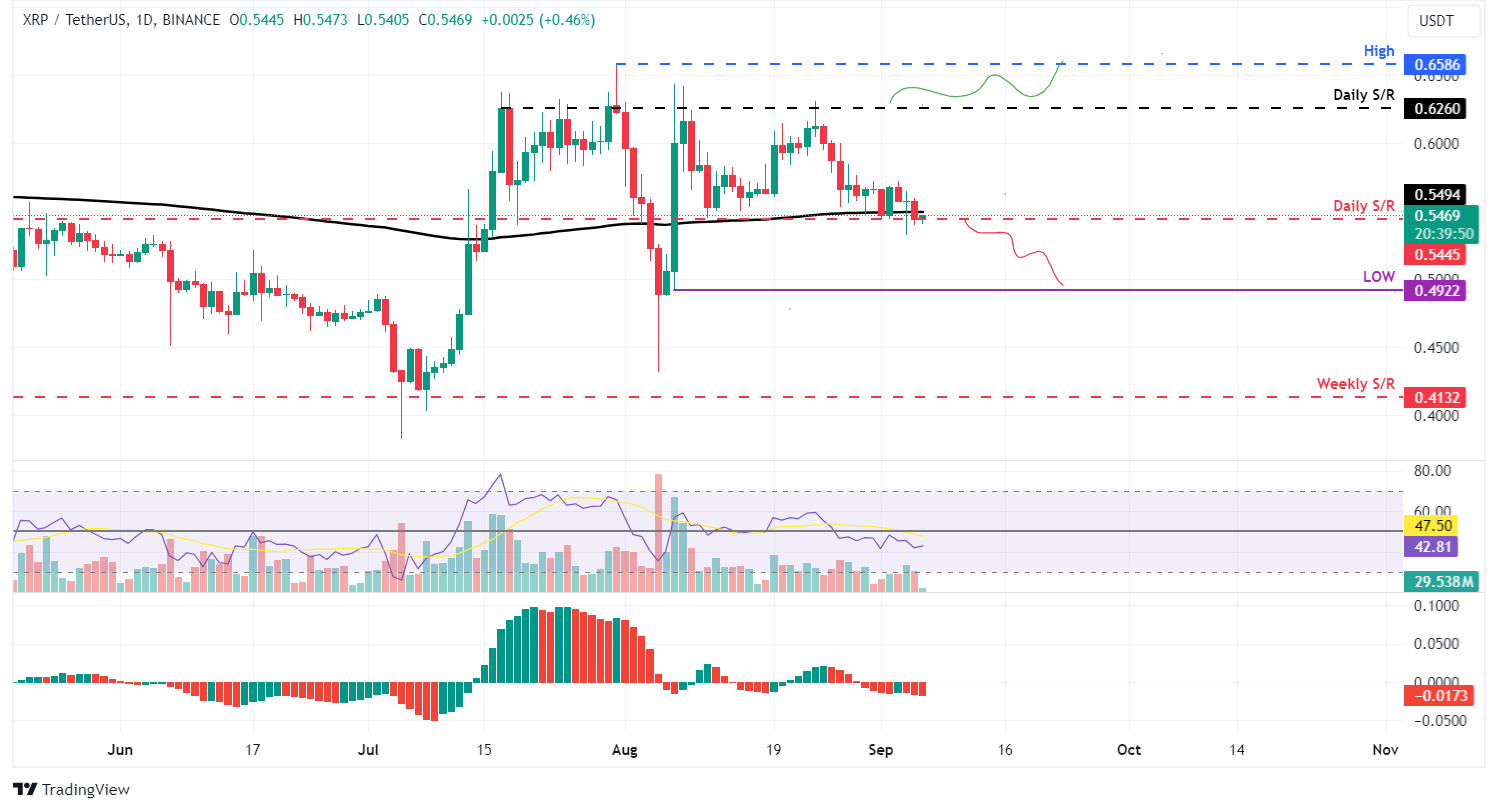
XRP/USDT daily chart
However, if the Ripple price closes above the $0.626 daily resistance level, it would shift the market structure by creating a higher high on the daily chart, potentially leading to a 5.3% rise to revisit the July 31 high of $0.658.
추천 기사


