


Crypto Today: Bitcoin, Ethereum and XRP on edge as sell-side pressure intensifies
- Bitcoin breaks below $80,000 support as market participants await Fed rate decision.
- Ethereum drops and tests the $2,300 demand area, weighed down by waning market sentiment.
- XRP bulls fight to defend $1.30 as support, but the falling moving averages and momentum could continue to cap recovery potential.
Cryptocurrency prices are broadly correcting on Tuesday, led by Bitcoin (BTC) edging lower below the pivotal $80,000 level. Ethereum (ETH) mirrors Bitcoin’s neutral-to-bearish outlook, while Ripple (XRP) hovers around $1.30.
Market sentiment dims ahead of Fed decision
The cryptocurrency market’s outlook has dimmed over the last few weeks, facing macro uncertainties, geopolitical tensions and the lack of key catalysts to sustain gains and consolidation at higher levels. Traders remain glued to the upcoming Federal Reserve (Fed) interest rate decision on Wednesday.
CME’s FedWatch Tool shows nearly 90% odds that the Federal Open Market Committee (FOMC) will keep interest rates unchanged in the 3.75-4.00% range, with only 10% of market participants expecting a rate hike.
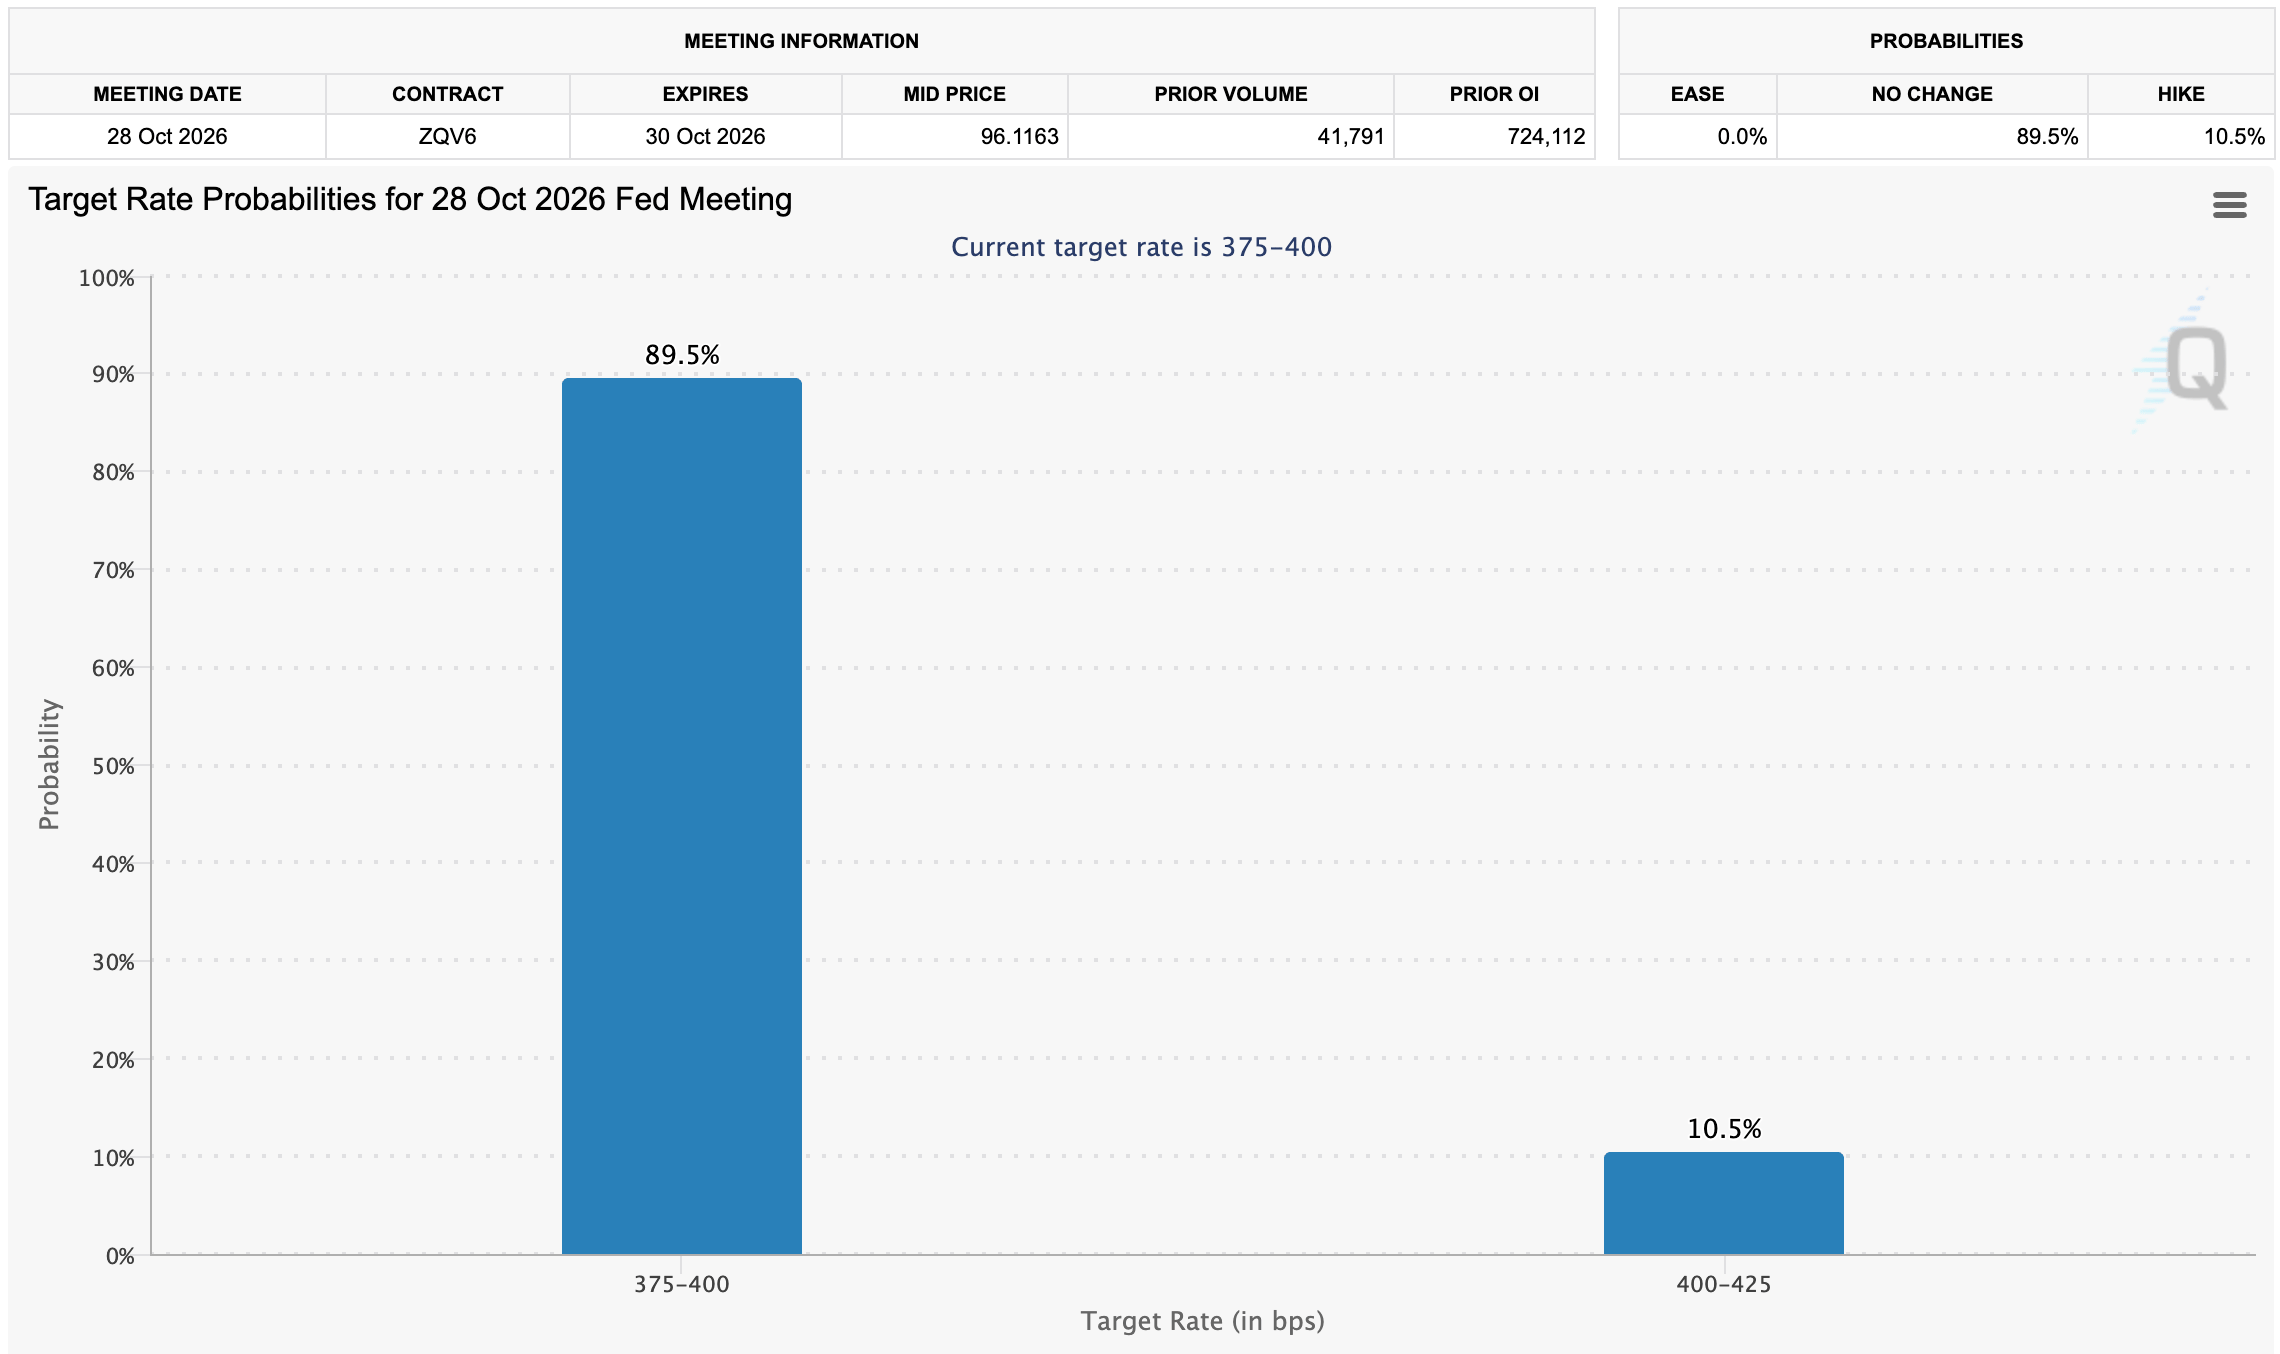
Trader repositioning could persist ahead of the Fed decision amid potential volatility spikes. Since no rate change is anticipated, traders will be watching Fed Chair Kevin Warsh’s post-meeting conference to offer insight into the central bank’s monetary policy direction.
“We expect rates to remain unchanged, so the focus will be on the dot plot and any shift in the forward path,” Crypto Finance said via an emailed analysis report, adding, “Markets currently price a ~90% probability of a skip, followed by a December hike and two further hikes by year-end 2027, taking the target range to 4.50–4.75%.”
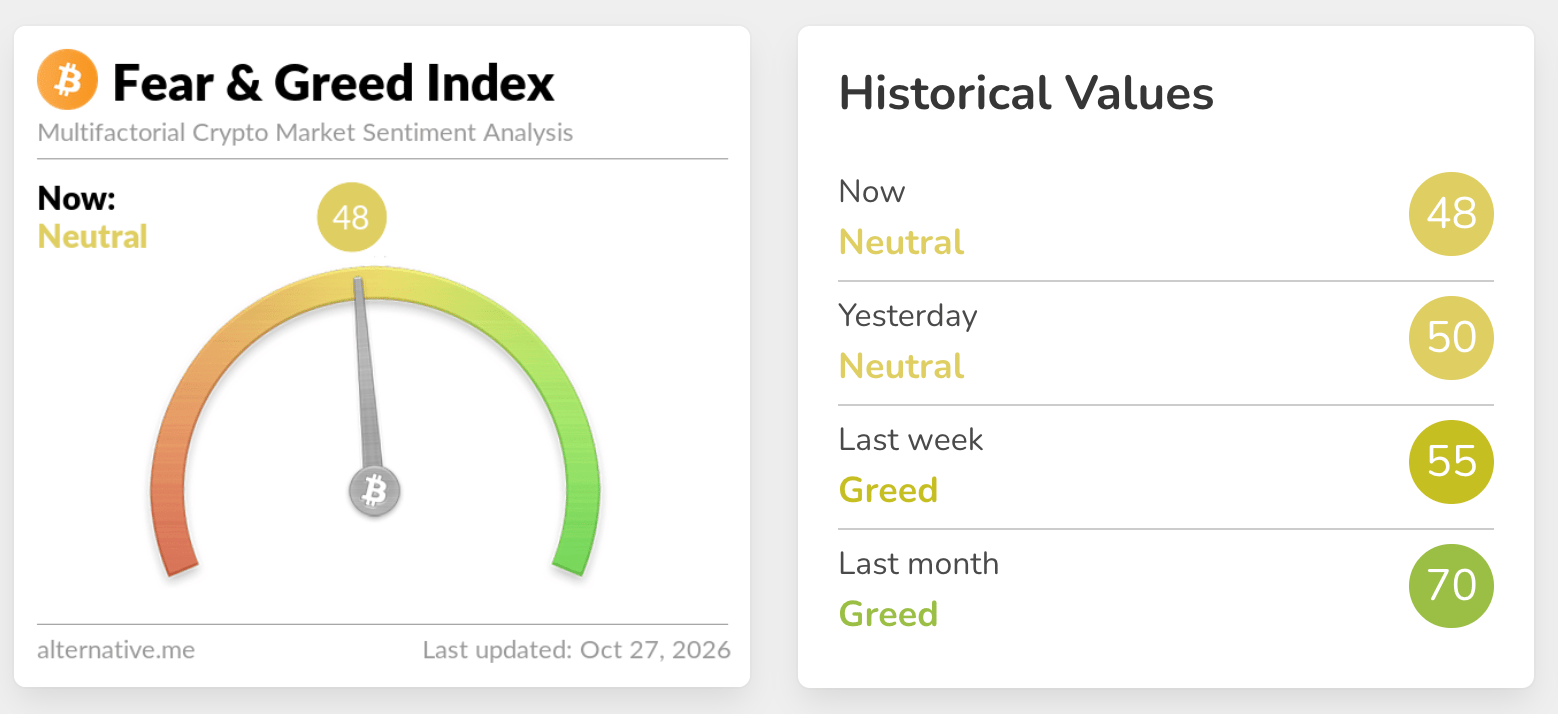
Appetite for digital assets continues to shrink, as evidenced by the Fear & Greed Index currently at 48 in Neutral territory, compared to last week’s 55 in the Greed range and last month’s 70 in the Greed zone. If this trend persists, it may prove difficult to hold major crypto assets at elevated levels, with Bitcoin likely to retest structural and psychological levels toward $75,000.
Bitcoin technical analysis: BTC bears eye trend control
Bitcoin trades at $79,795 and remains bearish in the near term, capped below the 50-day Exponential Moving Average (EMA) at $80,761. Price remains above the 100-day and 200-day EMAs at $77,725 and $76,375, respectively, suggesting the broader trend retains a constructive undertone even as the latest leg consolidates.
The SuperTrend line at $79,664 sits just below spot and acts as immediate underlying demand, while the Relative Strength Index (RSI) at 40 and the negative Moving Average Convergence Divergence (MACD) histogram reinforce waning momentum after the recent highs.
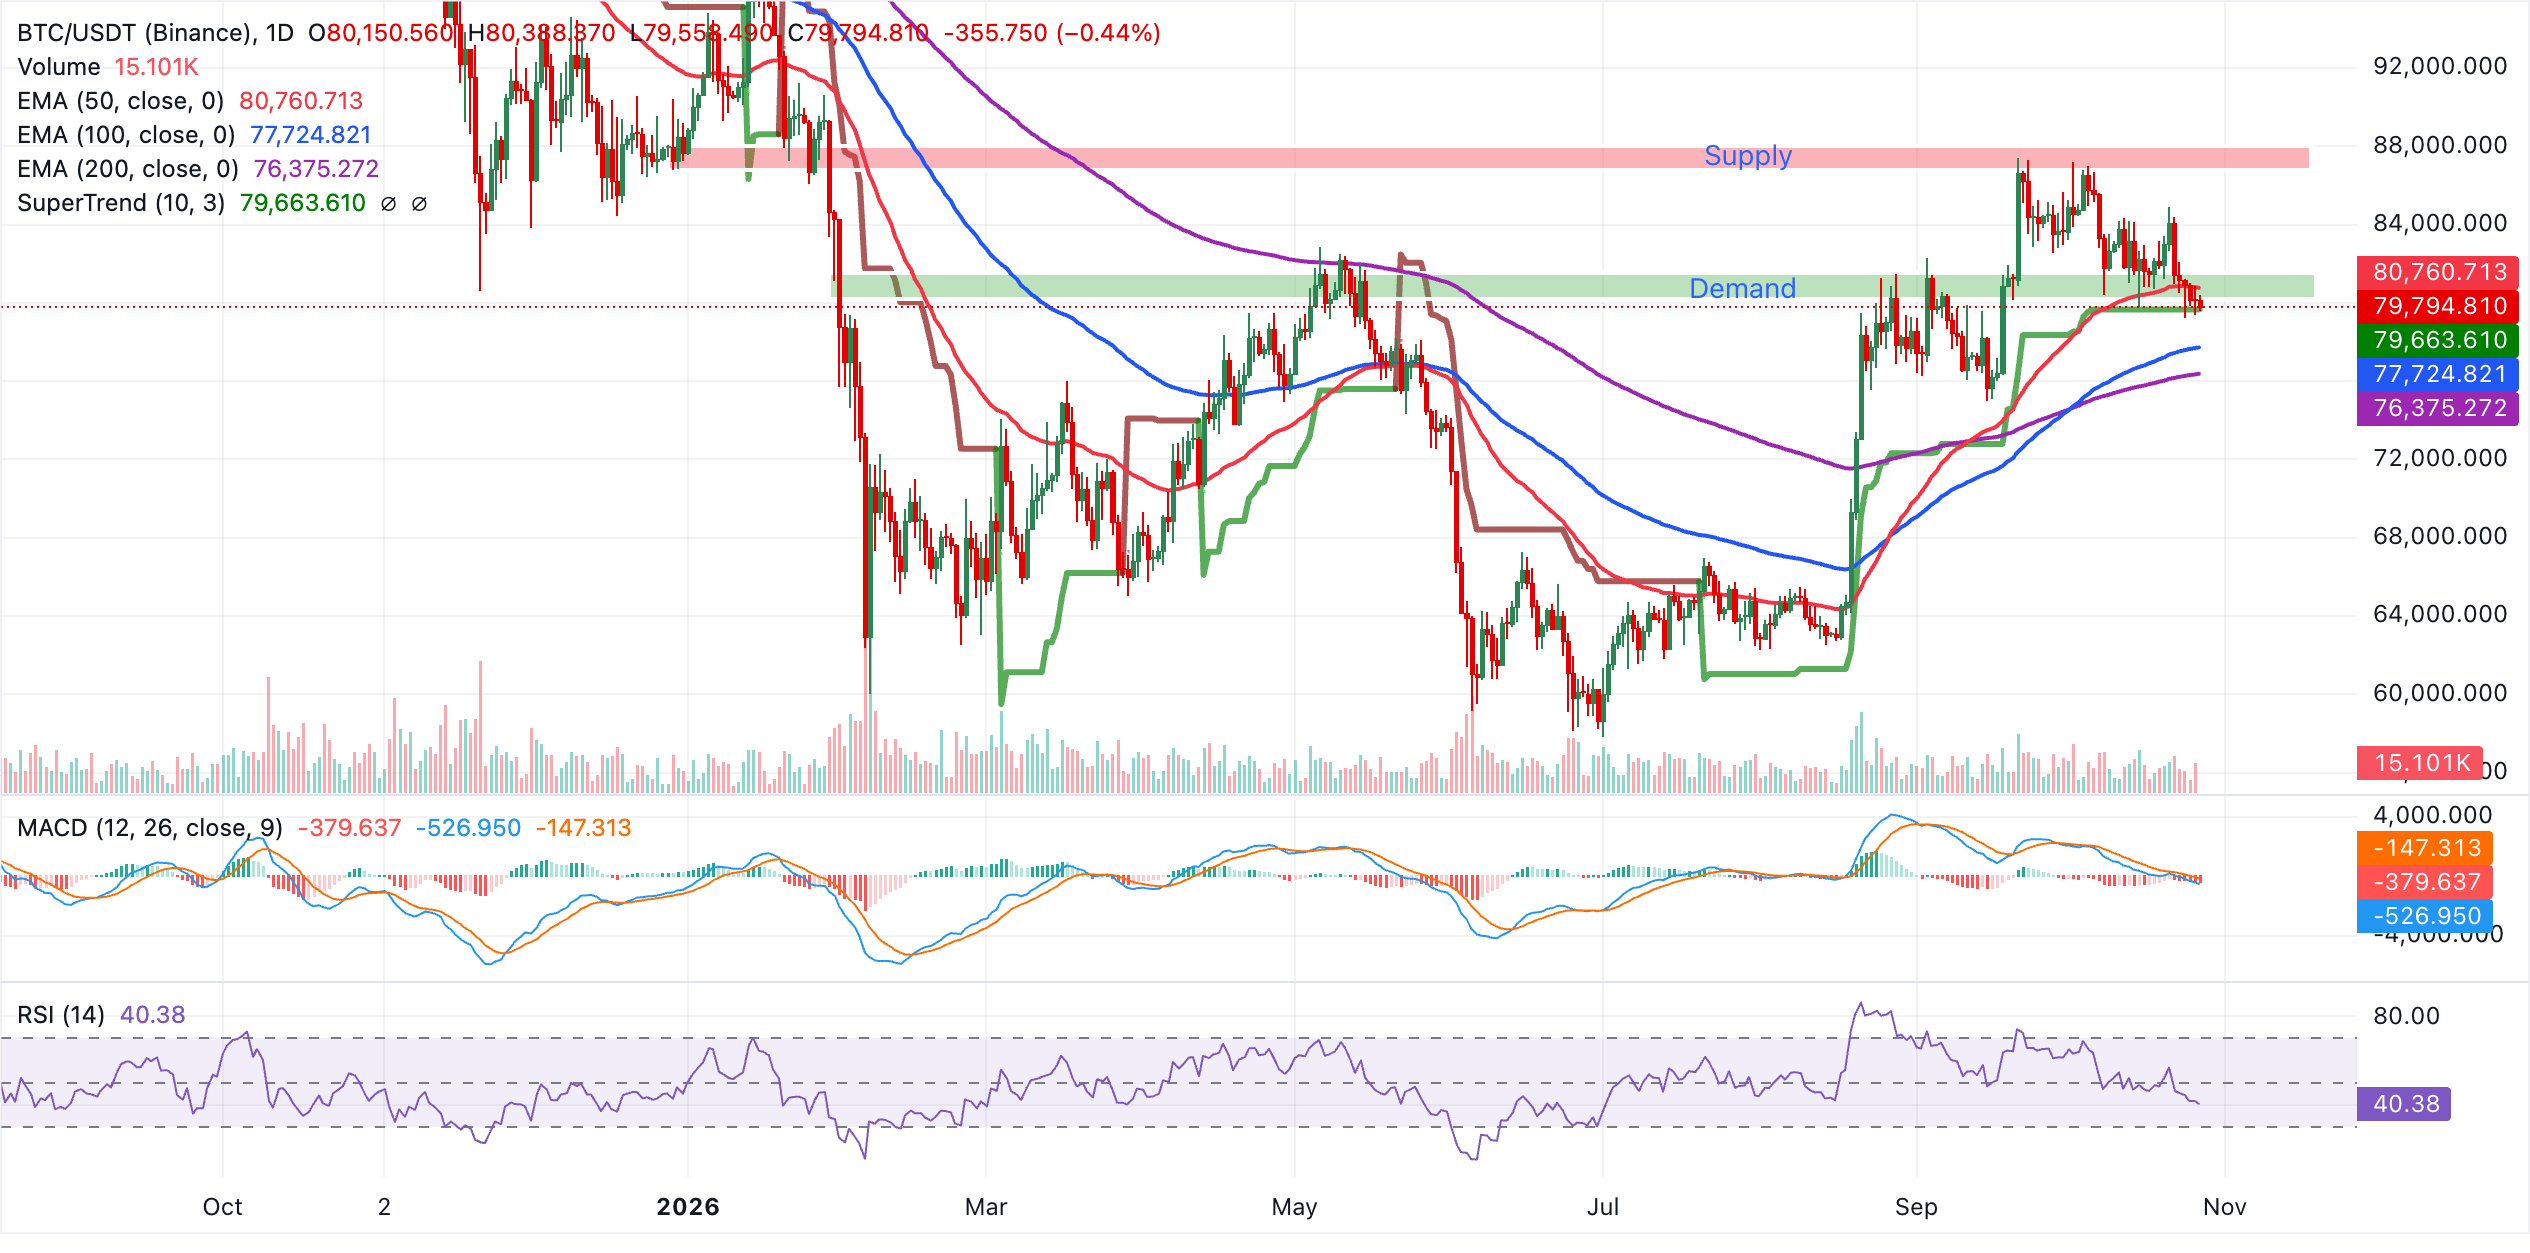
Initial resistance is defined by the 50-day EMA at $80,7602. A daily close above this barrier would be needed to ease the current bearish bias and reopen the path toward the recent peak zone.
On the downside, the very short-term floor is the current price area around $79,795, with the SuperTrend support at $79,664 forming a nearby buffer. A break below this cluster would expose the 100-day EMA at $77,725 and then the 200-day EMA at $76,375 as deeper supports, where buyers would be expected to reassert the broader uptrend.
Ethereum technical analysis: ETH risks a deeper sell-off
Ethereum trades at $2,312, maintaining a bearish near-term bias as it holds below all major moving averages and the SuperTrend baseline. Price is marginally under the 200-day EMA at $2,316, while the 100-day EMA at $2,362 and the prior rising trendline break level near $2,362 sit higher, reinforcing an overhead supply zone.
Momentum remains fragile, with the RSI hovering near the lower 30s and the MACD line negative, suggesting persistent downside pressure despite the pair stabilizing above recent lows.
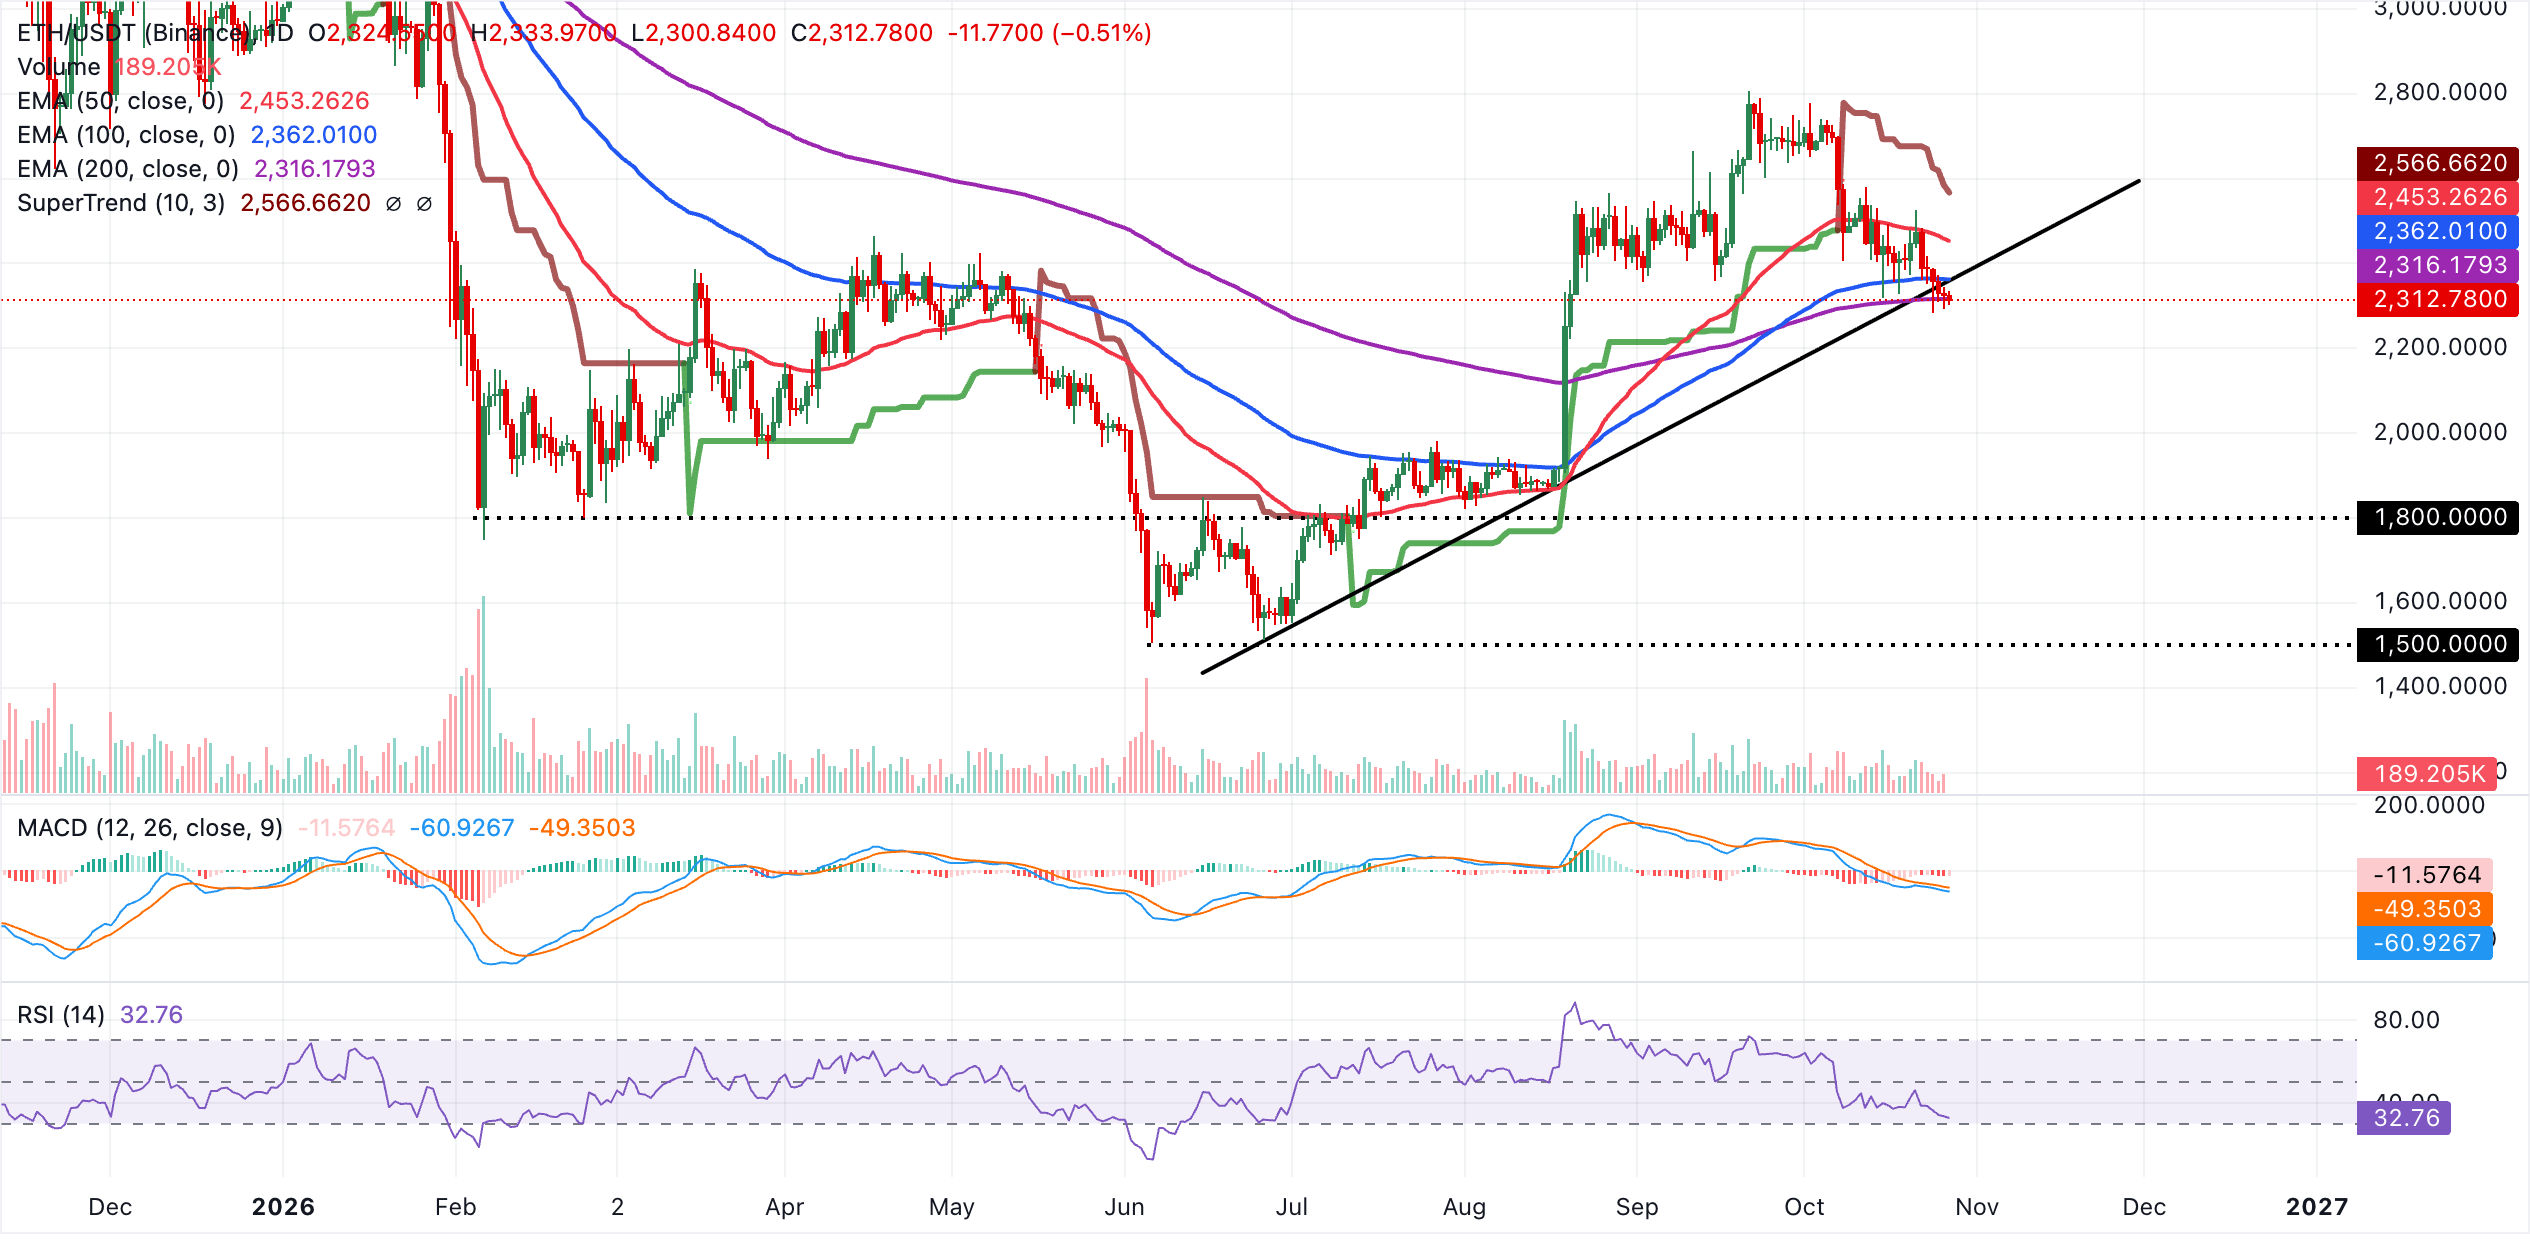
Initial resistance sits at the 200-day EMA near $2,316, ahead of a stronger cluster around $2,362 where the 100-day EMA and the broken ascending trendline converge, which could cap rebounds.
Further up, the 50-day EMA at $2,453 and the SuperTrend line at $2,566 define subsequent barriers that would need to be reclaimed to ease the broader bearish tone. With no clearly defined support levels on the daily chart below the current price, any sustained break below $2,312 would leave ETH vulnerable to fresh demand at lower levels not captured here.
Ripple technical analysis: XRP faces intense headwinds
XRP trades at $1.30, retaining a bearish near-term bias as it sits below all major moving averages and the active SuperTrend line. The pair remains under the 100-day EMA at $1.33, the 50-day EMA at $1.36, and the 200-day EMA at $1.37, while a broader downward resistance trend line continues to cap the upside.
Momentum is weak but not oversold, with the RSI hovering near 40 and the MACD still negative, suggesting persistent downside pressure rather than an imminent bullish reversal.
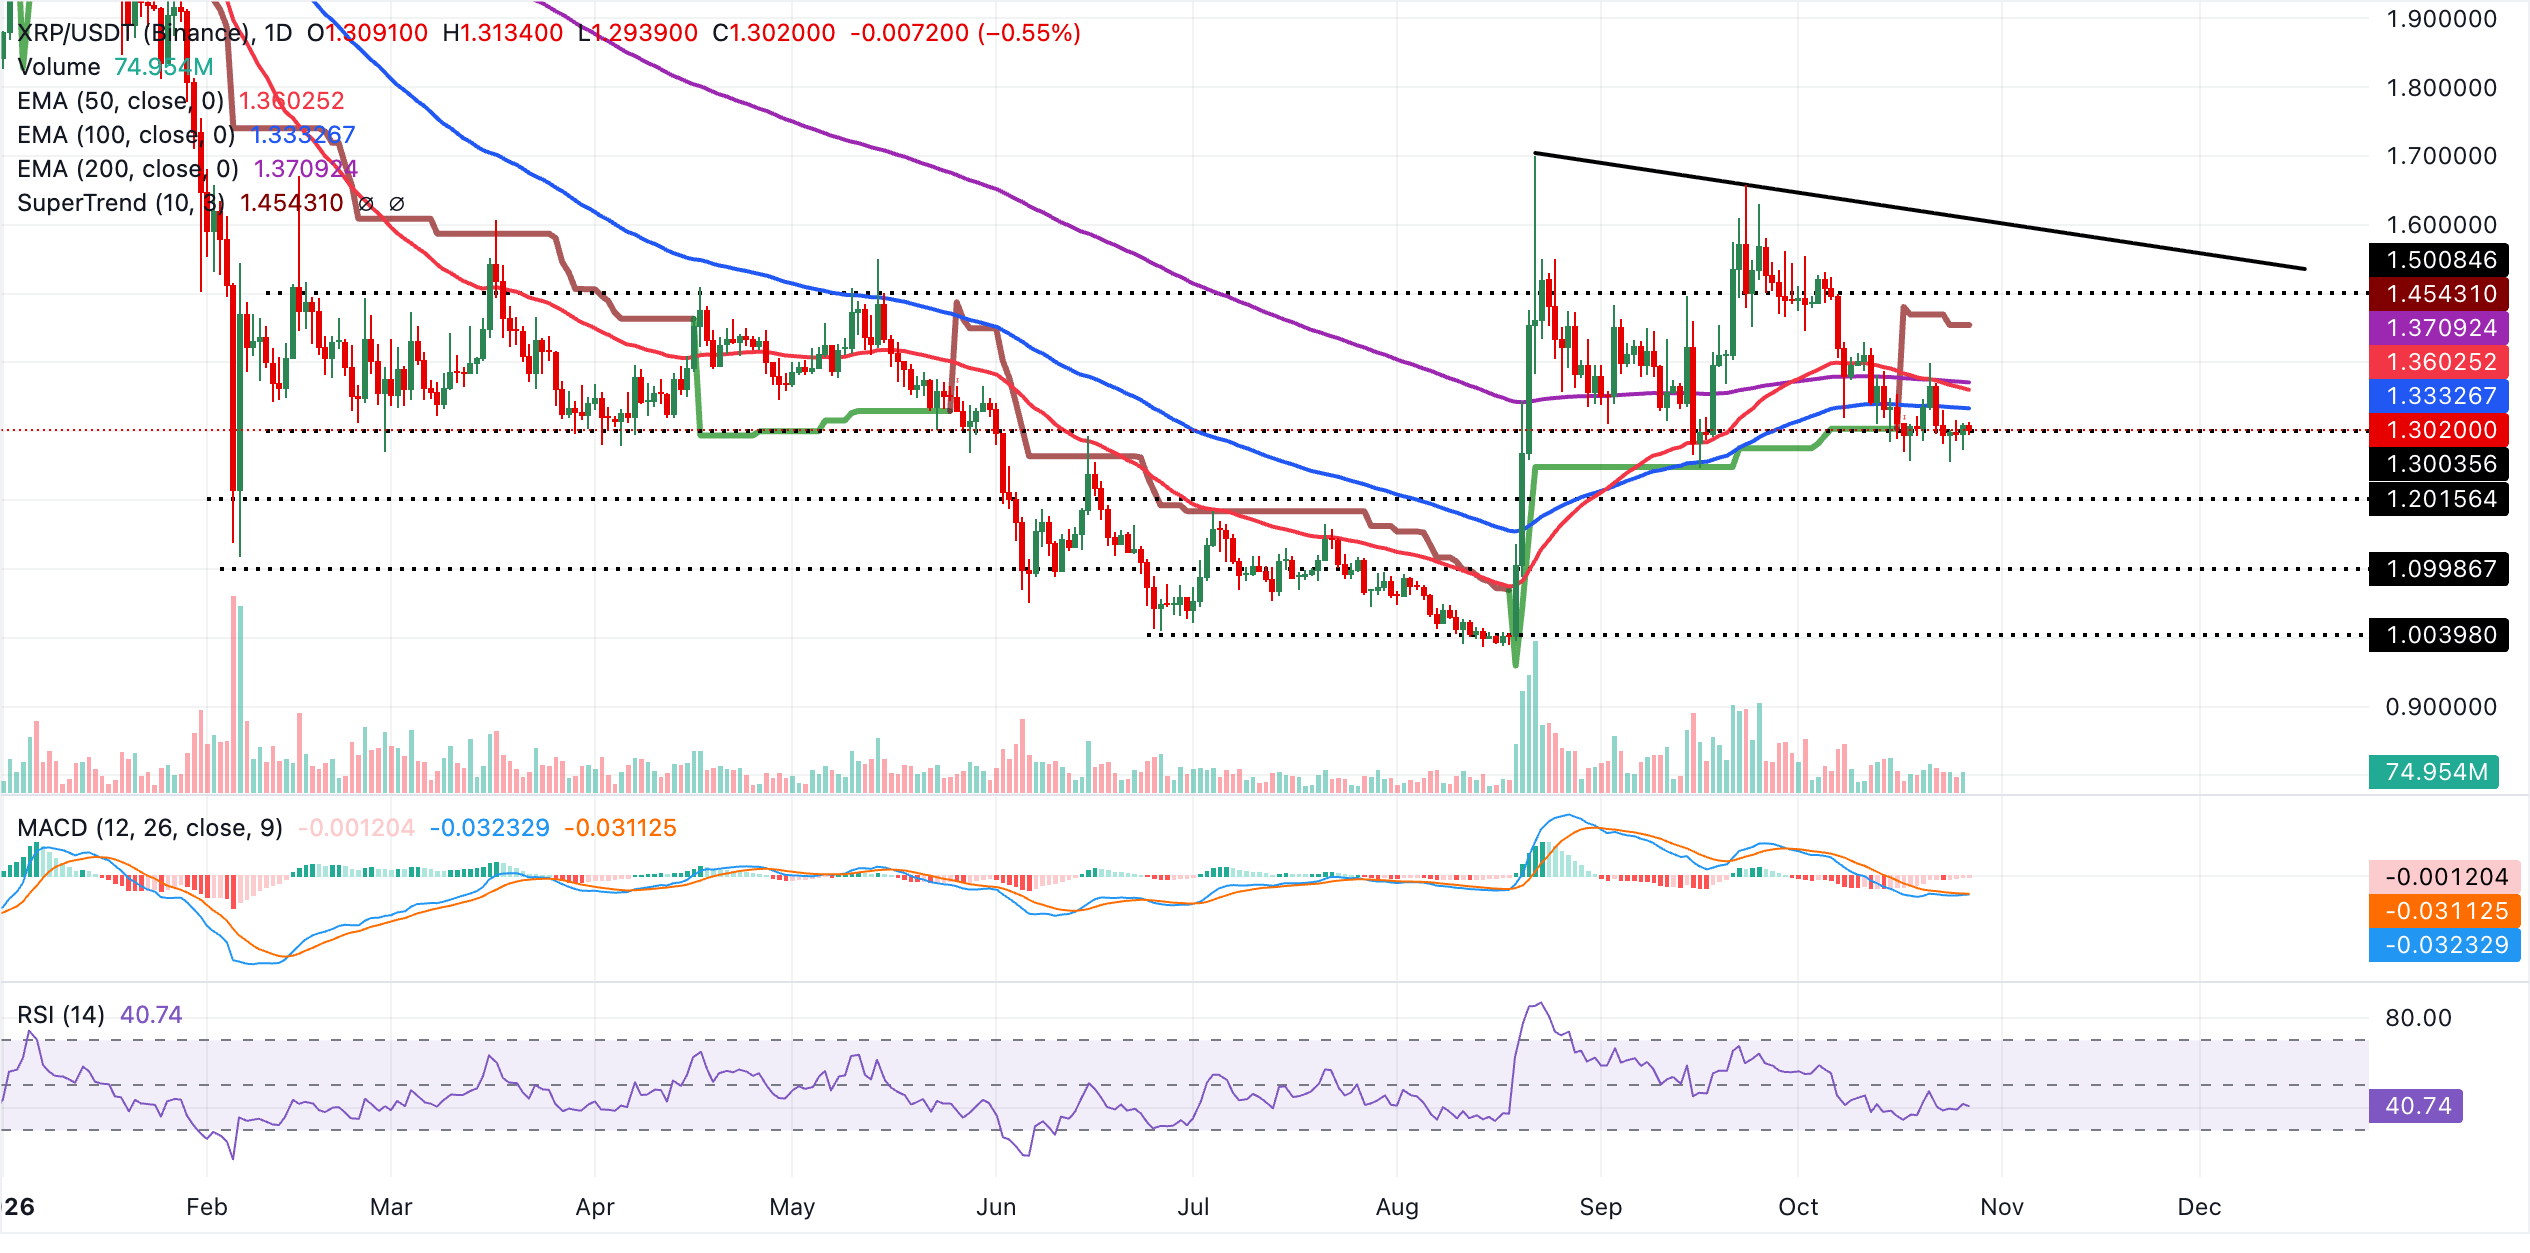
Initial resistance is seen at the 100-day EMA around $1.33, followed by the 50-day EMA near $1.36 and the 200-day EMA at $1.37, all reinforcing a dense supply zone aligned with the descending trend-line barrier. The SuperTrend level at $1.45 marks a more distant structural hurdle that would need to be reclaimed to ease the broader bearish tone, while the absence of clearly defined nearby supports below $1.30 suggests that any fresh selling could quickly explore lower levels until a new demand zone is established on the chart.
(The technical analysis of this story was written with the help of an AI tool. Know more.)
Bitcoin, altcoins, stablecoins FAQs
Bitcoin is the largest cryptocurrency by market capitalization, a virtual currency designed to serve as money. This form of payment cannot be controlled by any one person, group, or entity, which eliminates the need for third-party participation during financial transactions.
Altcoins are any cryptocurrency apart from Bitcoin, but some also regard Ethereum as a non-altcoin because it is from these two cryptocurrencies that forking happens. If this is true, then Litecoin is the first altcoin, forked from the Bitcoin protocol and, therefore, an “improved” version of it.
Stablecoins are cryptocurrencies designed to have a stable price, with their value backed by a reserve of the asset it represents. To achieve this, the value of any one stablecoin is pegged to a commodity or financial instrument, such as the US Dollar (USD), with its supply regulated by an algorithm or demand. The main goal of stablecoins is to provide an on/off-ramp for investors willing to trade and invest in cryptocurrencies. Stablecoins also allow investors to store value since cryptocurrencies, in general, are subject to volatility.
Bitcoin dominance is the ratio of Bitcoin's market capitalization to the total market capitalization of all cryptocurrencies combined. It provides a clear picture of Bitcoin’s interest among investors. A high BTC dominance typically happens before and during a bull run, in which investors resort to investing in relatively stable and high market capitalization cryptocurrency like Bitcoin. A drop in BTC dominance usually means that investors are moving their capital and/or profits to altcoins in a quest for higher returns, which usually triggers an explosion of altcoin rallies.
추천 기사


