


Ripple and Stellar outlook: XRP and XLM weaken as derivatives positioning fades
- XRP trades around $1.499 on Tuesday after a modest loss the previous day.
- XLM extends its correction, trading below $0.220 after falling more than 3% on Monday.
- Weakening derivatives metrics and fading bullish momentum suggest a cautious outlook for XRP and XLM.
Ripple (XRP) and Stellar (XLM) face pressure trading below $1.499 and $0.220, respectively, on Tuesday after a modest correction at the start of the week. Traders should be cautious as weakening derivatives metrics and fading bullish momentum suggest further corrections for XRP and XLM.
Weakening derivatives metrics
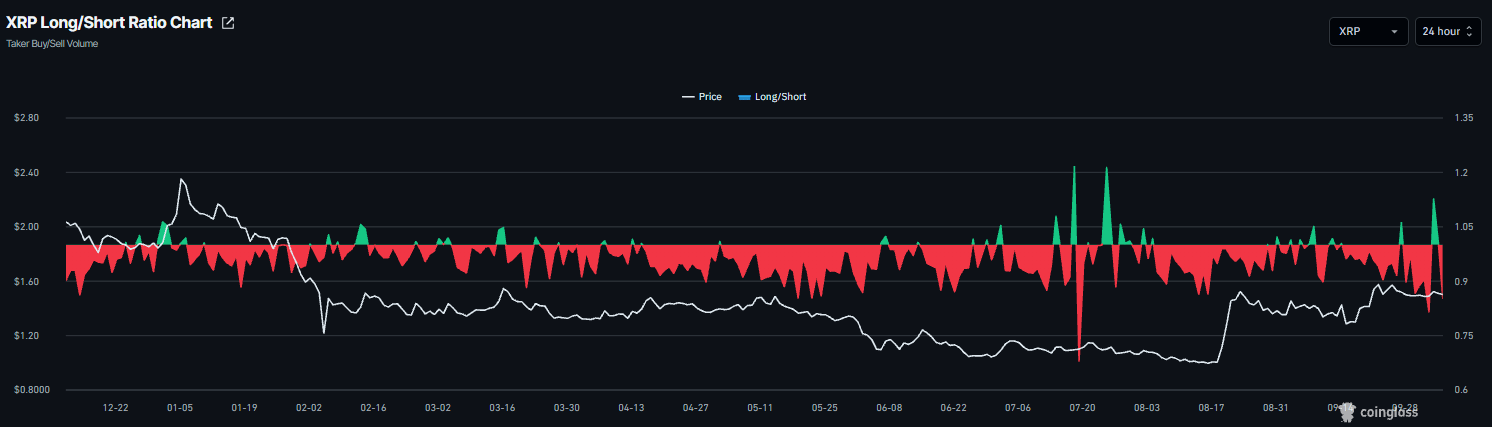
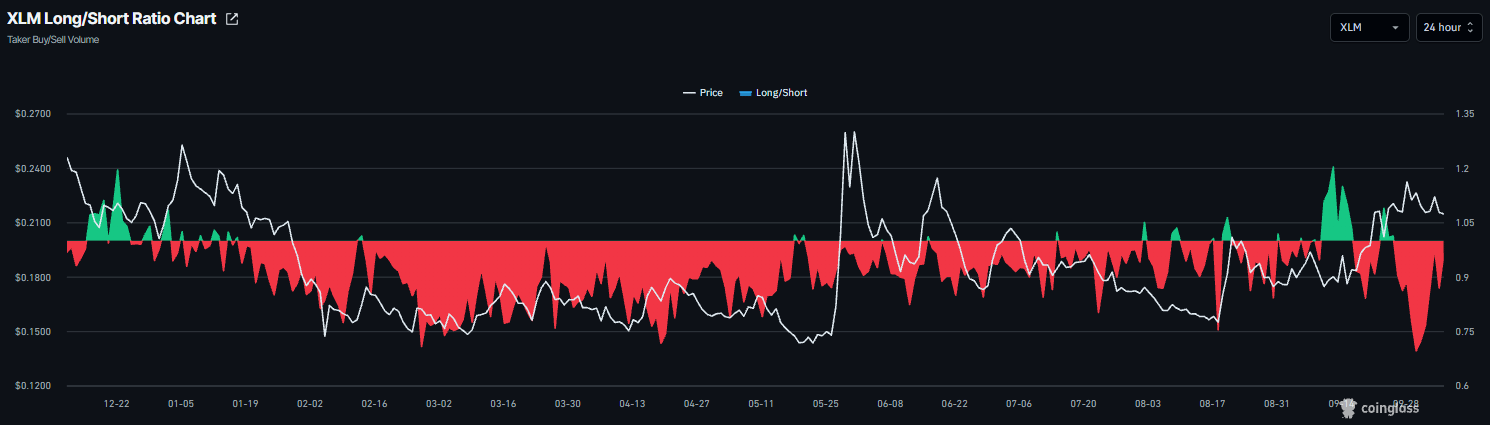
Derivatives data shows a weakening and cautious signal among traders. CoinGlass’ long-to-short ratio for Ripple and Stellar reads 0.85 and 0.96, respectively, on Tuesday. A ratio below one indicates bearish sentiment, as traders bet that asset prices will fall.
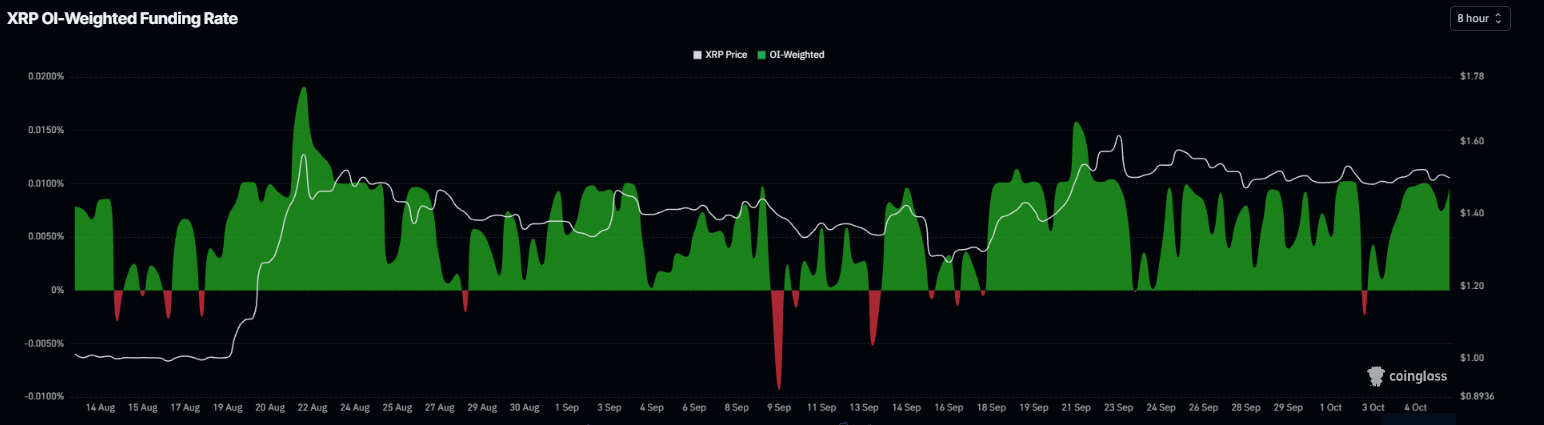
The XRP funding rate flipped positive on Saturday, reading 0.0097% on Tuesday. These positive rates indicate longs are paying shorts, reflecting a mild bullish outlook.
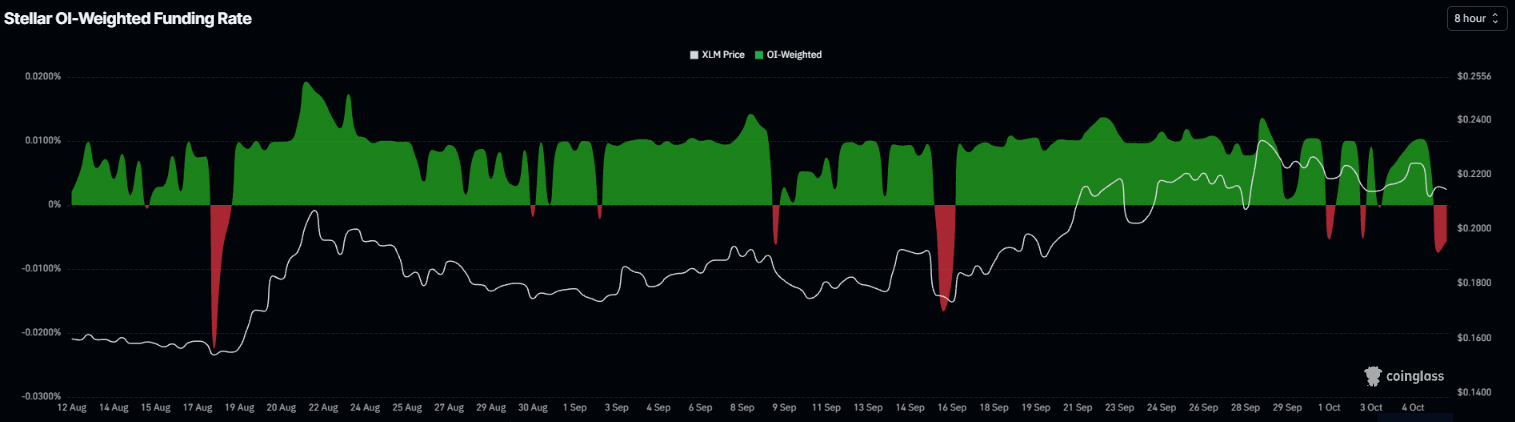
However, the XLM funding rate flipped negative on Monday, reading -0.0056% on Tuesday, indicating shorts are paying longs, reflecting a bearish outlook.
On-chain data shows bearish bias
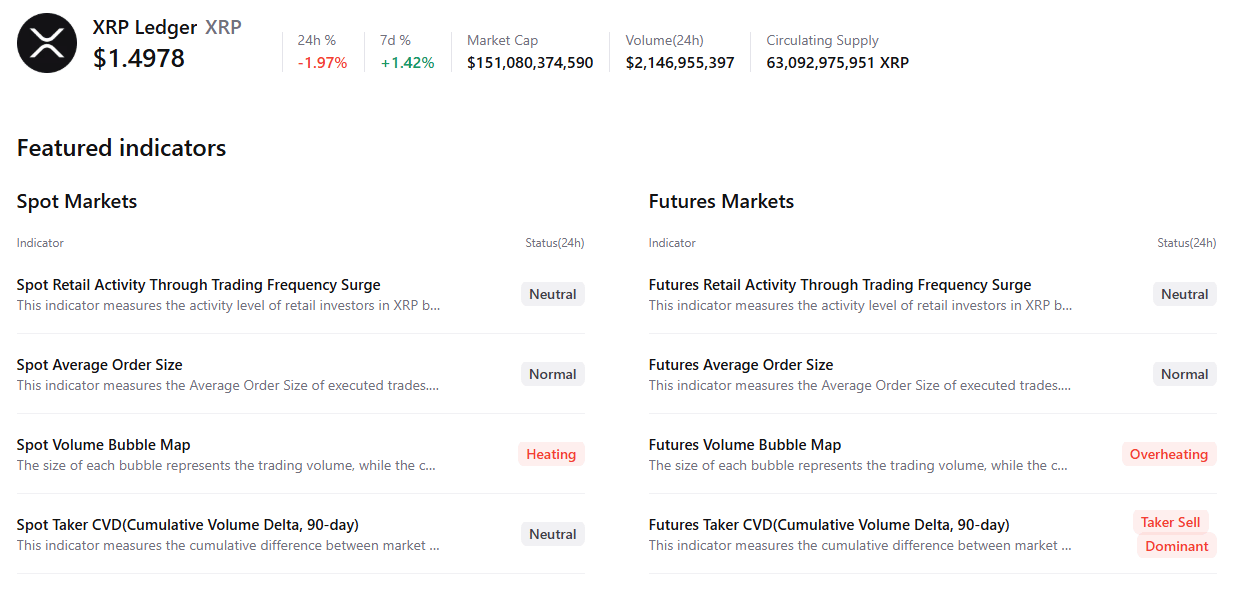
CryptoQuant’s summary data shows a bearish outlook for both altcoins. XRP’s spot and futures markets show overheating conditions, while the futures market shows sell-side dominance. These highlight a bearish, cautious sentiment bias among Ripple traders.
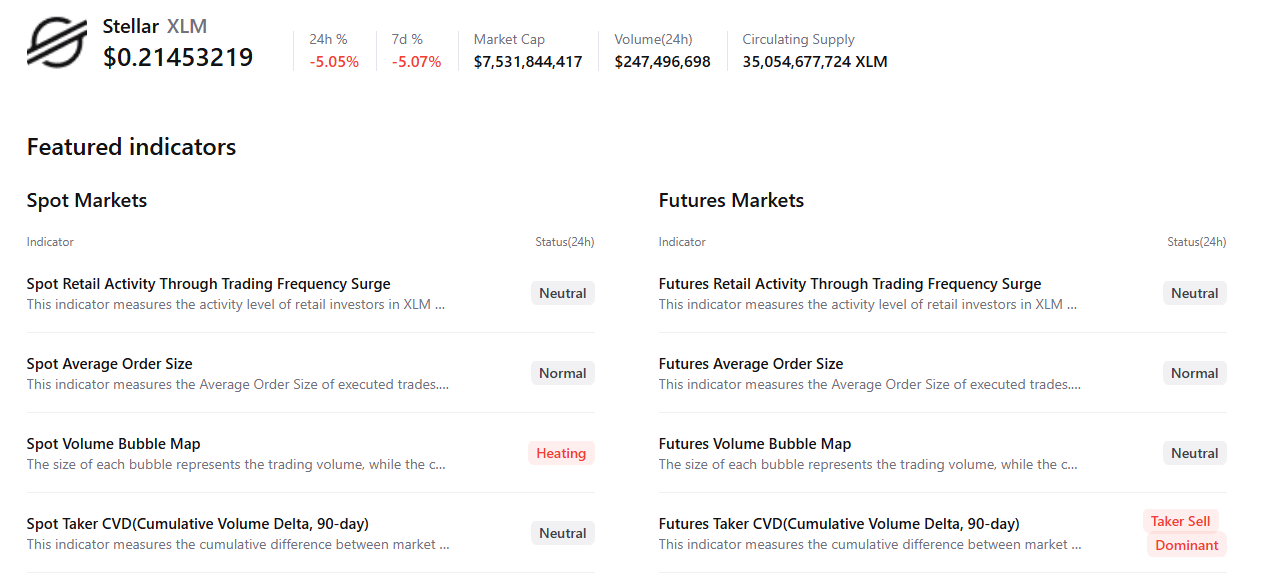
For XLM, spot shows healing conditions, while the futures market shows sell-side dominance, indicating a negative outlook among Stellar traders.
XRP technical outlook: Bulls remain under pressure
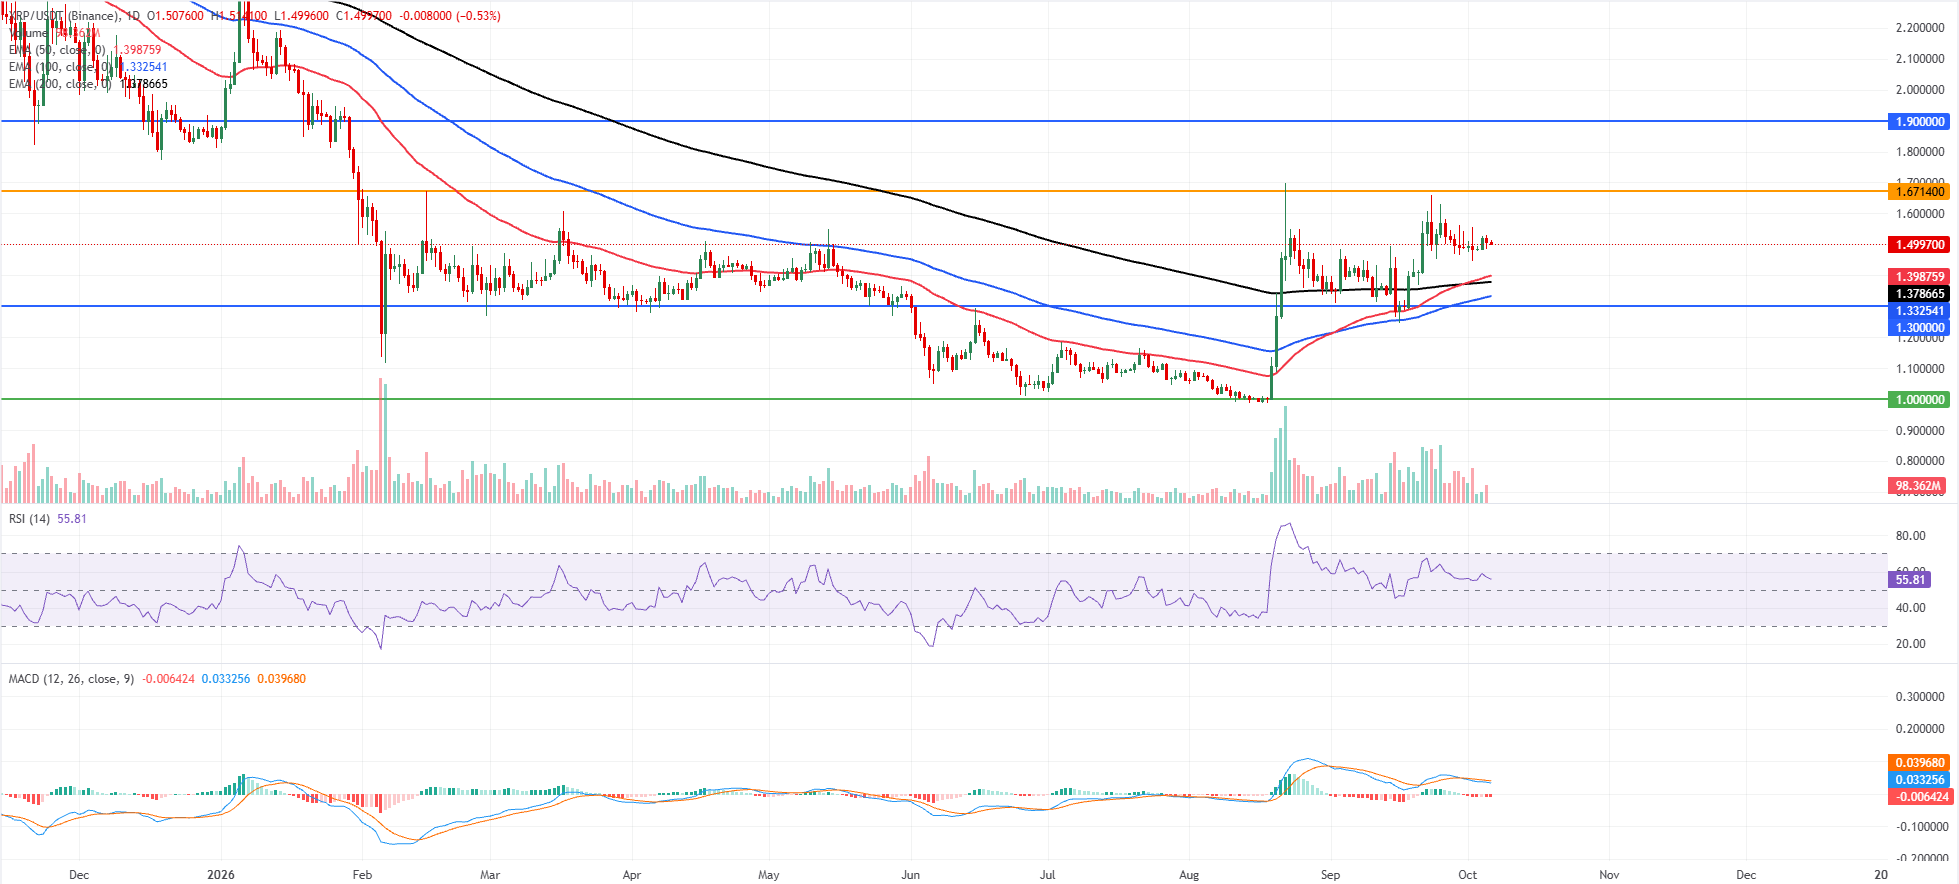
XRP price trades at $1.4996 on Tuesday after mild losses the previous day. XRP holds a constructive bullish bias as price extends above the 50-day, 100-day, and 200-day Exponential Moving Averages (EMAs) clustered between roughly $1.330 and $1.400, reinforcing a medium-term uptrend structure.
The Relative Strength Index (RSI) at about 56 stays in positive territory without being overbought, suggesting buyers still have the upper hand even as the Moving Average Convergence Divergence (MACD) remains slightly negative, hinting at a modest loss of upside momentum after the recent advance.
On the topside, immediate resistance is seen at the horizontal barrier near $1.671, with a further hurdle at $1.900, where prior supply could re-emerge if the rally resumes.
On the downside, the first layer of support aligns with the rising 50-day EMA around $1.398, followed by the 200-day EMA at $1.378 and the 100-day EMA near $1.332. In contrast, horizontal support at $1.300 and then $1.000 mark deeper demand zones if a broader corrective phase unfolds.
XLM technical outlook: Softening momentum indicators
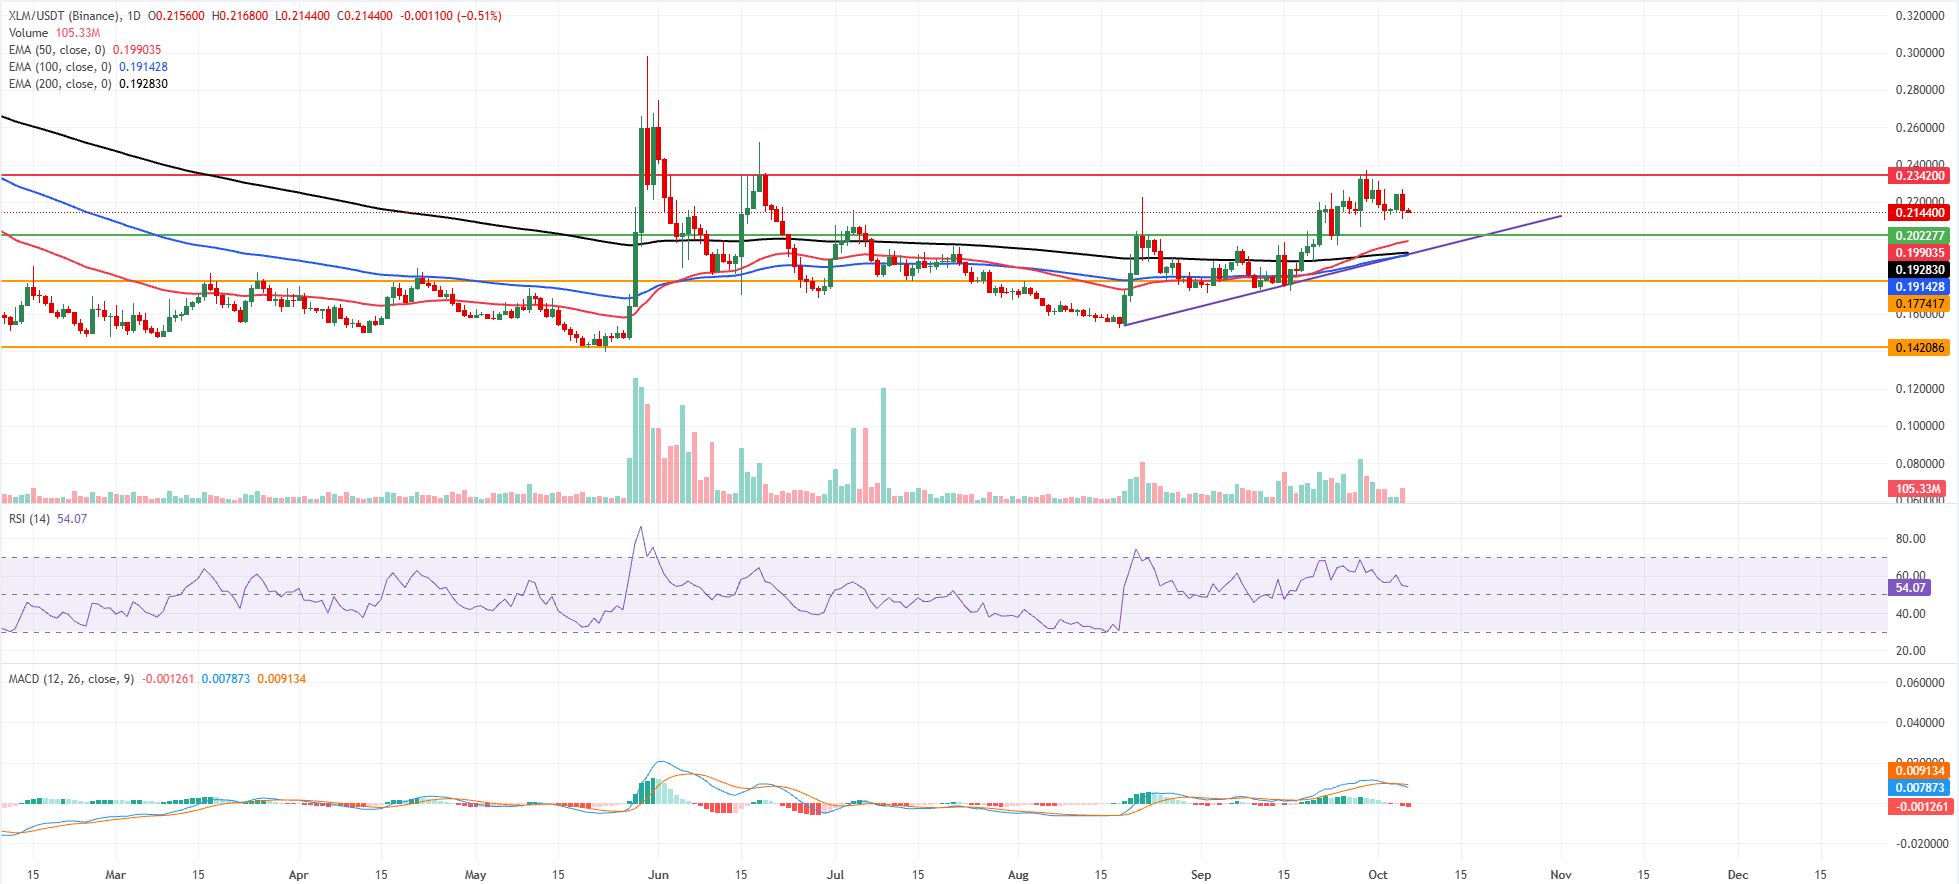
XLM price trades at $0.214 on Tuesday, holding a bullish near-term bias as it remains above the 50-day, 100-day and 200-day EMAs clustered between roughly $0.190 and $0.200. The upward-sloping trendline support around $0.191 reinforces the constructive structure, while the RSI near 54 suggests moderate, non-extreme momentum.
Despite the recent softening in the MACD, which has slipped slightly negative, the pair remains supported by its underlying trend levels rather than showing a decisive reversal.
On the downside, initial support is seen at the horizontal level near $0.202, followed by the 50-day EMA at $0.199 and a broader demand band formed by the 200-day EMA at $0.192, the rising trendline near $0.191 and the 100-day EMA at $0.191. Deeper support emerges at $0.177 and $0.142 if selling extends.
On the topside, the next key resistance sits at the horizontal barrier around $0.234, and a daily close above this level would open the way for continued upside.
(The technical analysis of this story was written with the help of an AI tool. Know more.)
Cryptocurrency metrics FAQs
The developer or creator of each cryptocurrency decides on the total number of tokens that can be minted or issued. Only a certain number of these assets can be minted by mining, staking or other mechanisms. This is defined by the algorithm of the underlying blockchain technology. On the other hand, circulating supply can also be decreased via actions such as burning tokens, or mistakenly sending assets to addresses of other incompatible blockchains.
Market capitalization is the result of multiplying the circulating supply of a certain asset by the asset’s current market value.
Trading volume refers to the total number of tokens for a specific asset that has been transacted or exchanged between buyers and sellers within set trading hours, for example, 24 hours. It is used to gauge market sentiment, this metric combines all volumes on centralized exchanges and decentralized exchanges. Increasing trading volume often denotes the demand for a certain asset as more people are buying and selling the cryptocurrency.
Funding rates are a concept designed to encourage traders to take positions and ensure perpetual contract prices match spot markets. It defines a mechanism by exchanges to ensure that future prices and index prices periodic payments regularly converge. When the funding rate is positive, the price of the perpetual contract is higher than the mark price. This means traders who are bullish and have opened long positions pay traders who are in short positions. On the other hand, a negative funding rate means perpetual prices are below the mark price, and hence traders with short positions pay traders who have opened long positions.
추천 기사


